Photoabsorption of Nan Clusters andVolume Plasmon:Experimental Results
2011-01-22
(American GoldmanSachs Group,New York 10821,USA)
As predicted by a lot of calculations (as reviewed in Ref.[1]), one expect to see a certain amount of photoabsorption in the spectra of Na clusters in the UV range, while this has never been done experimentally.Motivated by this, we carried out the photodepletion experiment to search for the volume-type plasmons.The clusters we choose are Na20and Na92covering the near-UV, as well as the visible parts of their resonance spectra[2].
1 Experimental setup
The experimental setup consists mainly of the supersonic source, detectors and laser system, as shown in Fig.1.In the source chamber we have a standard supersonic expansion source.Pure sodium is heated up to 640~670 ℃ and the vapor together with carrier gas is co-expanded through a heated supersonic nozzle of 75 μm in diameter, outside where the neutral clusters of various sizes are formed.The central part of the beam passes through a skimmer and is then collimated by a series of apertures: aperture A of 1.5 by 1.5 mm located ~65 cm away from skimmer, aperture B of diameter 2 mm located ~50 cm downstream of aperture A, and aperture C of 4.5 by 4.5 mm, 95cm downstream of aperture B.The ion optics eliminate the ions and the remaining neutral ones are then ionized by filtered ultraviolet light from an arc lamp, size selected by a quadrupole mass analyzer (QMA) and detected by a photo multiplier tube (PMT).The multichannel scaler collects the data and produces a time resolved mass scan (TRS).

图1 光吸收实验的示意图(大小未按比例).源的温度在640~670 ℃之间,载气的压强为4~6 atm. A, B, C 的大小分别为1.5×1.5, 2×2, 4.5×4.5 mm Fig.1 Outline of the experimental arrangement for optical absorption measurement by photodepletion spectroscopy (not to scale).The source is operated at a temperature of 640~670 ℃ with carrier gas pressure 4~6 atm.The size of the aperture A, B and C are 1.5×1.5, 2×2, 4.5×4.5 mm respectively
The laser system is a tunable Nd:YAG-Laser system manufactured by EKSPLA (model number NT342/3/UV).It consists of pump laser NL303, harmonics generators (SHG, THG), optical parametric oscillator PG122 (OPO) and UV extension (SH1, SH2), as sketched in Fig.2.
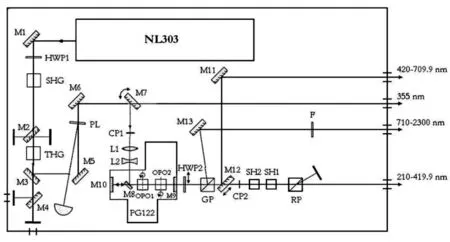
图2 NT342/3/UV Nd:YAG激光系统示意图.基本辐射由泵浦激光器NL303产生,通过SHG和THG转换成355 nm ,然后拆分成信号和闲频光.UV输出则是通过对信号光束的倍频得到 Fig.2 Schematic of the NT342/3/UV Nd:YAG-Laser system.The fundamental radiation of 1064 nm is generated by pump laser NL303 and converted into 3rd harmonics by SHG and THG.The 355 nm beam is then splitted by the OPO into a signal and idler.UV output is obtained by another frequency increase using SH1 and SH2
The pump laser generates optical pulses of the fundamental Nd:YAG radiation (wave- length 1064 nm) with duration of 3~6 ns/pulse and maximum repetition rate of 20 Hz.The fundamental radiation is converted into the third harmonic (355 nm) by SHG and THG, and then splitted into two beams of various wavelengths depending on the orientation of the OPO crystal: one visible (in the range of 420~709.9nm, so called "signal") and one near infrared (in the range of 710~2300nm, "idler").Making use of the SH1 and SH2 extensions, it can also generate signal in the UV region (210~419.9nm), i.e., it could cover the wavelength from 210 to 2300 nm continuously with a resolution of 0.1 nm.If the pump energy is set to about 110 mJ per pulse, the ideal maximum output would be a few mJ in the UV range and 10~30 mJ in the visible.Since the photoabsorption cross section varies with the irradiation photon energy and size of the cluster a lot, in order to have an appropriate on/off ratio we sometimes need to use neutral density filters (OD 0.5, 1.0, 2.0 or combinations of above) to reduce the amount of photons that illuminate the clusters.
To get an accurate measurement of the photoabsorption cross section, it is crucial to have the laser beam and the cluster beam very well aligned.The photo diode to the left of aperture A is for alignment purpose only and is out of the way of the beam during a measurement.It is made by Electro-Optics Technology, Inc.and the model number is ET-2020.Since photodiode is very sensitive to photons and reaches saturation at very low laser energy, two neutral density filters (OD 1.0 an 2.0 respectively) are placed in front of the active area, which is 2.55 mm in diameter.The output is monitored by an oscilloscope.
Since the cross section is inverse proportional to the laser fluence, it is vital to precisely measure the laser pulse energy that passes through aperture B.The energy detector that we used is a compact pyroelectric joule-meter made by Gentec (part number QE4-SP-S- MT-DO).The sensor is connected by a BNC cable to an oscilloscope, which reads the voltage output.The sensitivity (the ratio of the voltage output to the actual energy, in unit of V/J) depends on the absorption rate at different wavelengths and is calibrated by the manufacturer.For better accuracy, we usually take an average of ~100 pulses.This unit has a spectral range from 190 nm to 2.5 μm and active area diameter of 3.7 mm.To ensure we take into account all the photons that overlap the cluster beam, the detector is placed very close to aperture B (approximately 1 cm), which has a diameter of 2 mm.
2 Experimental procedure
Depending on the source condition, one measurement takes up to 15 hours excluding the alignment procedures.Once the vacuum meets the experimental requirement, we start to heat up the source reservoir.This usually takes 1~2 hours, in the mean time, we check the laser alignment and optimize the prisms again.Once the reservoir is heated to the appropriate temperature, we start to adjust the position of source and skimmer until the cluster counting rate is maximized, which means the source is well aligned.The skimmer could move in Z direction (along the cluster beam) and the source itself could move in X and Y direction.
Once the laser is well aligned and the source is ready, we measure the cross section of one cluster size at a certain wavelength in 3 steps.
1) Measure the laser pulse intensity using the energy detector.Set the wavelength of the output laser beam and move the energy meter in position so that all the photons pass through aperture B are registered by the energy meter QE4.Since it takes some time (about 1 minute) for the laser beam intensity to stabilize, every time the wavelength is changed, we wait a little bit before reading voltage from oscilloscope, in the mean time, we measure the background noise(with cluster beam blocked and laser beam on) and check if it is very low.Usually the energy is averaged over 100 pulses.
2) Move the energy meter out and take the time resolved scan (TRS) using multi- channel scaler (MCS).MCS is synchronized with the laser pulse which is set to its maximum frequency (i.e.20 Hz) with a duration of 3~6 ns.MCS is typically set to 100 channels with a dwell time of 50 μs per channel.We take 2000~4000 scans (2~4 minutes) depending on the counting rate of the cluster signal and noise level.As an example, Fig.3 shows the TRS for Na20 at wavelength 500 nm.

图3 激光波长为500nms时Na20的时间分辨扫描样本, 其中1~40信道对应光吸收后的信号强度 Fig.3 Time resolved scan (TRS) of Na20 with wavelength 500 nm.Channel 1~40 correspond to the depleted beam and the highlighted part is the depleted signal I which is taken as the average of the 7 channels centered at channel 22
Channel 1~40 correspond to the depleted beam.Upon absorbing a photon, clusters rapidly evaporate, so that following a laser pulse the counting rate of the selected cluster size drops and remains depleted for ~2 ms (corresponding to the beam flight time from the skimmer to the detector entrance).After that, the signal will get back to normal rate.Ideally the signal should be a step function: in the depleted region, it is a constant I while in the un-illuminated part, it is another constantI0.In reality, due to the spread of the cluster speed, the divergence of the laser beam and possible misalignment of the laser beam, the edge is not that sharp as seen in this figure.
3) Measure the average laser pulse energy once again to make sure that the laser pulse energy is not drifting during the scan.
In principle, we can scan many different cluster sizes one after another in step 2 and don't have to repeat the energy measurement.In practice, in order to get a good resolution for different clusters, we need to change AC/DC ratio unless the targeted masses are close enough (say Na19, Na20and Na21).Data points were acquired in 5 nm intervals between 220~420 nm and 10 nm intervals between 420~600 nm since the focus is the UV region.
Once we have these data, we can calculate the absolute cross section.
3 Experimental data
Since we are more interested in volume plasmons which correspond to higher energy photons, we collected data for sodium clusters of size 8, 19, 20, 21, 57, 58, 92 in the range of 210~420 nm.We also measured the spectra for size 20 and 92 in the visible range in order to check the accuracy of the data.The experimental cross section values for Na20and Na92are given in Fig.4,5.

图4 Na20的光吸收截面,其中红点代表实验数据 Fig.4 Photo-absorption cross section (per atom) of Na20 as a function of photon energy.Dots are experimental data; solid line is drawn to guide the eye

图5 Na92的光吸收截面,其中红点代表实验数据 Fig.5 Photo-absorption cross section (per atom) of Na92 as a function of photon energy.Dots are experimental data; solid line is drawn to guide the eye
4 Data validity and error analysis
a) Cross Section vs Photon Fluence.
To make sure that the photo depletion process is a linear process in our work, we have measured the photoabsorption cross section of Na8and Na20as a function of the laser intensities at some different wavelengths in the UV.Fig.6 shows the cross section as a function of the photon fluence at wavelength 320 nm.In this figure,Xaxis is the reading of the oscilloscope in unit of mV, which is proportional to the laser pulse energy,Yaxis is the photoabsorption cross section in arbitrary unit, different symbols stand for the calculation based on different number of channels.It is seen that in the range of 6~20 mV, (22~70μJ) the cross section is a constant and does not depend on the laser fluence.
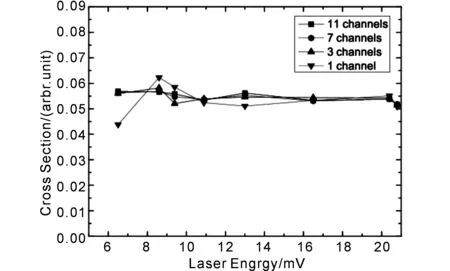
图6 Na20的光吸收截面与激光能量密度之间的关系图 Fig.6 Photoabsorption cross section as a function of laser fluence at wavelength 320 and 335 nm for Na20.Different symbols stand for the cross section calculated using different number of channels
For Na92, we do not have a complete set of data as for Na8and Na20, but repeated measurement of the photoabsorption cross section at different laser fluence.The cross section - fluence relation shows that one-photon process is also valid in this case, as seen in Fig.7.

图7 Na92的光吸收截面与激光能量密度之间的关系图 Fig.7 Photoabsorption cross section vs laser fluence for Na92.The squares, solid dots, triangles and circles are for wavelength 250, 305, 315 and 335 nm respectively
b) Comparison with Other Experiments.
Photoabsorption cross section in the visible range for Na20has been measured in different works previously; it is natural to compare our result with the existing experimental data.Besides the experiment by K.Selby et al., S.Pollack et al.also have measured the optical response of Na20in a similar manner[3].They have covered the wavelength in between 370 to 600 nm with resolution of better than 20 Å.
The errors on absolute cross sections were conservatively estimated as ±50%.The comparison between our data and these two works is shown in Fig.8.We find that our data match the other two very well.The position, shape and strength of the surface plasmon are all in very good agreement.To the best of our knowledge, there have been no prior measurements for Na92.

图8 可见光部分的数据与以前的实验结果的对比 Fig.8 Comparison of experimental data for Na20 in the visible with previous works.Solid line is a smoothed line through the present data points; triangles are data points of Ref.[12]; dots are data points adapted from Ref.[3]
c) Error Estimation.
To estimate the relative error bars of the experimental data, we combined the uncertainties derived from different channels and repeated experiments.It is found that the typically error bars are ≈ 15% for Na20and ≈ 20% for Na92except a few data point.The slightly larger uncertainty for Na92than Na20is because of the lower intensity of the Na92cluster signal.It is seen that our data agree with Selby's and Pollack's within the error limits, see Fig.9.

图9 Na20实验数据的误差分析 Fig.9 Error analysis of experimental data for Na20 in the visible with previous works.Solid line is a smoothed line through the present data points; triangles are data points of Ref.[12]; dots are data points adapted from Ref.[3]
5 Discussion
The visible portions of both plots exhibit the strong surface-plasmon resonances, which is known and has been studied extensively.An important new part of the data is the considerable tail extending into the UV.
Before proceeding with a quantitative discussion, it may be worth noting that both clusters display a weak undulation between 3.5 and 4.0 eV, which is close to their ionization potentials of 3.75 eV (Na20) and 3.47 eV (Na92)[4,5]and is therefore possibly related to the opening of the continuum channel for electron emission[6].
a) Fitting Results.
The Na92spectrum was fitted to three Lorentzian peaks, while for Na20either three or four peaks could be used, the latter choice appearing more suitable.
For Na20, the fitted peaks are depicted in Fig.10, the fitting parameters and uncertainties are listed in Tab.1.
表1 Na20的拟合参数
Tab.1 Fitting parameters for Na20: peak energies (E), widths (F, FWHM), and areas (Å, per atom) derived from fits to the Na20photoabsorption pro- files.Quantities in parentheses are estimated uncertainties in fitting parameters

PeakE/eVF/eVA/(eV*Å2)Peak14.04(0.03)1.19(0.07)0.15(0.01)Peak23.17(0.02)0.52(0.02)0.13(0.01)Peak32.77(0.01)0.23(0.01)0.10(0.01)Peak42.42(0.01)0.26(0.01)0.40(0.01)

图10 Na20的光吸收截面的拟合结果 Fig.10 Photoabsorption cross sections per atom of Na20 nanocluster.Circles: photoabsorption cross sections of Na20, solid line: fit to the data by means of sum of Lorentzian profiles (dashed lines).The shaded peak is the volume plasmon which becomes dipole-active in finite particles
As a comparison, the fitting parameters from Ref.[3] are listed in Tab.2.The center of the 2 major peaks agree perfectly (peak I and II vs peak 3 and 4), but the width and area of these peaks differ from our fitting, because we have a larger data sample that extends into UV.The interesting part is the additional broad peak centered at 4.04 eV in our fitting.Before going into the explanation, let us take a look at the fitted peaks for Na92which are depicted in Fig.11, and the fitting parameters and uncertainties are listed in Tab.3.It is seen that for Na92, besides the peaks in the visible, there also exists a broad peak centered at 4.20 eV.
表2 文献[3]中的Na20拟合参数
Tab.2 Fitting parameters for Na20as in Ref.[3].The original fitting parameters are converted into peak energies (E), widths (F, FWHM), and areas (Å, per atom) for easier comparison

PeakE/eVF/eVA(eV*Å2)PeakI2.780.40.12PeakII2.420.20.33
表3 Na92的拟合参数
Tab.3 Fitting parameters for Na92: peak energies (E), widths (F, FWHM), and areas (Å, per atom) derived from fits to the Na92photoabsorption profiles.Quantities in parentheses are estimated uncertainties in fitting parameters

PeakE/eVF/eVA(eV*Å2)Peak14.20(0.08)1.16(0.15)0.093(0.016)Peak23.24(0.03)0.37(0.04)0.07(0.01)Peak32.80(0.01)0.42(0.01)0.50(0.02)
b) Existence and Redshift of the Volume Plasmon.
Of particular interest for our present purposes is the broad peak slightly above 4 eV, labeled Peak 1 in Table 1, 3 and shaded in Figs.10 and 11.In Na20it is slightly more red-shifted (ω= 0.68ωp, whereωp= 5.9 eV is the bulk free-electron sodium plasma frequency) and comprises a higher fraction of the area of the listed peaks (19%) than in Na92(0.71ωpand 14%).This behavior is in clear correspondence with that illustrated for a dipolar "volume plasmon" resonance.The absolute magnitudes of the frequency and the red shift are also in very good agreement with theoretical predictions for such a resonance: e.g., the analytical calculation in[7]yielded ≈ 0.75ωpfor its position, and ≈ 20% and ≈ 15% for its weight in Na20and Na92, respectively.The manifest match between the behavior and parameters of the UV feature and the predicted nanocluster “volume plasmon” resonance enables us to identify them with each other.

图11 Na92的光吸收截面的拟合结果 Fig.11 Photoabsorption cross sections per atom of Na92 nanocluster.Circles: photoabsorption cross sections of Na92, solid line: fit to the data by means of sum of Lorentzian profiles (dashed lines).The shaded peak is the volume plasmon which becomes dipole-active in finite particles
c) Remaining Oscillator Strength.
Even though they extend to higher frequencies than previous experiments, the peaks in Figs.10 and 11 still do not encompass the full dipole oscillator strength f of the delocalized cluster valence electrons: the peaks in Tab.1 and 3 correspond tof= 71% for Na20andf= 60% for Na92, significantly lower than the value from TRK sum rule.Therefore additional photoabsorption channels must be present in other frequency ranges.For example, even though cross sections become small at the high-frequency end of the plots, the excitation of individual valence electrons into the continuum has been predicted to produce a low but very long photo-ionization tail[8], thereby accommodating an appreciable amount of these electrons′ oscillator strength.
One could roughly estimate the distribution of the remaining oscillator strength based on TRK and polarizability sum rules.For example, in the case of Na20, the remaining strength should be 0.29 as from TRK sum rule.And from the polarizability constraint, one could find thatE5=2.2 eV, given the static electric polarizabilityα(ω= 0) = 1.85 in unit ofR3[9].
Thus the high energy ionization tail must be accompanied by enhanced valence electron absorption in the IR (cf.[10]), most likely due to individual electron-hole excitations.A search for cluster electron photoabsorption at both of these frequency limits, while experimentally quite challenging, would be very interesting and informative.
d) Comparison of Different Cluster Sizes.
One interesting fact to notice is that although the cross section profile for Na20and Na92differ a lot in the visible range (besides the difference between the center of the surface plasmon peak, the peak value of these two absorption differ by about 20%, and this trend coincides with theoretical prediction), they are very close in the UV range (see Fig.12).A further comparison with other clusters shows a similar picture for Na19, Na21, Na57, Na58(this on the other hand confirms that our data are reliable).The only exception is Na8, which is significantly lower than others.According to Ref.[11], the volume plasmon should have a higher fraction of the total area than Na20.Intuitively, the cross section in the UV region should be at least as much as that of Na20(and others).However since the Na8surface-plasmon peak is noticeably more red-shifted than the Na20one[12,13], the same may be expected for its volume plasmon, hence it would possess a lower amplitude in the UV region.

图12 Na20和Na92的光吸收截面的比较 Fig.12 Comparison of photoabsorption cross sections per atom of Na20 and Na92 nanocluster.In the visible range, the profiles differ a lot, but in the UV range, they are very close
6 Conclusion
In summary, the photoabsorption spectra reported here provide the first experimental observation of optically excited "volume plasmon" collective electronic states in metal nanocluster particles, a phenomenon unique to finite systems.
[1] Xia C, Yin C, Kresin V V.Photoabsorption by volume plasmons in metal nanoclusters[J].Phys Rev Lett, 2009,102:156802-156805.
[2] Dahlseid T A, Koretsky G M, Pollack S, et al.Nuclear Physics Concepts in the Study of Atomic Cluster Physics[M].Berlin :Springer, 1992.
[3] Pollack S, Wang C R C, Kappes M M.On the optical response of Na20 and its relation to computational prediction[J].J Chem Phys, 1990 ,94:2496 -2501.
[4] Persson J L.Dissertation[D].Los Angeles:University of California, 1991.
[5] Chandezon F, Bjornholm S, Borggreen J.Electronic shell energies and deformations in large sodium clusters from evaporation spectra[J].Phys Rev B, 1997 ,55;5485-5490.
[6] Brechignac C, Cahuzac P, Carlier F,et al.Ionization vs.neutralization in alkali-atom clusters[J] J Phys II France, 1992 ,2:971-983 .
[7] Kresin V V.Collective resonances and response properties of electrons in metal clusters[J].Phys Rep, 1992 ,220: 1-52 .
[8] Frank O, Rost J M.From collectivity to the single-particle picture in the photoionization of clusters[J].Phys Rev A, 1999, 60:392-397 .
[9] Tikhonov G, Kasperovich V, Wong K.A measurement of the polarizability of sodium clusters[J].Phys Rev A, 2001, 64: 063202-063206.
[10] Kim Y H, Tanner D B.Far-infrared absorption by aluminum small particles[J].Phys Rev B, 1989, 39: 3585-3589.
[11] Brack M.The physics of simple metal clusters: self-consistent jellium model and semiclassical approaches[J].Rev Mod Phys, 1993, 65: 677-732.
[12] Selby K, Vollmer M, Masui J,et al.Surface plasma resonances in free metal clusters[J].Phys Rev B, 1989, 40: 5417-5427.
[13] Pollack S, Wang C R C, Kappes M M.On the optical absorption spectrum of Na2Cl[J].Chem Phys Lett, 1990, 175: 209-215.
