Statistical Overview of Tungsten Supply and Demand in the Global Market
2010-12-31MichaelMaby
Michael Maby
(International Tungsten Industry Association,London W4 4JE,UK)
0 Introduction
This Report is a compilation of the statistics to end 2008 to assess the supply of,and demand for,virgin primary tungsten.All the data is expressed in W content unless otherwise indicated.
In some cases,the data used to compile the summaries is supplied confidentially.It is preferable to compile accurate data by region rather than by country to ensure the input of reliable information.
As the availability and accuracy of governmental trade data improves,such data has provided the basis of most of the statistics in this Report;the occasional anomaly is usually easy to spot and eradicate.There are always discrepancies between import and export data(e.g.different time periods)and this Report uses the reported import data when two sets of figures are available unless there are very specific grounds for not so doing.
Whilst some general comments are included regarding 2009 and reference is made to newmining projects,no speculation is permitted with regard to future price levels so do not be disappointed.
1 Production and Supply
1.1 General
Production data for Austria,Canada and Portugal is actual,but other statistics are based on reported imports.As you no doubt know,in October this year,Cantung ceased production for six months.
Production in(and supply from)countries other than China,Russia and DPR Korea reached 9 810 t in 2008,down 500 t from 2007.Most countries maintained the high production levels of 2006/2007 and supplies from Thailand in particular doubled to over 850 t.
1.2 China
Reported imports from China totalled 23 800 t(down 3%on 2007)compared with China’s own export data (Customs Statistics)of 21 850 t(down 12%on 2007).To end September this year,exports totalled only 6 500 t (under 9 000 t annualised).Destinations percentage-wise in 2008 were:Europe-33%;Japan-32%;USA-17%;Other-18%.
The quota on exports of intermediates,excluding ferro tungsten,was 14 900t,reduced in 2009 to 14 600 t and to 14 300 t in 2010,and there were 13 approved exporters(reduced to 12 in 2009).Themining quota(introduced in 2002)was reportedly increased from 43 500 t in 2007 to 47 100 t in 2008.
Despite forced cut-backs because bad weather damaged power supplies early in the year and a restriction on dynamiting during the run-up to the Olympics,the official statistics show production in China in 2008 at 43 500t,up 6%on 2007.Additional tonnages from illegalmining have apparently greatly reduced in recent years following a severe crackdown by the Chinese Government but may still amount to an extra 5%to 10%.China’s largest tungstenmine,Hengluokeng in Fujian,began production at the beginning of the year with a target of 2 000 t per annum of wolframite and scheelite.Themine’s principal joint owner is Xiamen Tungsten Co Ltd.
The spate of measures implemented in 2007 by the Government to conserve tungsten resources,control exports and ensure supplies to meet rapidly increasing domestic demand have been summarised elsewhere.These measures did not abate in 2008 and the year began with an increase from 5%to 10%in the export tax for tungsten oxide.Then the State Council announced that consideration was being given to stockpiling strategicminerals resources,including tungsten.In September,it was reported that a new license system for exporters of ferro-alloys would be introduced.The list included ferro tungsten,hitherto excluded from the quota system for other tungsten products.And I would like to hear from the audience whether or not ferro tungsten is,or is not,now included.
Themining industry in general in China continues to face increasing pressure from the Government to improve environmental controls and reduce pollution,quickly and extensively,ormines face compulsory closure.
1.3 Russia
For the first time,there was a speaker at the 21stITIA Annual General Meeting from the Russian industry who remarked that the decline in production from a level of some 16 000 t in the 1980s to 3 000 t in 2008 had left only the scheelite deposit Vostok II in the Primorsky region and 3 or 4 very small wolframitemines in operation.
Reported imports from Russia in terms of quantity of different products over the last 5 years are analysed in Table 1 declining by 31%from 4 300 t in 2007 to 2 950 t in 2008(mostly concentrates).Stocks are still supplementing production as most of the latter is consumed domestically.
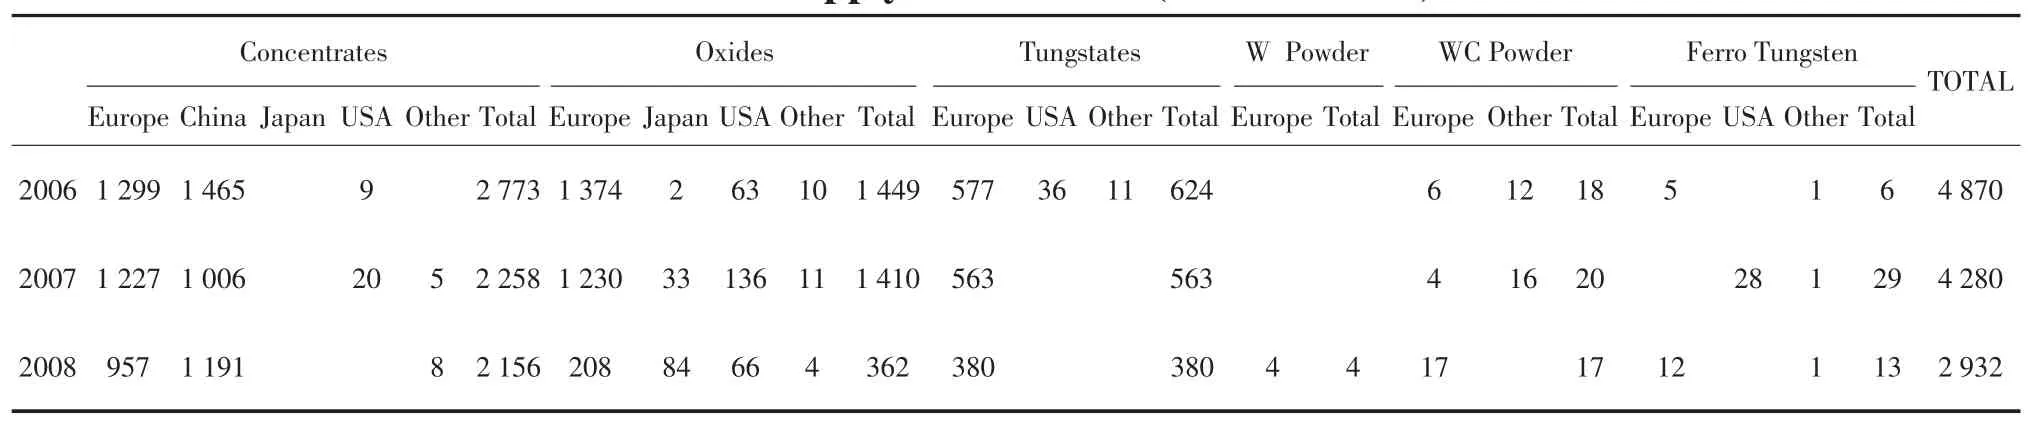
Table 1 Supply from Russia(mt W content)
1.4 US Stockpile
Sales in the calendar year 2008 amounted to 1 600 t(3.5million lbs).The limit in the fiscal year October 2008 to September 2009 is again 8 million lbs of concentrate and 300 000 lbs of tungsten powder and there are some 20 000 t(44 million lbs)left in the stockpile,mainly concentrates,with a maximum monthly award to any one company of 200 000million lbs.
1.5 Sources of Supply(Table 2)
2 Demand and Consumption
2.1 General
Demand is calculated by the addition of:(1)Reported imports of concentrates ex-world;(2)Reported imports of intermediate products from China and Russia(for countries where no import statistics are available,export data from these two sources have been used).
Demand reflects the supply of the raw material to the market in a specified period,whether purchased for consumption or stocks.In other words,an attempt is made to keep track of annual concentrate production and supply worldwide and to evaluate the demand by geographical area.
Actual consumption,including recycled material,is much more difficult to assess as are future trends because the economies of the main consumer countries remain a major influence on the tungsten industry.The consumption of scrap is very high in several companies in the Western World but companies keep data confidential and the ITIA’s quarterly summaries offer the best guide:the reported consumption of scrap represented 70%of APT production amongst companies which contributed data in Europe,Japan and the USA in 2008(Table 3).
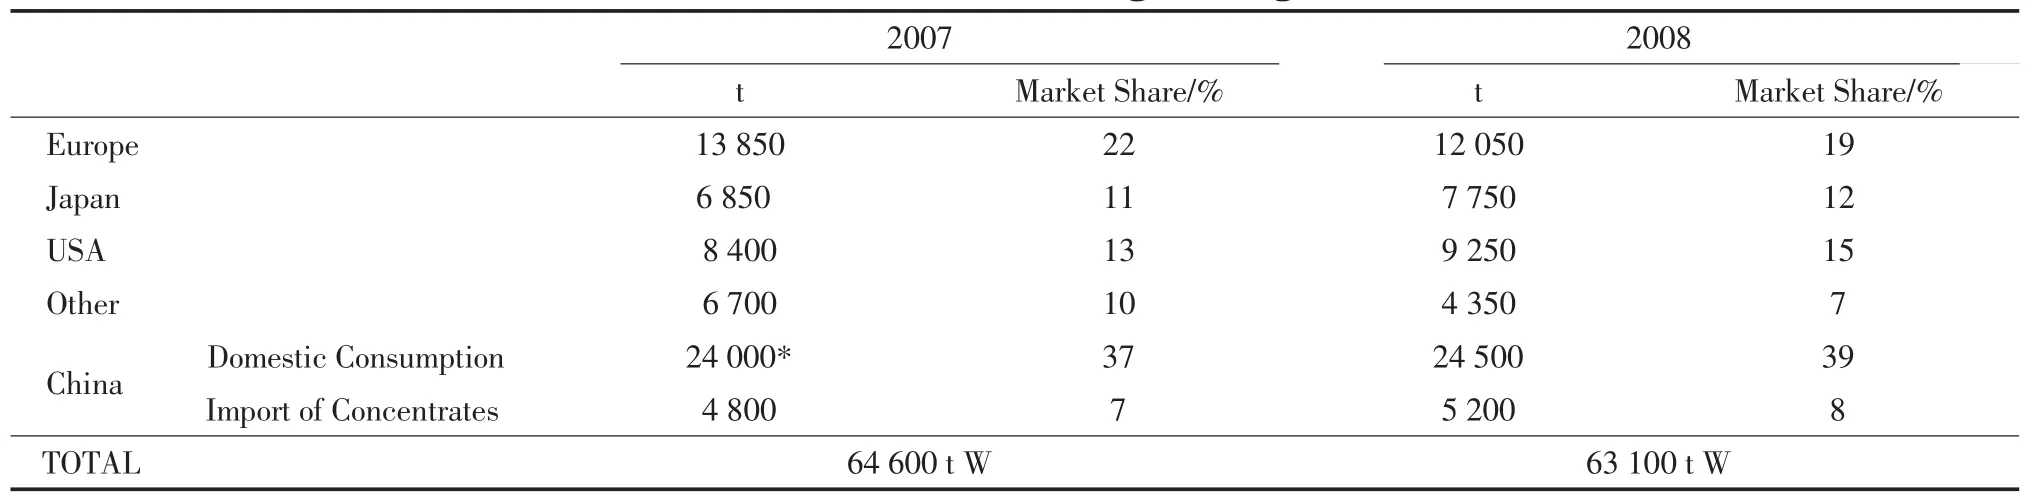
Table 3 Demand for Virgin Tungsten
Total demand is estimated at 63 100 t in 2008,a 2%decrease from 2007,implying consumption at 82 000 t if the usual average figure of30%for recycled material isadded.Thispercentage mayneed increasingsubstantially-50%would give us 95 000 t for example.
2.2 China
I have not seen an official figure for 2008 and an estimate of 24 500 t has been used(up 2%).Consumption figures for China include recycled material,perhaps between 30%~40%.
The increase in imports of concentrates by China continued in 2008,to 5 220 t(up 9%)from 18 different sources,the largest being Canada(31%),Russia(23%),Thailand(14%),DR Congo(10%),Rwanda(6%)and DPR Korea(5%).To end September 2009,the total was 4 000 t.
2.3 Europe
It is in Europe that the main divergence occurs between China’s export data and reported import data and most of that difference relates to ferro tungsten.
Demand fell again in 2008(down 13%to 12 050 t).Adding 30%to this figure would give a real consumption level of 15 650 t but aminimum 70%addition might be more realistic.The speaker at the AGM in 2008 estimatedthatconsumptionhadgrownbyover28%inthelastfiveyears,to23000t.Germanyiseasilythelargest consuming country,followed by Austria and Sweden,with hardmetal occupying by far the largest application at 72%(as illustrated).Given that the main consumers of hardmetal are the auto and general engineering industries,the current economic crisis is likely to have an adverse impact on tungsten consumption.
A review of the anti-dumping duty(33%)on tungsten carbide from China is currently taking place.
2.4 Japan
Imports of intermediates,almost entirely from China,amounted to 7 750t,up 13%on 2007.Consumption has been reported at around 9 000 t per annum since 2004 but this may be overstating the facts.Scrap is mainly exported because of the lack of domestic facilities for recycling and the high cost of processing.
The economic crisis was described by the speaker in Vancouver as a“tsunami” which had seriously damaged the tungsten industry,notably because of the downturn in car production which accounts for nearly 60%of cemented carbide usage.Whilst a recovery had begun,it would be slow.
2.5 Russia
In the days of the Soviet Union,annual consumption,mainly by the military,was in the region of 16 000 t;further purchases were made by the Government stockpile including 8 000 t of concentrates imported from China.As military applications diminished drastically with the collapse of the Soviet Union,consumption fell to its current level of 3 000 t including recycled material(some 30%).
The effect on the market both domestically and internationally of subsequent sales of large tonnages from the Government stockpile has been well documented.
2.6 USA
In 2008,demand at 9 250 t for concentrates from various sources and for intermediates almost entirely from China increased by 10%over 2007;total consumption by end-use,including scrap,is estimated by the USGS at 14 200t,an increase of nearly 7%over the(revised)total of 13 300 t for 2007.The implication from the difference between demand and consumption is that recycled material comprised over 53%of the total consumption although the estimate by the USGS is 35%.More than half of the tungsten consumed was used in cemented carbide parts for cutting and wear-resistant material,mainly in the construction,metalworking,mining and oil/gas drilling industries.
As we heard in Vancouver,demand for cemented carbides is down some 35%this year although a slow recovery is forecast for 2010.
2.7 Other
The other principal importers of raw materials are given below(Table 4),based on(rounded)data sourced from China’s export statistics.The decrease between 2007 and 2008 is high at 35%.
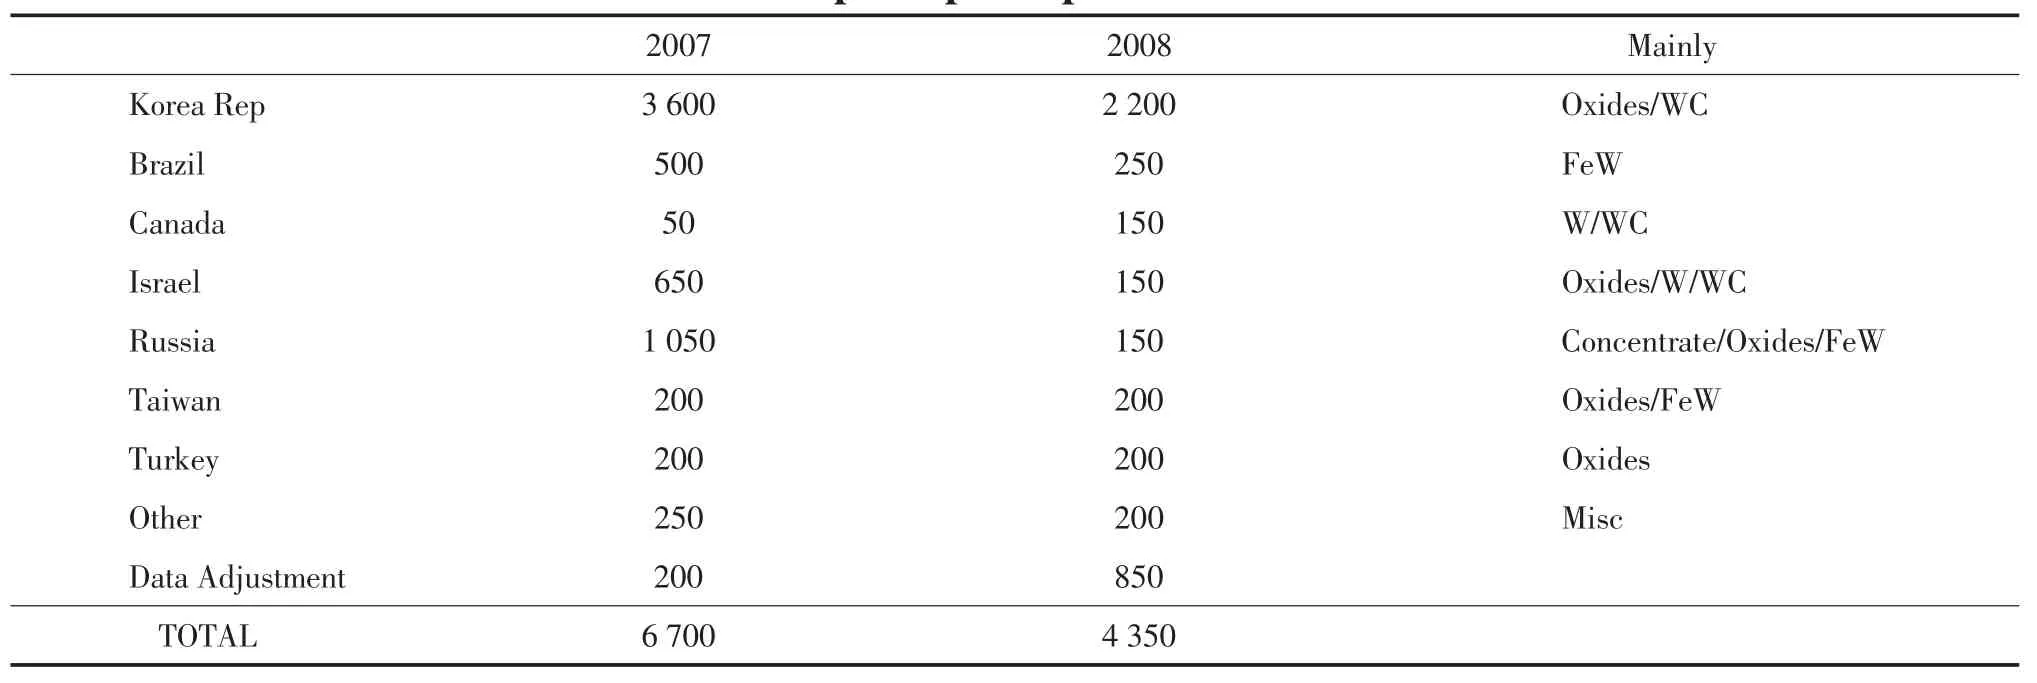
Table 4 The other principal importers of raw materials t
2.8 Consumption by End-Use Sectors
Latest estimates are given.
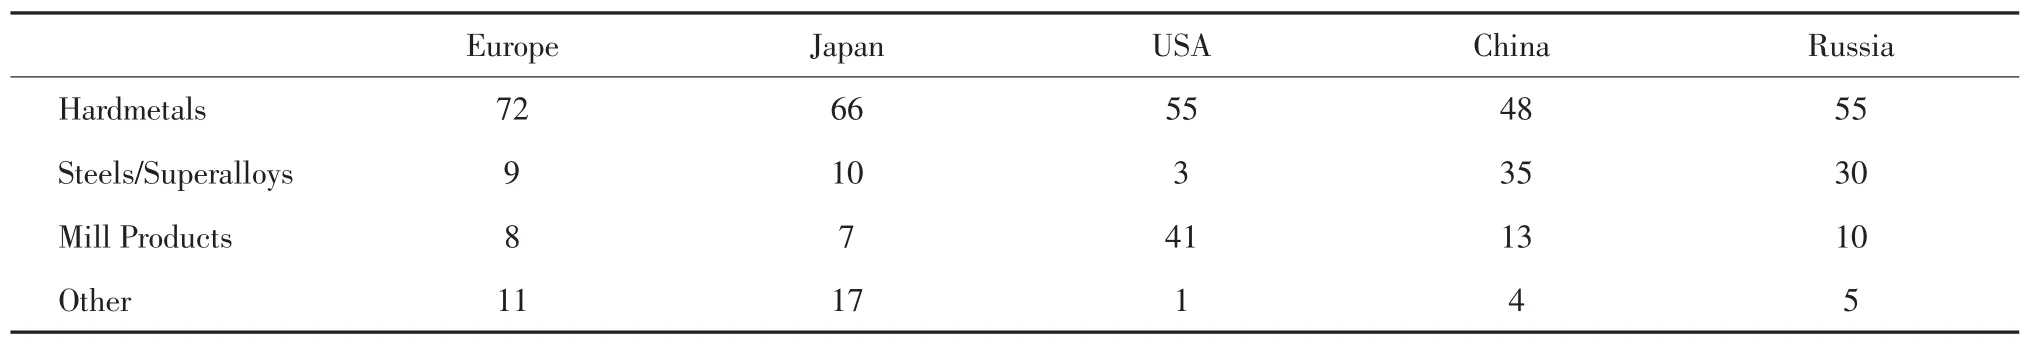
Table 5 Consumption by End-Use Sectors%
3 Supply and Demand(2003-2008)
For a summary of sources of supply,and demand by destination.As shown in Table 6 and Table 7.
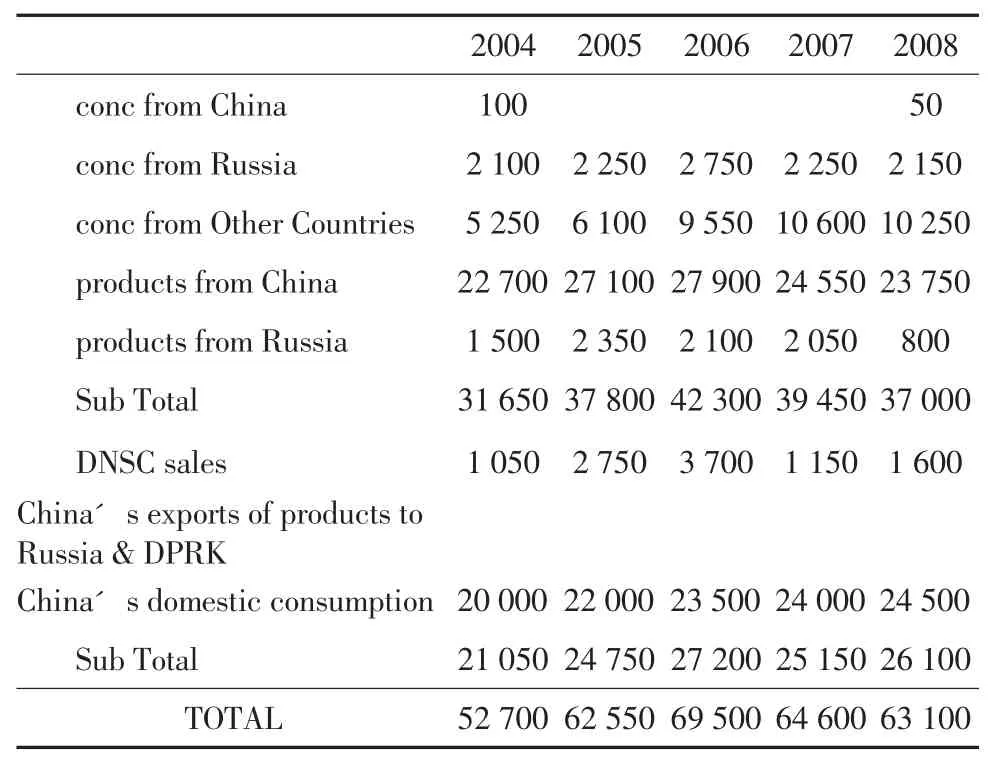
Table 6 Analysis of Supply(mt W content)
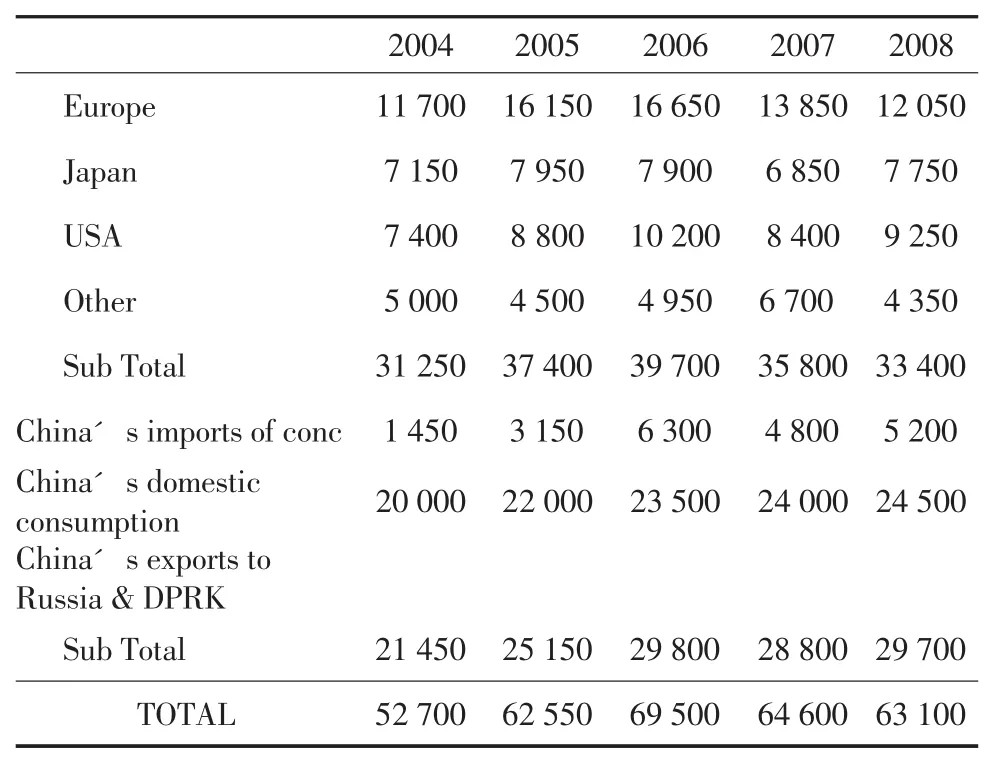
Table 7 Analysis of Demand(mt W content)
4 “Metal Bulletin”Quotations
The downward trend in the European APT quotation towards the end of 2007 was reversed early in 2008 and only fell as the economic crisis took hold in November(Figure 1).Only the US APT quotation remained unchanged throughout the year.In 2009,APT prices have fallen in Europe from an average of$220 in 2008 to$198 and in the USA from an average of$278 to$182.Ferro tungsten prices have followed the same trend,down from $34 perkg W to$27 perkg W.
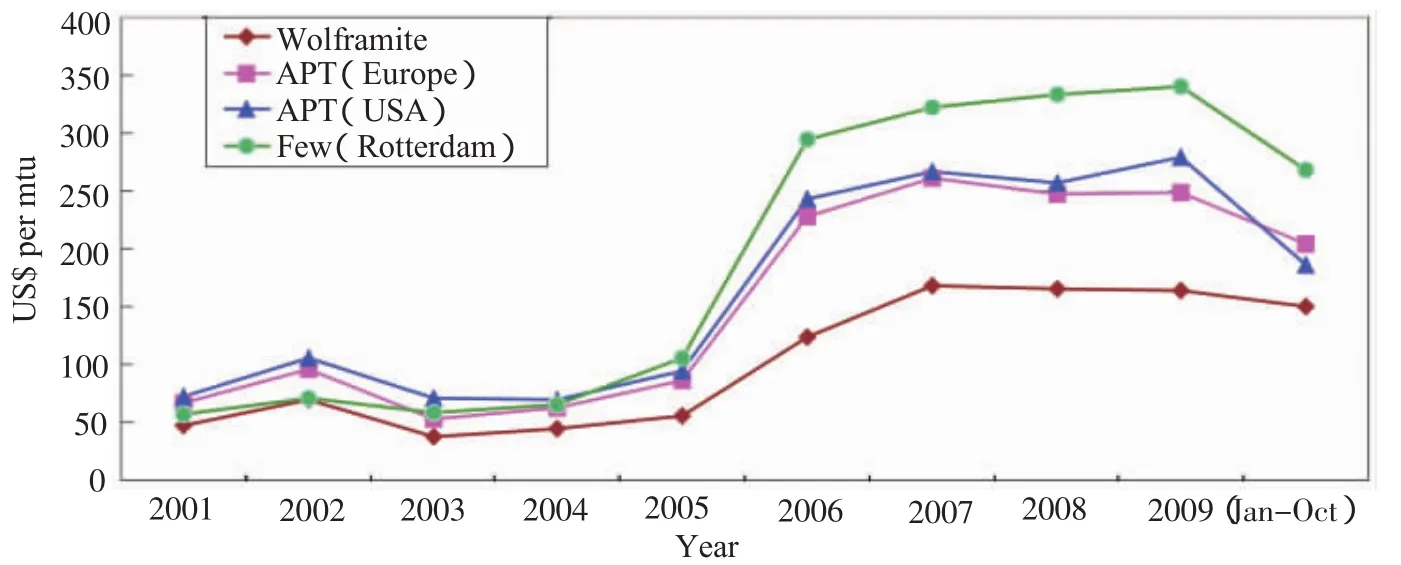
Figure 1 Metal Bulletin Quotations(Annual Average)
5 Closing Remarks
I have already remarked on the relevance of the economy to the tungsten industry and,as we all know,predictions even amongst experts not only vary but are often far wrong.So at the AGM in September 2008,a major concern expressed amongst delegates was about future sources of supply,given the apparent healthy economy and the impact on demand by consumers.A dozen new members had joined ITIA,mainly prospective producers,and a list of newmining projects(Table 8)which I had prepared indicated 50 names in various countries(but excluding China as I could not obtain the necessary information).Forecasts suggested an extra 10 000 t would be available to the market by 2011.
That was September 2008 and we all know what happened a month later.The economic crisis caused funding for many of these projects to collapse and the forecast ceased to be credible.I know only of onemine on this list which is actually producing and selling tungsten-Ormonde’s Barruecopardo desposit in Spain.
There is one name here which was not included in the original list-Newcrest Mining in Western Australia.I had heard of the company as a gold and copper producer but never in relation to tungsten.So it came as a considerable surprise this year when Newcrest asked to give a presentation at our AGM’s about plans for their O’Callaghanmine to become the world’s largest producer by 2013-at around 3 800 t per annum of wolframite and scheelite.
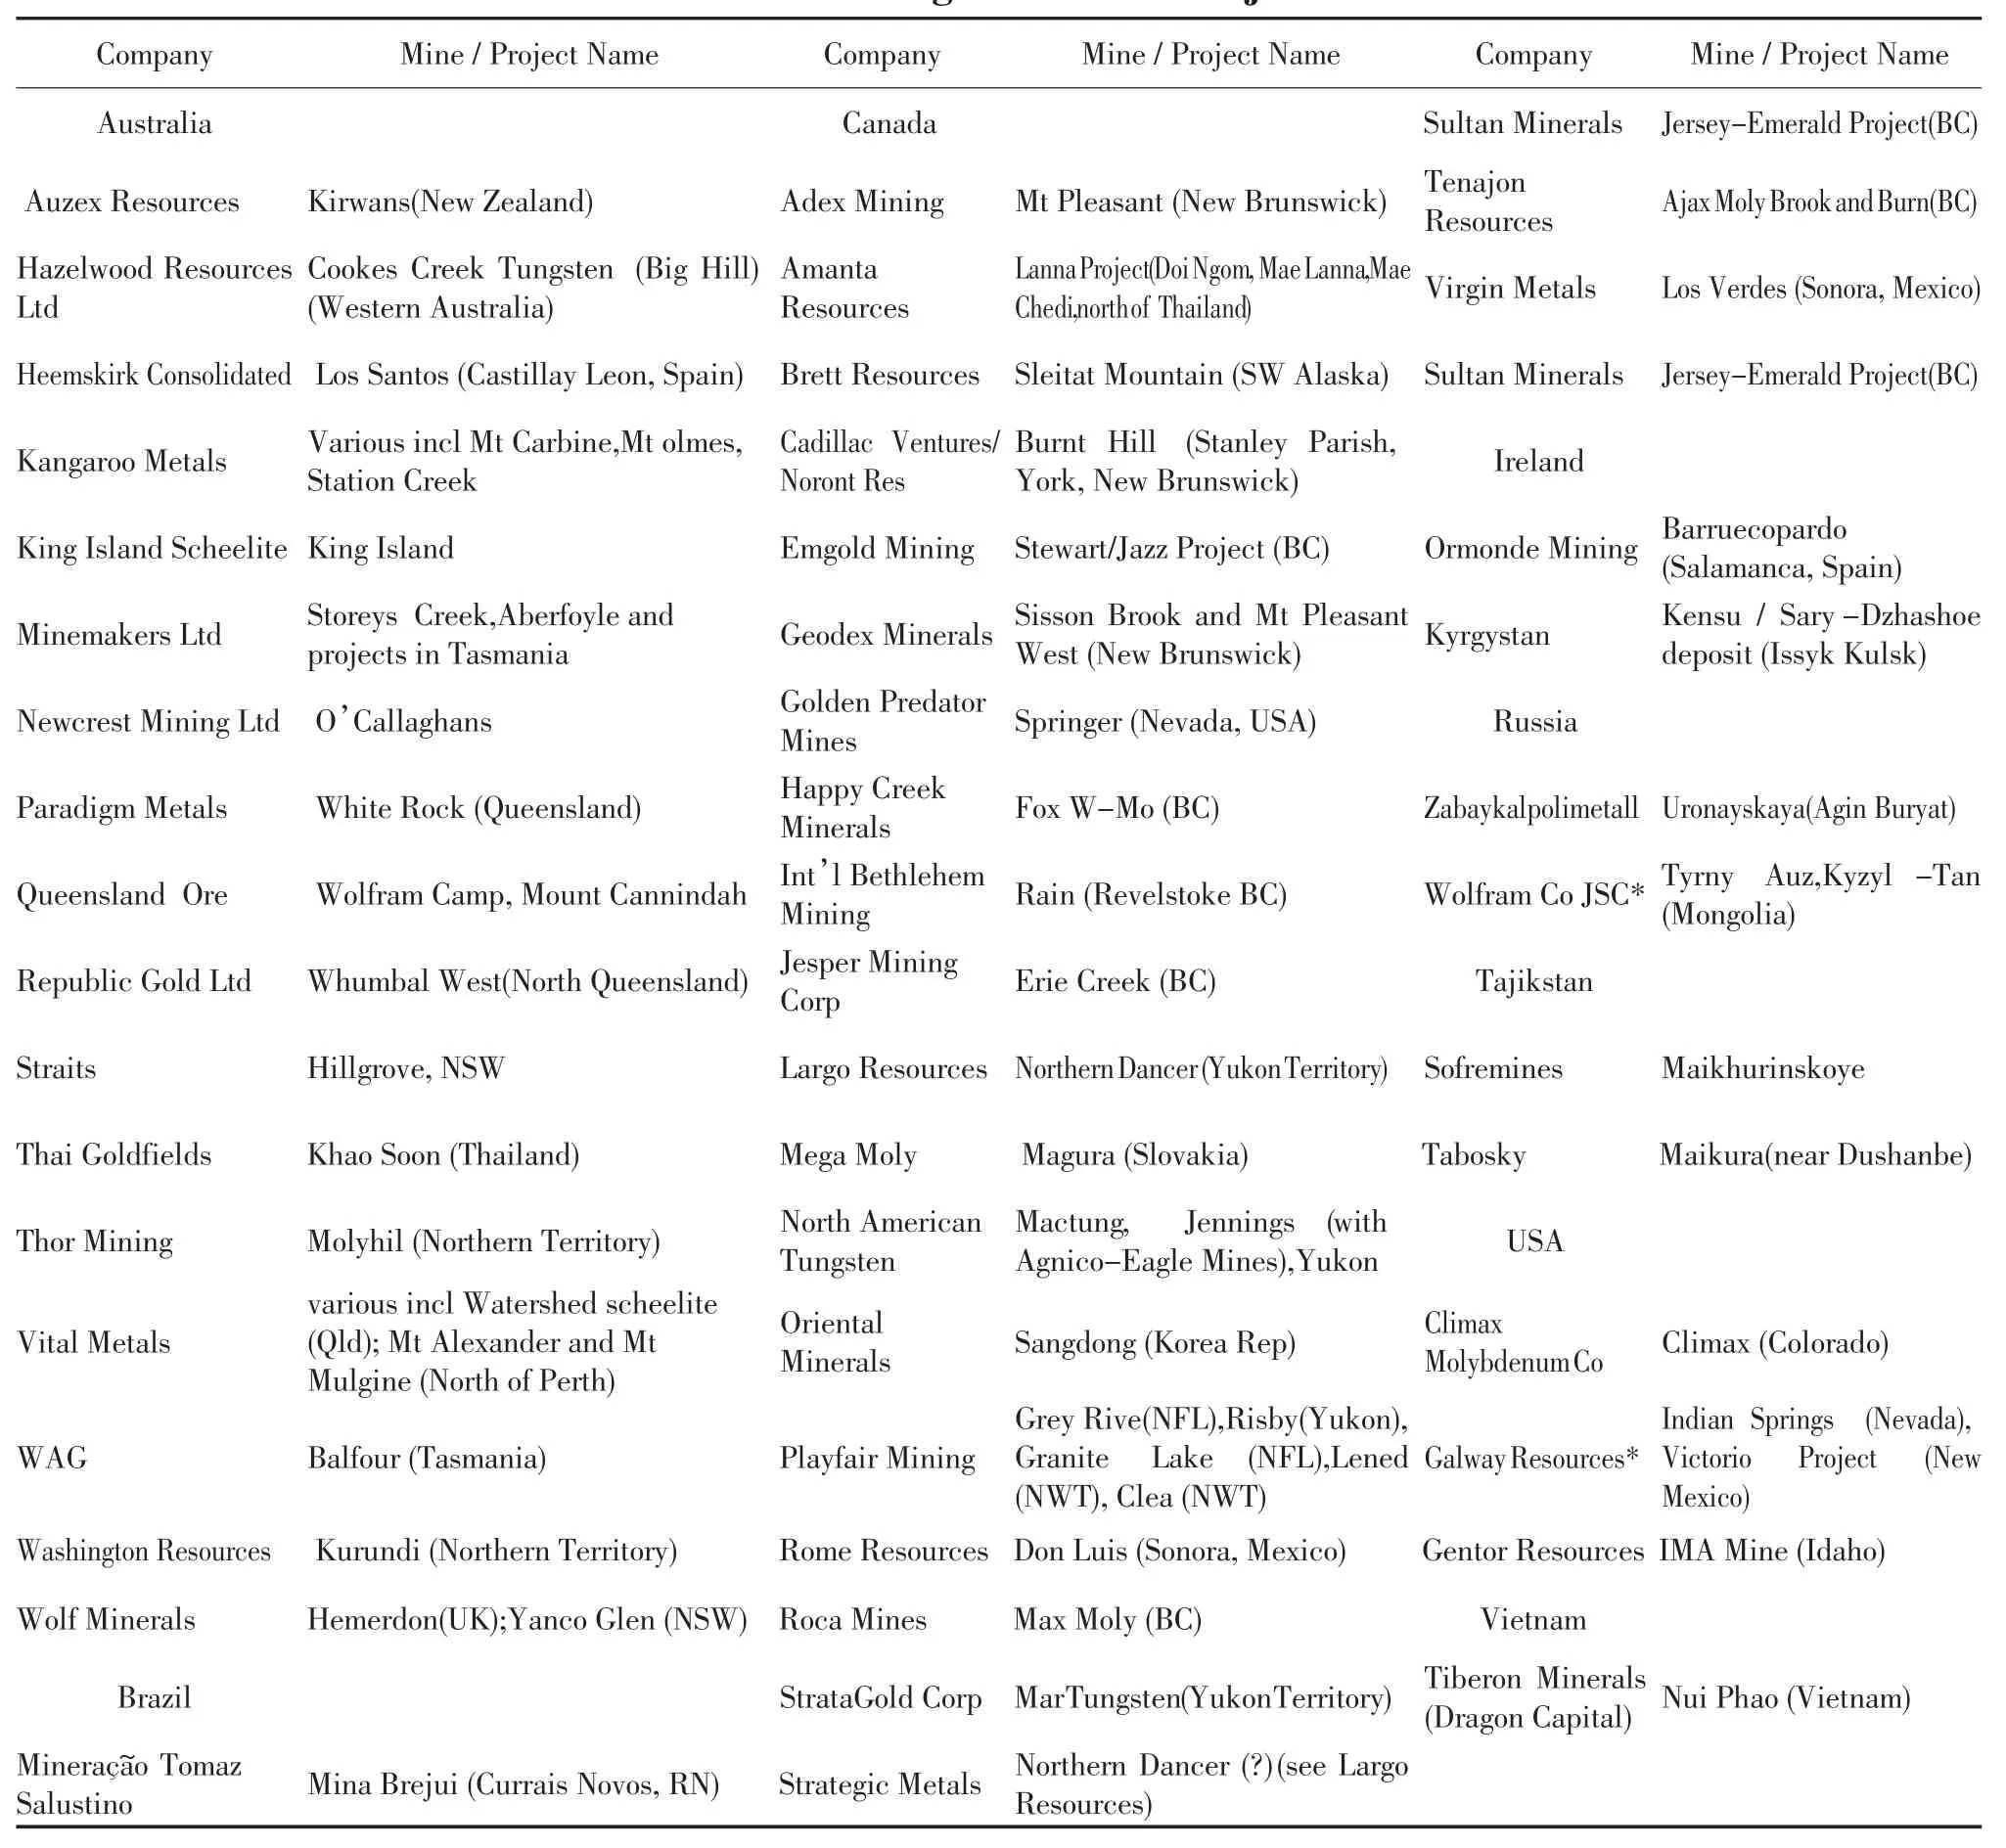
Table 8 Tungsten Mines/Projects
So I always look forward to each annual meeting,in anticipation of one surprise or another,and always thankful that I do not have to make forecasts which would undoubtedly be wrong.Thank you for your attention and I look forward to seeing many of you again at our AGM in Vienna next September.