Proposed Models for Subcritical Water Extraction of Essential Oils
2009-05-14KhajenooriHaghighiAslandHormozi
M. Khajenoori, A. Haghighi Asl and F. Hormozi
Proposed Models for Subcritical Water Extraction of Essential Oils
M. Khajenoori, A. Haghighi Asl*and F. Hormozi
Chemical Engineering Department, Faculty of Engineering, Semnan University, P. O. Box: 35195-363, Semnan, Iran
Mechanisms that control the extraction rate of essential oil fromBoiss. (.) with subcritical water (SW) were studied. The extraction curves at different solvent flow rates were used to determine whether the extractions were limited primarily by the near equilibrium partitioning of the analyte between the matrix and solvent (.. partitioning thermodynamics) or by the rates of analyte desorption from the matrix (.. kinetics). Four simple models have been applied to describe the extraction profiles obtained with SW: (1) a model based solely on the thermodynamic distribution coefficientD, which assumes that analyte desorption from the matrix is rapid compared to elution; (2) one-site kinetic model, which assumes that the extraction rate is limited by the analyte desorption rate from the matrix, and is not limited by the thermodynamic (D) partitioning that occurs during elution; (3) two-site kinetic model and (4) external mass transfer resistance model. For SW extraction, the thermodynamic elution of analytes from the matrix was the prevailing mechanism as evidenced by the fact that extraction rates increased proportionally with the SW flow rate. This was also confirmed by the fact that simple removal calculations based on determinedD(for major essential oil compounds) gave good fits to experimental data for flow rates from 1 to 4 ml·min-1. The results suggested that the overall extraction mechanism was influenced by solute partitioning equilibrium with external mass transfer through liquid film.
essential oils,Boiss., subcritical water extraction, mechanism
1 Introduction
Continuous subcritical water extraction (SCWE) is a technique with water as extractant, at temperatures between 100 and 374°C and pressure high enough to maintain the liquid state [1]. Under such conditions, the intermolecular hydrogen bonds of water are broken, causing water polarity to decrease. As a result, water becomes a more effective solvent for several organic compounds. The review on extraction of medical botanicals with subcritical solvents has recently been available [2].
Boiss. (.) belongs to the familyand it is native to Iran..is used traditionally in food, especially in yoghurt flavouring. There are also commercial pharmaceuticals with formulae based on.essential oil [3]. Thymol and carvacrol are two major constituents in most essential oils, including oils used in variety of drugs. In our previous study, we have shown the feasibility of extracting thymol and carvacrol from.with subcritical water (SW) and the effects of various factors such as temperature and flow rate on extraction efficiency of this compound were determined [4]. In the present work, the extraction mechanism of thymol and carvacrol from.using SCWE is studied. The extraction curves at different water flow rates are used to determine whether the extractions are limited primarily by the near equilibrium partitioning of the analyte between the matrix and solvent (.. partitioning thermodynamics) or by the rates of analyte desorption from the matrix (.. kinetics).
Four simple models are employed to test the data. One model is attempted to predict the extraction rates based on the thermodynamic distribution coefficient (D), and the other model is tried to predict the extraction rates using a one-site exponential kinetic model (). The third model is a two-site exponential kinetic model, which attempts to predict the extraction rates using a fast and a slow kinetic rate constant, and the forth model is the thermodynamic partition with external mass transfer model [5].
The purpose of this paper is to elucidate the mechanisms controlling the extraction rates achieved with SCWE at different flow rates and same temperature 150°C, with the mean particle size 0.5 mm and pressure 2 MPa. The relative importance of the diffusion and external mass transfer step are determined during SCWE by varying the extraction flow rate.
2 Materials and methods
2.1 Materials
Leaves of.were collected (Shiraz, Iran) in May 2006. The moisture content of the leaves was 5% (dry basis). The samples were ground by grinder and screened by standard sieves immediately prior to extraction in order to avoid losses of volatiles. Two replications of the extraction and analysis procedure were performed for each run. Thymol and carvacrol (from Roth, Germany) were used as internal standard. NaCl, Na2SO4and-pentene (from Merck, Germany) were used as demulsifier, drying agent and extractant respectively, in the liquid-liquid extraction step of the aqueous extracts. HPLC grade hexane (Aldrich Chemical Co., USA) was used as diluting solvent before gas chromatography (GC). The doubly distilled, de-gassed water purified through a Milli-Q de-ionizing unit (Millipore, Bedford, MA, USA) was used as the extractant.
2.2 Subcritical water extraction system
The subcritical water extractions were carried out in a laboratory-built apparatus [Iranian Research Organization for Science and Technology (IRSOT), Tehran, Iran] shown in Fig. 1.
De-ionized water filled into a stainless steel feed tank was first purged for 2 h with N2to remove dissolved O2. A Dosapro Milton Roy (H9 series, USA) high pressure pump was used to deliver the extractant water through the system at a constant flow rate of 2 and 4 ml·min-1. The water was preheated in a stainless steel coil (3 m×3 mm i.d.). The extractor was a stainless steel cylindrical extraction chamber (103 mm×16 mm i.d.). The solid bed inside the extractor was fixed with ring screws at both ends in order to permit the circulation of the water through it. The main body of the extractor was closed with screw caps at both ends. The heating system (up to 200°C) was a fan-equipped temperature-controlled oven (Teb Azma, Tehran, Iran). A double pipe heat exchanger (240 cm2heat transfer surface area) was used to cool the extract immediately after coming out from the oven to a temperature close to 20°C. The cooling medium was water (~15°C, 3 L·min-1flow rate). A 50 cm length stainless steel tube (1 mm i.d.) was used before a pressure regulator. All parts in contact with the extractant water were stainless steel 316.
2.3 Subcritical water extractions

3 Analysis
The GC-flame ionization detection (FID) analysis were performed using a Varian Model CP-3800 gas chromatograph equipped with a 60 m CP Sil 8 CB fused silica column (0.32 mm i.d., 0.25 µm film thickness). An injection volume of 1.0 µl of the hexane extracts was injected using auto sampler. The oven temperature program was a 3°C·min-1temperature ramp from 50 to 230°C. The carrier gas was nitrogen (99.999%, Roham Gas Co., Tehran, Iran). The column head pressure was 70 kPa. The detector and injector temperatures were 250°C and 230°C, respectively.
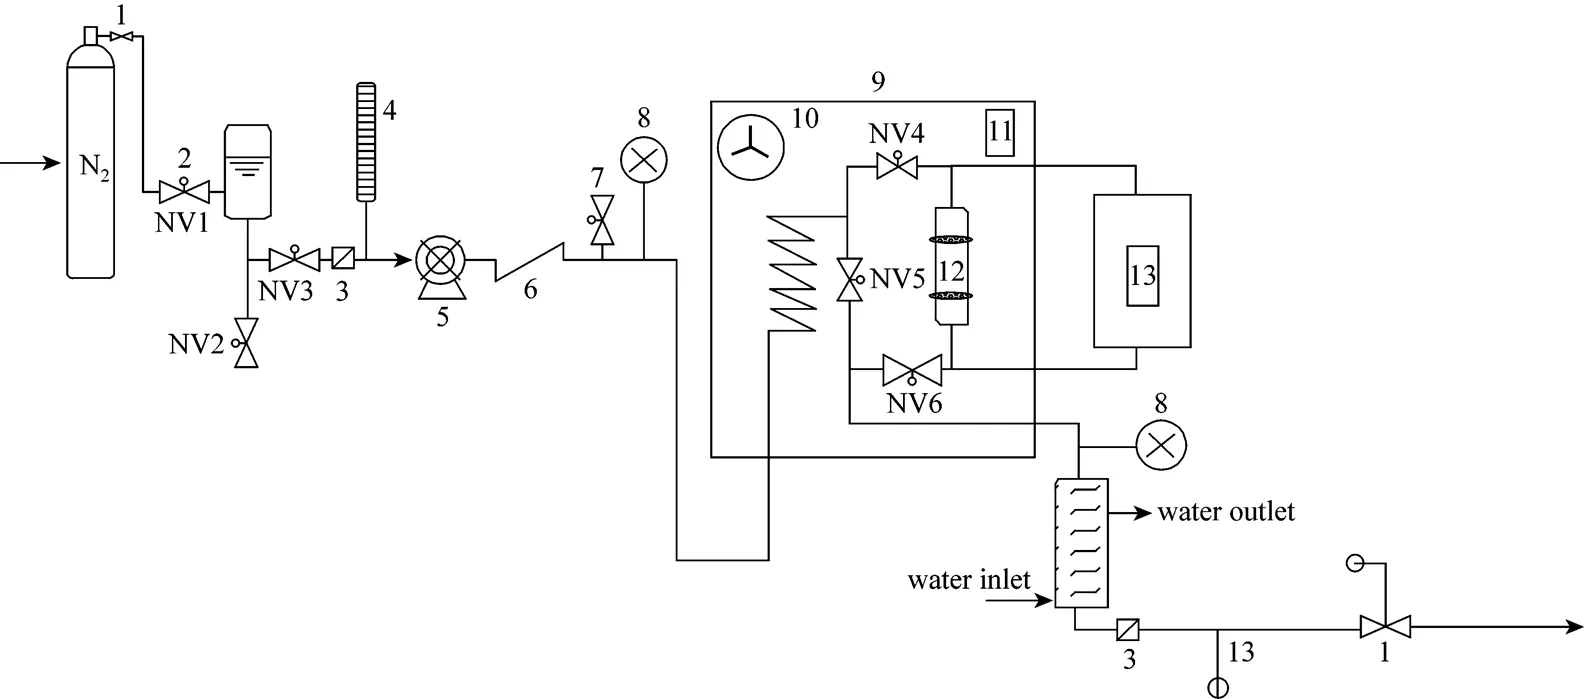
Figure 1 Schematic diagram of subcritical water extraction system
1—pressure regulator; 2—needle valve (NV); 3—micro filter; 4—burette; 5—pump; 6—check valve; 7—relief valve; 8—pressure indicator; 9—oven; 10—fan; 11—temperature indicator controller; 12—extraction cell; 13—temperature indicator
GC-mass spectrometry (MS) analysis was conducted on a Varian Saturn Model 3400. GC-MS system equipped with a DB-5 fused silica column (30 m×0.25 mm, film thickness 0.25 µm) and interfaced with a Varian ion trap detector. The GC conditions were the followings: increase of oven temperature from 40 to 200°C at 4°C·min-1, injector and transfer line temperature 210 and 220°C respectively, helium as carrier gas with a flow rate 40 ml·min-1, and splitting ratio 1︰13. The detector temperature was maintained at 240°C. The MS conditions were the followings: ionization energy 70 eV, mass range 40-400 amu, and scan mode EI. The percent of composition of the identified components was calculated from the GC peak area without considering response factors. The components were identified by comparing their retention time and mass spectrum with those of pure reference components. Mass spectra were also compared with those in the NIST (National Institute of Standards and Technology), WILEY5 and TERPENOIDES mass spectra libraries and our own created library.
4 Mass Transfer Models
Four main mass transfer steps are generally involved: (1) diffusion of solute through a stagnant liquid film around the solid plant particles; (2) diffusion of solvent into solid particles through the pores; (3) diffusion of the dissolved solute from within particles to the particle surface through the pores; (4) removal by partition from the particle surface into the bulk solvent [6]. The effect of step (1) is typically small and often neglected. Although the diffusion of the dissolved solute within the solid is usually the rate limiting step for most botanicals [7, 8], partitioning of solute between the solid matrix and solvent have been reported as the rate-limiting mechanism for subcritical water extraction of essential oil from savory [5].
The relative importance of these steps can be determined by the plots of the amount of compound extractedsolvent flow rates and solvent volume. For example, if the rate of extraction is controlled by intra-particle diffusion or kinetic desorption, the increase in flow rate of bulk fluid would have little effect on extraction rate. On the other hand, if the extraction is controlled by external film transfer diffusion, extraction rates increase with solvent flow rate. In the case where the extraction rate is controlled by thermodynamic partitioning, doubling the flow rate of bulk fluid would double the extraction rate, while the curves of extraction efficiencythe volume of water passed for all flow rates would overlap. In this study, four models will be considered and used to fit with the experimental data. These include (1) partitioning coefficient model, (2) one-site, (3) two-site desorption models and (4) thermodynamic partition with external mass transfer model.
5 Modeling of SCWE of bioactives from plant materials
5.1 Thermodynamic model

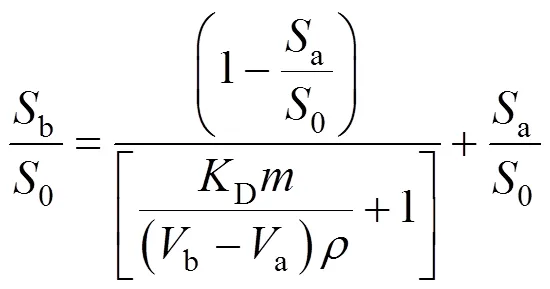
whereais the cumulative mass of the analyte extracted after certain amount of volumea(mg·g-1based on dry sample),bthe cumulative mass of the analyte extracted after certain amount of volumeb(mg·g-1, based on dry sample),0the total initial mass of analyte in the matrix (mg·g-1, based on sample),b/0anda/0are the cumulative fraction of the analyte extracted by the fluid of the volumebanda(ml), respectively,Dis the distribution coefficient, concentration in matrix/concentration in fluid,is the density of extraction fluid under given condition (mg·ml-1), andis the mass of the extracted sample (mg dry sample).
5.2 Kinetic mode
5.2.1
One-site kinetic desorption model describes the extractions that are controlled by intra-particle diffusion. This occurs when the flow of fluid is fast enough for the concentration of a particular solute to be well below its thermodynamically controlled limit. The one-site kinetic model was derived based on the mass transfer model that is analogous to the hot ball heat transfer model [10, 11]. The assumptions are that the compound is initially uniformly distributed within the matrix and that, as soon as extraction begins, the concentration of compound at the matrix surfaces is zero (corresponding to no solubility limitation). For a spherical matrix of uniform size, the solution for the ratio of the mass,r, of the compound that remains in the matrix sphere after extraction time,, to that of the initial mass of extractable compound,0, is given as:

in whichis an integer andeis the effective diffusion coefficient of the compound in the material of the sphere (m2·s-1).
The curve for the above solution tends to become linear at longer time (generally after>0.5c), and ln (r/0) is given approximately by

where0is the initial time andcis a characteristic time (min), defined as:

An alternative form of Eq. (3), or so called a one-site kinetic desorption model, can be written for the ratio of mass of analyte removed after timeto the initial mass0, as given by:
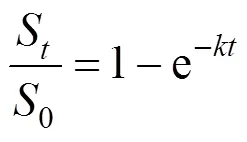
in whichSis the mass of the analyte removed by the extraction fluid after time(mg·g-1dry sample),0is the total initial mass of analyte in the matrix (mg·g-1dry sample),S/0is the fraction of the solute extracted after time, andis a first order rate constant describing the extraction (min-1).
5.2.2


The two site kinetic model does not include solvent volume, but relies solely on extraction time. Therefore, doubling the extractant flow rate should have little effect on the extraction efficiency when plotted as a function of time. On the contrary, the thermodynamic model is only dependent on the volume of extractant used. Therefore, the extraction rate can be varied by changing the flow rate. Hence, the mechanism of thermodynamic elution and diffusion kinetics can be compared simply by changing the flow rate in SCWE. If the concentration of bioactive compounds in the extract increases proportionally with the flow rate at given extraction time when the solute concentration is plottedextraction time, the extraction mechanism can be explained by the thermodynamic model. However, if an increase in flow rate has no significant effect on the extraction of the bioactive compounds, with the other extraction parameters being kept constant, the extraction mechanism can be modeled by the two site kinetic model [12, 5]. The mechanism of control and hence the model valid for SCWE may be different depending on the raw material, the target analyte and extraction conditions.
5.3 Thermodynamic partition with external mass transfer resistance model
This model describes the extraction controlled by external mass transfer, whose rate is described by resistance type model of the following form:

in whichis the fluid phase concentration (mol·m-3),sis the solid phase concentration(mol·m-3),eis the external mass transfer coefficient (m·min-1), andpis the specific surface area of particles (m2·m-3) [13]. If the concentration of the solute in the bulk fluid is assumed small and the ratio of solute concentration in the liquid to that at the surface of solid matrix is described by partitioning equilibrium,D, the solution of Eq. (7) for the solute concentration in the solid matrix,s, becomes:

Equation (8) can be rewritten as the ratio of the mass of diffusing solute leaving the sample to the initial mass of solute in the sample,S/0, as given by the following equation.

Becausepis difficult to be measured accurately,pandeare usually determined together asep, which is called overall volumetric mass transfer coefficient. The factors that influence the value ofepinclude the water flow rate through the extractor and the size and shape of plant sample.
6 Results and discussion
Figure 2 shows extraction curves generated from SCWE of thymol and carvacrol compounds of.(at a flow rate of 2 ml·min-1). While it is tempting, based on these plots, to assign the thermodynamicDmodel to the SCWE, we cannot make the interpretation based only on the results in Fig. 2. The reason is that, without knowledge of the effect of flow rate, the relative importance of the desorption kinetics and the extraction curves for SCWE could be described by a single site kinetic model, as well as the singleDmodel proposed above.
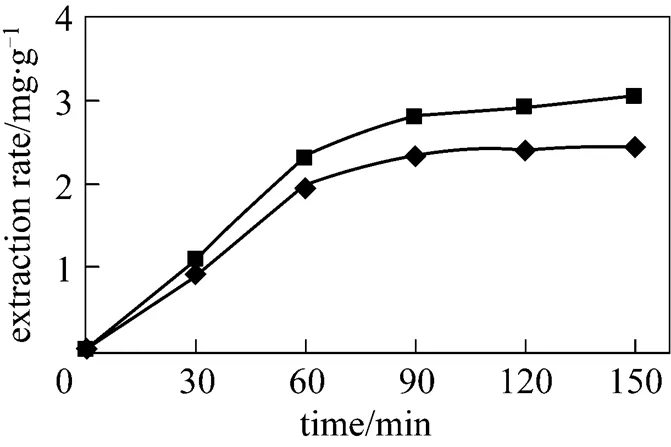
Figure 2 Comparison of SCWE profiles for major representative essential oil compounds from.
(flow rate of 2 ml·min-1, temperature 150°C, mean particle sizes 0.5 mm, pressure 2 MPa)◆ thymol;■ carvacrol
6.1 Effect of flow rate
Based on the discussion above, the importance ofDand desorption kinetics was determined by comparing the effects of changing flow rate on the extraction rate of the same samples (Fig. 3). As can be seen, the rate of essential oil extraction was faster at the higher flow rate. It is in accordance with the previous work. It means that the mass transfer of essential oil components from the surface of the solid phase into the water phase regulated most of the extraction process. Increase of flow rate resulted in increase of superficial velocity and thus, quicker mass transfer [12]. In practice, the best flow rate must be chosen with two important factors, extraction time and final extract concentration. Shorter extraction time and more concentrated final extract will be preferable.
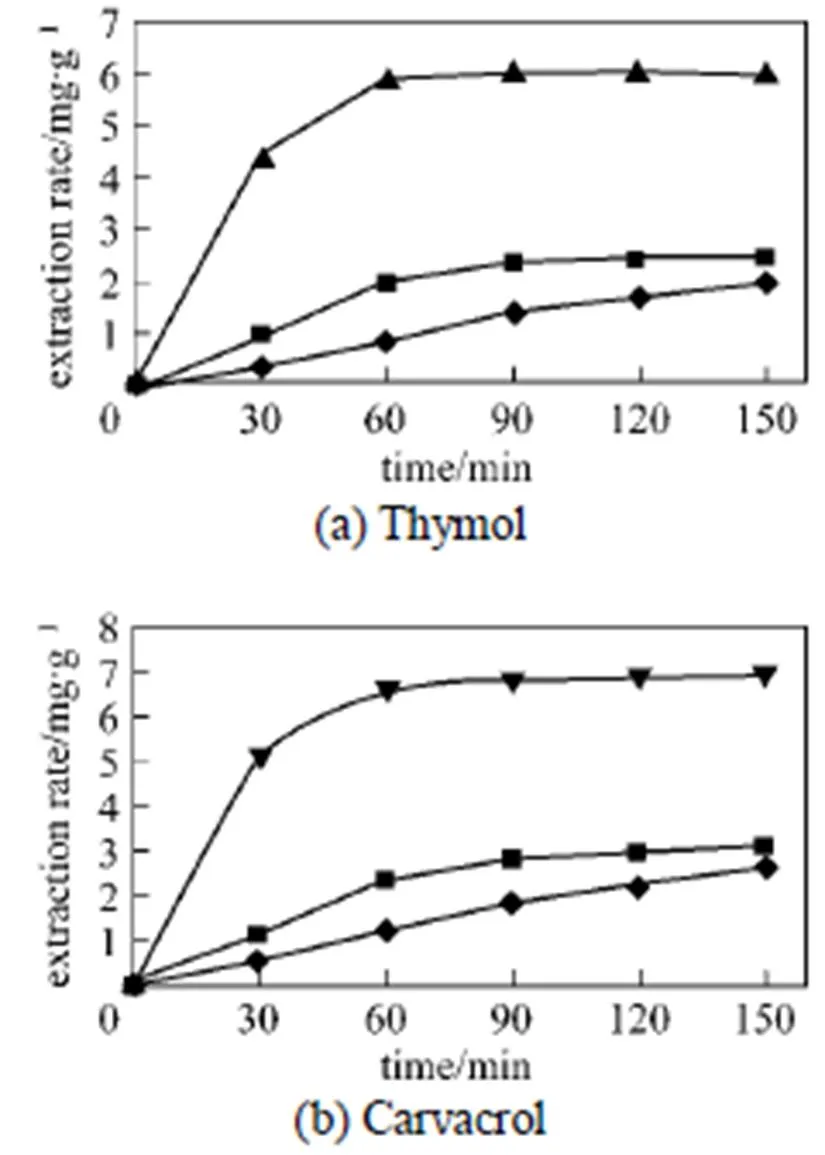
Figure 3 Effect of extraction fluid flow rate on SCWE of thymol and carvacrol from.
(temperature 150°C, mean particle sizes 0.5 mm, pressure 2 MPa)/ml·min-1:◆ 1;■ 2;▲ 3;▼ 4
6.2 Partitioning coefficient (KD) model
The model Eq. (1) and the experimental data from all volumetric flow rate plots were used to determine theDvalue by minimizing the errors between the measured data and theDmodel using Matlab curve fitting solver. The values ofDare shown in Table 1 for different flow rates. It was demonstrated that individual essential oil compounds have a range ofDvalues from~4 to~250 [5]. TheDmodel agreed reasonably with the experimental data (the average error 8%-9%). Nevertheless, if the extraction is strictly controlled by partitioning equilibrium,Dvalues for all flow rates must be equal. The deviation found was possibly due to the existence of external film transfer resistance, whose model would be discussed later.

Table 1 KD values of partitioning coefficient model for different volumetric flow rates
In addition, when theDmodel was applied to the SCWE of thymol and carvacrol from., the calculated extraction curves and the experimental curves also show good agreement in Fig. 4. AlsoDvalues of thymol and carvacrol were nearly similar, because they were structural isomer and had similar behaviour in extraction.
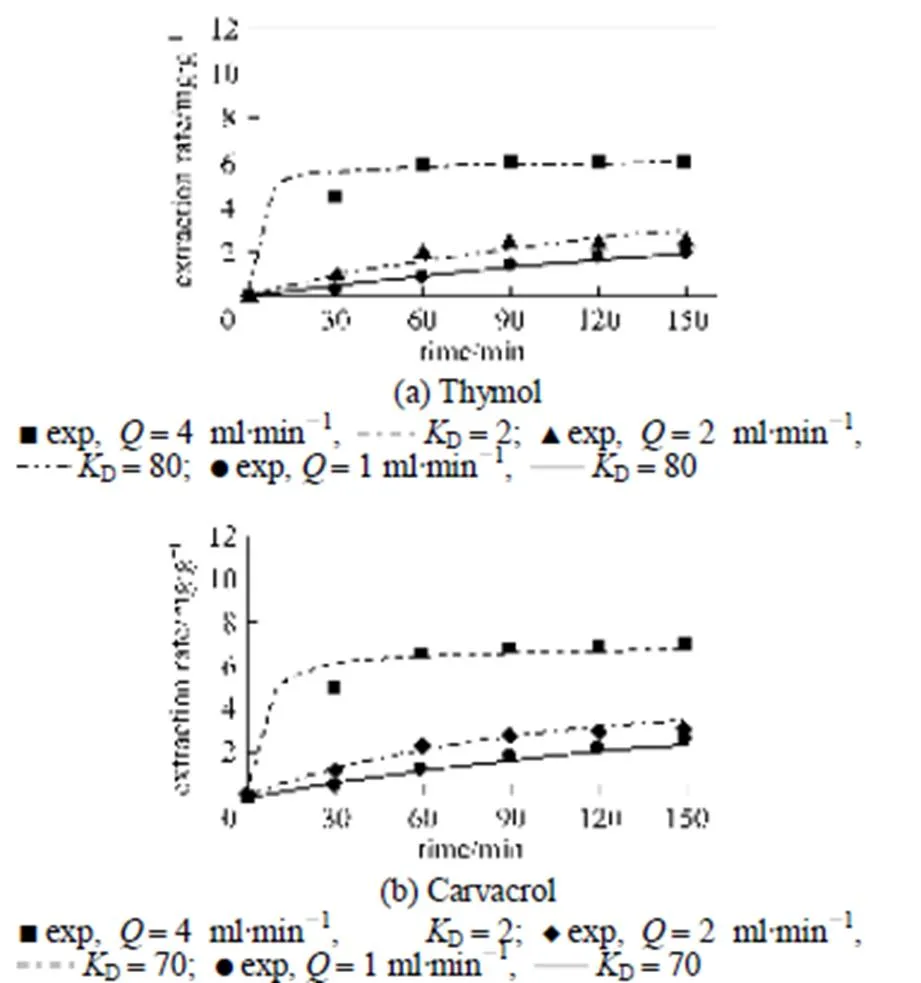
Figure 4 Experimental data andDmodel for different flow rates of SCWE of thymol and carvacrol from.(temperature 150°C, mean particle sizes 0.5 mm, pressure 2 MPa)
The effect of different values of the thermodynamic distribution coefficient (D) on extraction rates (with a constant flow rate of 2 ml·min-1) for thymol extraction is shown in Fig. 5. As expected, a higherD(stronger competition of the matrixthe fluid for the solute) yields slower extraction rates. Based on a comparison of Fig. 5 with the experimental data shown in Figs. 3 and 4, it appears that theDmodel shows a general extraction curve shape which is the typical behavior of SCWE.
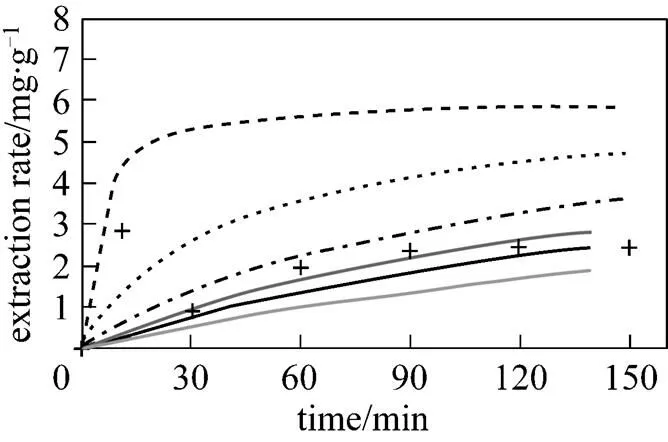
Figure 5 Theoretical curves calculated using Eq. (1) for thymol extractions from., controlled by thermodynamic partitioning

6.3 One-site kinetic desorption model
Matlab curve fitting solver was used to determine the desorption rate constant,, from the data for all flow rates. The values are show in Table 2. As mentioned, the kinetic desorption model does not include a factor describing extraction flow rate,should be the same value for all flow rates if the model is said to fit the experimental data. However, this was not the case (Table 2, the average error 3%-17%). The kinetic desorption rate increased for the volumetric flow rate of 1 to 4 ml·min-1. This indicated that the kinetic desorption model may not be suitable for describing the data at different flow rates of..
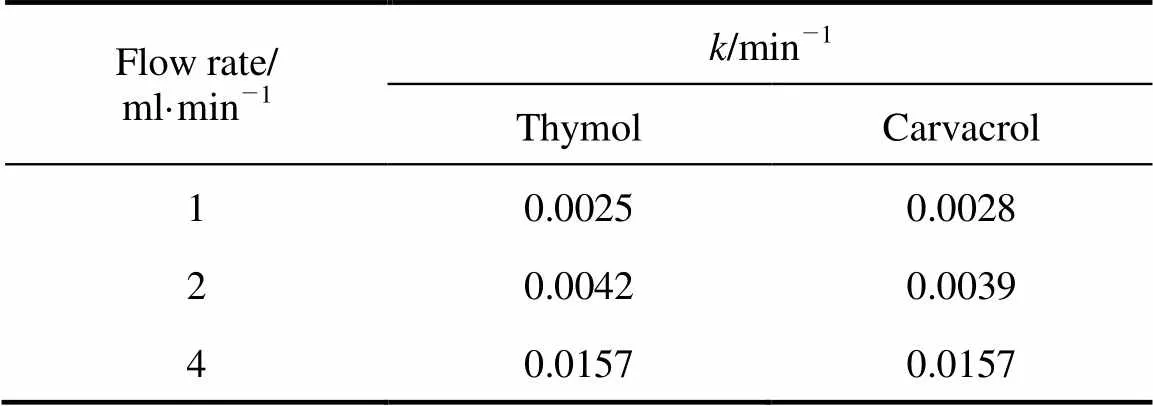
Table 2 Values of k for one-site kinetic desorption model for different volumetric flow rates
6.4 Two-site kinetic desorption model
For the two-site kinetic desorption model, the values of1and2were determined by fitting the experimental data with the two-site kinetic desorption models by minimizing the errors between the data and the model results. In the two-site model, the extraction rate should not be dependent on the flow rate. The1and2values shown in Tables 3 and 4 demonstrated that the extraction rates were not completely independent of flow rate (the average error 11%-20%).

Table 3 k1 and k2 values of two-site kinetic desorption model for thymol at different flow rates

Table 4 k1 and k2 values of two-site kinetic desorption model for carvacrol at different flow rates
6.5 Thermodynamic partition with external mass transfer model
The values for the model parameters,Dandepin Eq. (9) determined by Matlab curve fitting solver from the experimental data obtained at 150°C are summarized in Tables 5 and 6 for different mass flow rates (m, mg·min-1). Linear regression of the plot between ln(ep) and lngives the following correlation forepand:


Table 5 Parameters KD and keap for external mass transfer model of SCWE of thymol

Table 6 Parameters KD and keap for external mass transfer model of SCWE of carvacrol
7 Comparison of extraction models
To quantitatively compare the extraction models, the mean percentage errors between the experimental data and the models were considered. Based on the result in fitting from experimental data, theDmodel was generally suitable for the description of extraction over all the volumetric flow rates tested. On the other hand, one-site and two-site kinetic desorption models describe the extraction data reasonably at lower volumetric flow rates. Of all the models considered, however, the thermodynamic partition with external mass transfer model could best describe the experimental data.
8 Conclusions
In summary, subcritical water provides a promising alternative for extraction of the thymol and carvacrol from.. Extraction mechanisms were investigated at 150°C, 1-4 ml·min-1flow rate and 0.50 mm mean particle size for 150 min extraction time. Overall by considering mean average errors of models, a mathematical model base on the combination of partition coefficient (D) and external mass transfer gave a good description of subcritical water extraction of., while the kinetic model reasonably described the extraction behavior at lower flow rates.
ACKNOWLEDGEMENTS
.
1 Ayala, R.S., Luquede Castro, M.D., “Continuous subcritical water extraction as a useful tool for isolation of edible essential oils”,., 75, 109-113 (2001).
2 Ong, E.S., Han Cheong, J.S., Goh, D., “Pressurized hot water extraction of bioactive or marker compounds in botanicals and medicinal plant materials”,., 1112, 92-102 (2006).
3 Aynehchi, Y., Pharmcognosy and Medicinal Plants of Iran, Tehran University Press, 228-234, Tehran, Iran (1991).
4 Khajenoori, M., Haghighi Asl, A., Hormozi, F., Eikani, M.H., Noori Bidgoli, H., “Subcritical water extraction of essential oils fromBoiss”,.-4530. 2008. 00245. X (2008).
5 Kubatova, A., Jansen, B., Vaudoisot, J.F., Hawthorne, S.B., “Thermodynamic and kinetic models for the extraction of essential oil from savory and polycyclic aromatic hydrocarbons from soil with hot (subcritical) water and supercritical CO2”,.., 975 (1), 175-188 (2002).
6 Shotipruk, A., Kiatsongserm, J., Pavassnt, P., Goto, M., Sasaki, M., “Pressurized hot water extraction of anthraquinones from the roots of”,.., 20, 1872-1875 (2004).
7 Schwartzberg, H.G., Chao, R.Y., “Solute diffusivities in leaching process”,., 36, 73-86 (1982).
8 Gertenbach, D.D., “Solid-liquid extraction technologies for manufacturing nutraceuticals”, Shi, J., Mazza, G., Maguer, M.L., eds., Functional Foods: Biochemical and Processing Aspects (Volume 2), CRC Press, Boca Raton, Flordia (2002).
9 Windal, I., Miller, D.J., de Pauw, E., Hawthorne, S.B., “Supercritical fluid extraction and accelerated solvent extraction of dioxins from high- and low-carbon fly ash”,.. 72, 3916-3921 (2000).
10 Crank, J., The Mathematics of Diffusion, Clarendon, Oxford (1975).
11 Carlslaw, H.S., Jaeger, J.C., Conduction of Heat in Solids, Clarendon, Oxford (1959).
12 Cacace, J.E., Mazza, G., “Pressurized low polarity water extraction of lignans from whole flaxseed”,..., 77, 1087-1095 (2006).
13 Anekpankul, Th., Goto, M., Sasaki, M., Pavasant, P., Shotipruk, A., “Extraction of anti-cancer damnacathal from roots ofby subcritical water”,..., 55, 343-349 (2007).
2008-10-27,
2009-03-02.
* To whom correspondence should be addressed. E-mail: ahaghighi@semnan.ac.ir
杂志排行
Chinese Journal of Chemical Engineering的其它文章
- On-line Monitoring for Phosphorus Removal Process and Bacterial Community in Sequencing Batch Reactor*
- Mechanism Study of Rice Straw Pyrolysis by Fourier Transform Infrared Technique*
- Simultaneously Designing and Targeting for Networks with Multiple Resources of Different Qualities*
- Modeling and Control of Nonlinear Discrete-time Systems Based on Compound Neural Networks*
- Effect of Doping Cerium in the Support of Catalyst Pd-Co/Cu-Co-Mn Mixed Oxides on the Oxidative Carbonylation of Phenol
- Biodegradation of Aniline by a Newly Isolated Delftia sp. XYJ6*
