lmproved simulation of winter wheat yield in North China Plain by using PRYM-Wheat integrated dry matter distribution coefficient
2024-05-13XuanLiShaowenWangYifanChenDanwenZhangShanshanYangJingwenWangJiahuaZhangYunBaiShaZhang
Xuan Li ,Shaowen Wang ,Yifan Chen ,Danwen Zhang ,Shanshan Yang ,Jingwen Wang ,Jiahua Zhang,Yun Bai,Sha Zhang#
1 Research Center for Remote Sensing and Digital Earth,College of Computer Science and Technology,Qingdao University,Qingdao 266071,China
2 Center for Geospatial Information,Shenzhen Institute of Advanced Technology,Chinese Academy of Sciences,Shenzhen 518055,China
3 School of Geographical Sciences,Hebei Normal University,Shijiazhuang 050024,China
Abstract The accurate simulation of regional-scale winter wheat yield is important for national food security and the balance of grain supply and demand in China.Presently,most remote sensing process models use the “biomass×harvest index (HI)” method to simulate regional-scale winter wheat yield.However,spatiotemporal differences in HI contribute to inaccuracies in yield simulation at the regional scale.Time-series dry matter partition coefficients (Fr) can dynamically reflect the dry matter partition of winter wheat.In this study,Fr equations were fitted for each organ of winter wheat using site-scale data.These equations were then coupled into a process-based and remote sensingdriven crop yield model for wheat (PRYM-Wheat) to improve the regional simulation of winter wheat yield over the North China Plain (NCP).The improved PRYM-Wheat model integrated with the fitted Fr equations (PRYM-Wheat-Fr) was validated using data obtained from provincial yearbooks.A 3-year (2000-2002) averaged validation showed that PRYM-Wheat-Fr had a higher coefficient of determination (R²=0.55) and lower root mean square error (RMSE=0.94 t ha-1) than PRYM-Wheat with a stable HI (abbreviated as PRYM-Wheat-HI),which had R² and RMSE values of 0.30 and 1.62 t ha-1,respectively.The PRYM-Wheat-Fr model also performed better than PRYM-Wheat-HI for simulating yield in verification years (2013-2015).In conclusion,the PRYM-Wheat-Fr model exhibited a better accuracy than the original PRYM-Wheat model,making it a useful tool for the simulation of regional winter wheat yield.
Keywords: dry matter partition,remote sensing model,winter wheat yield,North China Plain
1.lntroduction
Winter wheat is widely grown in China,with production accounting for approximately 1/6 of the winter wheat production over the world (Wuet al.2022).The North China Plain (NCP) is one of the main planting areas of winter wheat accounting for approximately 75% of China’s winter wheat planting area (Renet al.2021).Global warming and the increasing population have brought new challenges in food security and food requirements (Wheeler and von Braun 2013).The winter wheat planting area in NCP is decreasing,and soil fertility is gradually declining due to a variety of factors (Suet al.2020).It would be beneficial to adjust agricultural policies to timely and accurately simulate crop yield,and then improve crop productivity.
Many crop growth models,including DSSAT (Joneset al.2003),GOSSYM (McKinionet al.1989),WOFOST (Diepenet al.1989),and APSIM (Keatinget al.2003),have been developed for simulating crop yield,and they have been widely used worldwide (Liet al.2013).These crop growth models require high-precision meteorological data and field management data as driving parameters (Amarasinghaet al.2015).However,it is difficult to obtain sufficient site-level meteorological data and detailed field management data on a regional scale.Remote sensing (RS) data can reflect the spatiotemporal state of crops through retrieved information (e.g.,normalized difference vegetation index (NDVI),leaf area index (LAI),and RS phenology information).Some researchers have established RS models to simulate crop yield (Liet al.2012).RSbased yield estimation models include empirical models,light use efficiency (LUE) models,and process-based RS yield estimation models (i.e.,RS process models).Empirical models are statistical models,which have poor generalization ability at the regional scale (Chaoet al.2019).An empirical method usually obtains one of the key parameters in LUE models (i.e.,maximum LUE),but it introduces larger uncertainties (Xiaoet al.2004).RS process models can simulate the photosynthesis,respiration,and transpiration of crops,reflecting the growth process of crops.As a result,they have been widely used in crop yield simulation on a regional scale (Juet al.2010).However,the performance of RS process models is not yet very satisfactory for simulating crop yield on a regional scale.One reason is that dry matter partitioned to a grain is not well characterized on spatiotemporal scales.Moreover,current RS process models usually use a “biomass×harvest index (HI)” method,in which a constant HI is generally utilized to depict the total dry matter partitioned to a grain over the whole growing season to simulate crop yield (Juet al.2010;Prasadet al.2021;Campoyet al.2023).In fact,meteorological factors during the crop growing season significantly affect the dry matter partitioned to a grain (Fanget al.2017).The spatiotemporal variances of meteorological factors lead to different HI values (i.e.,the fractions of dry matter partitioned to a grain at the end of the growing season) in different years and regions even for the same crop (Caoet al.2021).Therefore,a constant HI is one of the main parameters for the yield simulation deviation.
Time-series dry matter partition coefficients (Fr) can dynamically reflect the dry matter partition to each winter wheat organ during the crop growth period.Some researchers have estimated the Fr curve of different crops.For example,Liet al.(2016) established the relationship between maize Fr and maize development stage (DVS) using biomass data observed in the field.They also successfully simulated the partitioning of dry matter to each organ.Bilaliet al.(2019) established a normalized model using daily normalization of winter wheat growth length and biomass information observed in the field to characterize the Fr of winter wheat of each organ over Xinjiang region.In addition,some studies have coupled Fr to the RS process model to improve the simulation accuracy of crop yield.For example,Huanget al.(2018) developed a BESS (Breathing Earth System Simulator) model for rice coupled with gross primary productivity (GPP)-Fr and successfully simulated rice yield at a site scale.Zhanget al.(2021) developed a process-based and remote sensing driven crop yield model for maize (PRYM-Maize) by coupling DVS-Fr with an improved daily BEPS (Boreal Ecosystem Productivity Simulator) model and successfully simulated spring maize yield over the Northeast China Plain.Validation results revealed that spring maize yield estimated using the DVS-Fr method obtained higher accuracy compared with that using the “biomass×HI” method (Zhanget al.2021).Based on the above analyses,coupling of Fr to the RS process models may be a potential method to improve crop yield prediction accuracy.However,there is still no research regarding integration of time-series winter wheat Fr with an RS process model to improve the simulation of winter wheat yield on a regional scale.
The main objectives of this study were: (1) to obtain site-scale dry matter partition data of winter wheat from publications and establish DVS-Fr equations (i.e.,the relationship between DVS and winter wheat dry matter partition data) for each organ;(2) to integrate the estimated Fr with a process-based and RS-driven crop yield model for wheat (PRYM-Wheat) to improve the winter wheat yield simulation;and (3) to drive the original and improved PRYM-Wheat models (denoted as PRYM-Wheat-HI and PRYM-Wheat-Fr,respectively,in this study) to estimate winter wheat yield and to verify the accuracy of the estimated yield with county-scale statistical yield data from provincial yearbooks.This study aims to improve the accuracy of regional winter wheat yield simulation using an improved RS process model.
2.Data and methods
2.1.Study area
Hebei and Henan (31.23°N-42.37°N,10.21°E-119.53°E,as shown in Fig.1) in the NCP are the two main winter wheat-producing provinces in China.The National Bureau of Statistics of China (http://www.stats.gov.cn/) reported that the winter wheat production of Henan and Hebei provinces was 6,544.27 million tons and 3,825.09 million tons,respectively,and accounted for 76% of the national total wheat production in 2021.This area is flat and vast and has a temperate monsoon climate.The average annual temperature from different cities in this area is 8-15°C,and precipitation occurs mainly in the July-August period.Annual precipitation is 500-600 mm.
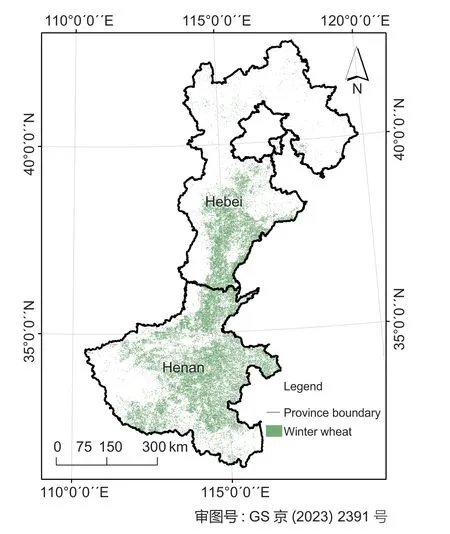
Fig.1 Spatial distribution of winter wheat in the study area in 2015 and the dataset of winter wheat distribution is referring to Zhang et al. (2018b) and verified by county-level statistical data,the coefficient of determination (R²) is 0.84,and the root mean square error (RMSE) is 14.90×10³ ha-1.
2.2.Methodology
Overview of PRYM-WheatThe PRYM-Wheat model is primarily composed of three modules (Fig.2),which were developed from an improved daily BEPS (BEPSd) (Liuet al.1997;Chenet al.1999) model (I-BEPSd) (Zhanget al.2018a).The three modules are the “water balance module,” “photosynthesis module,” and “yield simulation module” (Zhanget al.2023).The first two modules in PRYM-Wheat are based on the water balance module and photosynthetic estimation module in the I-BEPSd.It is noted that the “water balance module” in I-BEPSd uses a multi-layer to replace the single-layer soil water balance module in the original BEPSd model (Baiet al.2017;Zhanget al.2018a).The “photosynthesis module” in I-BEPSd introduces a chlorophyll constraint factor to optimize the calculation of maximum carboxylation rate (Vm) (Zhanget al.2018a).The “yield simulation module” in the original PRYM-Wheat model uses HI to convert the primary productivity to winter wheat yield (Zhanget al.2023).In this study,winter wheat Fr was used to replace HI to improve PRYM-Wheat,which will be introduced in detail in Section 2.2.

Fig.2 Configuration of the improved PRYM-Wheat model which includes three modules.NDVI,normalized difference vegetation index;LAI,leaf area index;LULC,land use and land cover;ET,evapotranspiration;GPP,gross primary productivity;NPP,net primary productivity.
Yield simulation in PRYM-Wheat-HlThe original “yield simulation module” uses HI to convert the total biomass of winter wheat during the growing season to yield:
whereyielddenotes the estimated winter wheat yield,in kg ha-1;HIdenotes the harvest index,which is set as 0.48 (Renet al.2006);BIOMASStotaldenotes the biomass accumulated by the whole plant of winter wheat from the returning green period to the maturity period,in g C m-2;GPPdenotes the gross primary productivity,in g C m-2;andRdenotes the respiration of winter wheat,in g C m-2.The dry matter consumed by respiration is calculated as follows:
Yield simulation by PRYM-Wheat-FrFr dynamically reflects the dry matter partitioning throughout the winter wheat growth period so that it can describe the yield accumulation process of winter wheat.Fr has more ecological meaning than HI.The yield calculation formula of PRYM-Wheat-Fr developed in this study is as follows:
whereFrgraindenotes the dry matter partition coefficient of grains;Rtgraindenotes the dry matter consumed by grains through respiration,in g C m-2;andFrgrainis a function of the developing stage (DVS) of winter wheat,calculated as follows:
whereDMWorg,idenotes the dry matter weight of organ “org (including leaf,steam,and grain)” in a period of time “i”,in kg ha-1;TDWMidenotes the total dry matter weight of aboveground parts in a period of time “i”,in kg ha-1;andidenotes the observation period,which is a variable related to DVS.This study uses the effective accumulated temperature,which is commonly used in crop growth models,to simulate DVS of winter wheat (Xie and Kiniry 2002).The calculation formula is as follows:
whereDVSdenotes the growth period of winter wheat;denotes the effective accumulated temperature of winter wheat till day “t0”,in °C d;flower_daydenotes the flowering date of winter wheat;Tsumjdenotes the total effective accumulated temperature of thej thgrowth period,in °C d;denotes the effective accumulated temperature in the day “t”,in °C d;T tdenotes the temperature on day “t” of the winter wheat growth period,°C;Tb,Topt,andTmaxdenote the base,optimum,and maximum temperatures during winter wheat growth respectively.Tb,Topt,andTmaxof 0,20,and 30°C,respectively,are used for winter wheat (Mahadevanet al.2008).
2.3.Data
Remote sensing data1) MODIS NDVI/EVI/LAI.NDVI and enhanced vegetation index (EVI) data used in PRYM-Wheat-Fr are from MODIS data (MOD13A2 (16 days,1 km) and MYD13A2 (16 days,1 km)),which were downloaded at https://search.earthdata.nasa.gov/.As MODIS LAI product was reported to be seriously underestimated for crops (Yanget al.2014),this study did not use winter wheat LAI from MODIS LAI.The following empirical formula (Zhang 2018) was used to calculate winter wheat LAI in this study.
LAI=14.22×EVI-1.21 (12)whereLAIdenotes the simulated LAI;EVIdenotes the corresponding EVI from MODIS.The time coverage of these data was from 2000 to 2002 and from 2013 to 2015.The LAI observed at Yucheng Station,Shandong Province,China (Wanget al.2007) was used to verify the accuracy of the calculated LAI,with anR² of 0.75 between observed LAI and calculated LAI.Section 4.2 presents the detail about the disparity between observed LAI,MODIS LAI and calculated LAI.
2) Land use and land cover and winter wheat distribution data.MODIS land use and land cover (LULC) data (MCD12Q1 (1 year,500 m)) is used in this study.Regarding winter wheat distribution data,this study uses the datasets of winter wheat planting areas,of which the spatial resolution is 1 km (Zhanget al.2018b).There was anR² of 0.84 between the extracted area and the area obtained from provincial yearbooks at a country scale in 2015.
3) Remote sensing phenology data.The crop phenology data mainly includes returning green and maturity dates,corresponding to the start date (start of season,SoS) and end date (end of season,EoS) of winter wheat growth period in this study.TIMESAT was used to retrieve these dates.The key parameters in TIMESAT were set as follows:
Fitting method: Double logistic
Start of season method: Seasonal amplitude
Season start/end value: 0.1/0.4
The observed data at agrometeorological sites were used to validate the estimated returning green and maturity dates.The returning green and maturity dates showR² and RMSE values of 0.73 and 6.65 days and 0.22 and 5.50 days,respectively.Zhanget al.(2023) presents the details of this part.Compared to the returning green date range (DOY is 40-90 days),the maturity date range (DOY is 160-180 days) was narrow,which is the reason for the lowerR² value for estimating maturity dates.TheR² of the observedvs.RS-based maturity date was lower than that of the observedvs.RS-based returning green date,and the RMSE was also lower for the maturity date.Therefore,the estimated returning green dates were in a reasonable range for estimating maturity dates,whoseR² was low.
Meteorological dataThe meteorological data were obtained from the ERA-Interim reanalysis dataset,which was downloaded at https://apps.ecmwf.int/datasets/data/interim-full-daily/levtype=sfc/,and from China meteorological site data,which were downloaded at http://www.nmic.cn/.The ERA-Interim data have a temporal and spatial resolution of 12 h and 0.125°,respectively.This study used 1-day temporal resolution data as input data,so the daily value of one variable was the average or sum of two 12-h values in 1 day.The meteorological data included air temperature (T,in K),precipitation (P,in mm),vapor pressure deficit (VPD,in k Pa),surface net radiation (R,in W m-2),global solar radiation (Rsg,in W m-2),and wind speed (WS,in m s-1).T,R,and WS data are downloaded directly from ERA-Interim.The P data were interpolated from Chinese meteorological sites in the study region.The VPD data were calculated using the improved Mangnus formula (eqs.13-15) with dew point temperature,which were obtained from ERA-Interim.The Rsg data from Chinese meteorological site were too sparse to be interpolated;thus,the daily Rsg data in this study was calculated from the interpolated site-observed daily temporal range (TR) and daily sun hours (Hrs),shown as eq.(16) (Chenet al.2004).
whereesddenotes vapor pressure,in k Pa;esdenotes actual water vapor pressure,in k Pa;Tdew/ denotes the dew point temperature,in °C;anda,b,c,anddare empirical coefficients,which are 0.04,0.48,0.38,and 0.81,respectively (Chenet al.2004).
Soil hydrological property dataThe soil hydrological property data in this study include field capacity,wilting point,and saturated water content,which were retrieved from the International Geosphere-Biosphere Programme Data and Information System (IGBP-DIS) dataset,downloaded at https://daac.ornl.gov/.These data have a spatial resolution of 5×5 arc-minutes,and all were measured within the depth of 0-100 cm.
Statistical dataThe county-level yield data,including the statistical yield of winter wheat and planting areas over six years (2000-2002,2013-2015) for each province were obtained from the statistical yearbooks of Henan and Hebei provinces.
Dry matter partition dataThis study extracted the dry matter partition data for stems,leaves,and grain of winter wheat at different growth stages at a site scale from two publications (Qiaoet al.2002;Maet al.2006).Qiaoet al.(2002) presented the dry matter partition data of each organ in a table.These data were used directly,and DVS was doubled to accommodate this study.The dry matter partition data of each organ is presented as a line chart in Maet al.(2006),and the data were extracted from the line chart using Origin 2018 software.This study extracted the DVS data that were consistent with that in Qiaoet al.(2002) (see Table 1).The sum of the Fr of all organs (including roots,stems,stem sheaths,leaves,and grains) of winter wheat should be equal to 1.However,the dry matter partition of the roots and stem sheaths of winter wheat were not considered in this study,so this is the reason for the sum of the Fr of the three organs (leaves,stems,and grains) being less than 1 in Table 1 during the early growth stage of winter wheat.These data were then used to fit Fr functions.Dry matter transfer occurs between different organs,therefore,when the dry matter partition reaches a balanced state,some organs will exhibit a negative Fr since dry matter in these organs transfer to other organs.At the same time,some organs will have a Fr>1 since dry matter in other organs have transferred into these organs (Maet al.2006).This is the reason for negative Fr values for stems and leaves at later growth stages.

Table 1 Dry matter partition data extracted from Ma et al. (2006)1)
3.Results
3.1.Determination of Fr
Extraction of FrDry matter partition and DVS data were integrated to fit the Fr curves of different organs using Origin 2018.The fitted Fr equations of different organs from two publications are as follows:
Quzhou site (Qiaoet al.2002):
The average value for winter wheat Fr from two sites was also calculated (Table 2).These data were then fitted using Origin 2018,and the functions between mean Fr and DVS of stem,leaf,and grain were obtained.The fit formula is shown as follows:
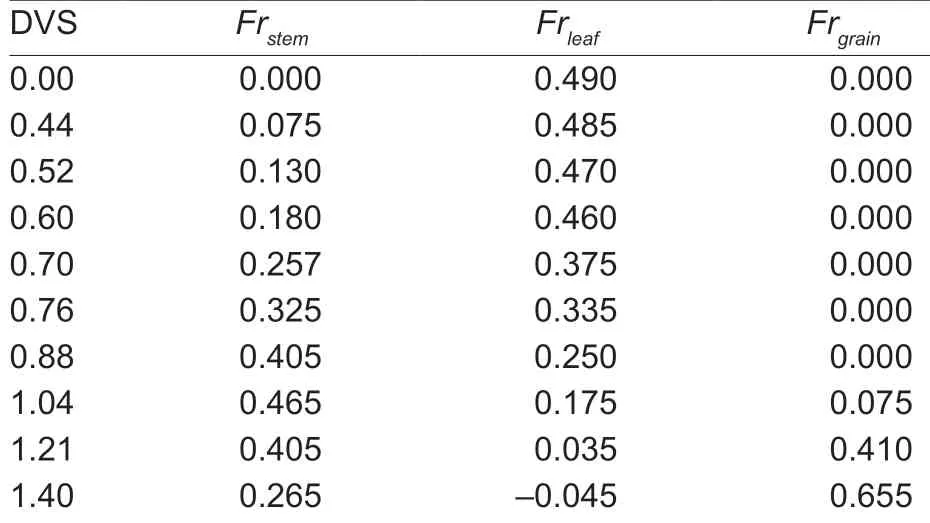
Table 2 Mean Fr of each organ (stem,leaf and grain) at different DVS1)
Frorgdenotes the dry matter partition of different organs (including leaf,steam and grain);DVSdenotes the growth period of winter wheat;a,b,c,d,andc0denote the coefficients ofFrorg(Table 3).

Table 3 The coefficient values and fitting accuracy of the mean Fr for different organs (stem,leaf,and grain) in eq.(19)1)
Optimal FrThis study uses PRYM-Wheat-Fr for which Fr are from Quzhou site (Case I),Zhengzhou site (Case II),and the mean value of the two sites (Case III) to simulate winter wheat yield.The 3-year simulated yield and the average of the 3-year simulated yield are verified by comparison with the statistical yield.TheR² and RMSE values from the relationship between the estimated and statistical yields are shown in Table 4.In 2000 and 2002,Case I had higherR² and lower RMSE values than Cases II and III.However,in 2001,Case 1 had lowerR² and higher RMSE values than Cases II and III.The average yield for 3 years was further validated,and theresult shows that the accuracy of Case I was also higher than that of the other two cases.Therefore,the Fr from Quzhou site was chosen as the optimal Fr to characterize the dynamic dry matter allocation of winter wheat over the study region.Moreover,the average of 3-year simulated yield better characterized the winter wheat yield over NCP.Therefore,this study used the average of 3-year yield to validate the performance of PRYM-Wheat-Fr.
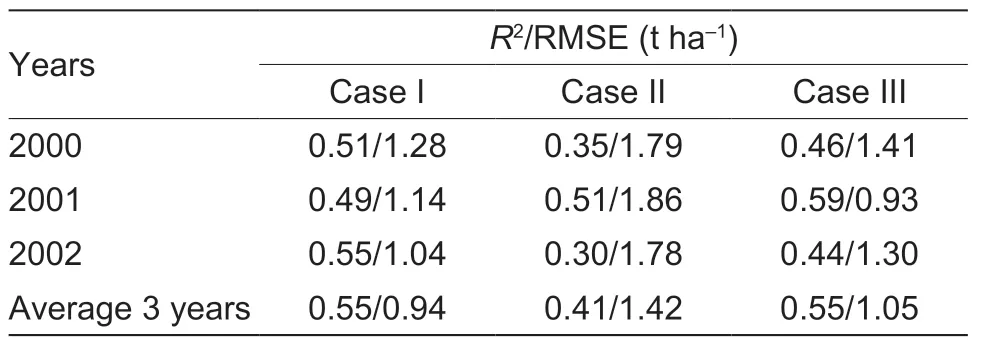
Table 4 R2 and RMSE values for relationships between statistical yield and simulated yield estimated with the PRYMWheat-Fr model with different Fr values1)
1)DVS,development stage;Frstem,FrleafandFrgraindenote dry matter partition of steam,leaf and grain,respectively.
3.2.Comparing estimated yield based on Hl and Fr
PRYM-Wheat-HI and PRYM-Wheat-Fr were used to simulate winter wheat yield.The estimated yield was validated by county-level statistical yield.TheR² (RMSE/MAE) values from the simulated yield based on PRYM-Wheat-Frvs.statistical yield were 0.55 (0.94/0.76 t ha-1),which were higher (lower/lower) than that from the simulated yield based on PRYM-Wheat-HI (R²=0.30,RMSE=1.62 t ha-1,MAE=1.42 t ha-1) (Fig.3-A and B).The accuracy of estimated yield was clearly higher using PRYM-Wheat-Fr than using PRYM-Wheat-HI.Therefore,PRYM-Wheat-Fr performed better than PRYM-Wheat-HI in simulating winter wheat yield over NCP,indicating that Fr is better than HI when simulate winter wheat in regional yield.
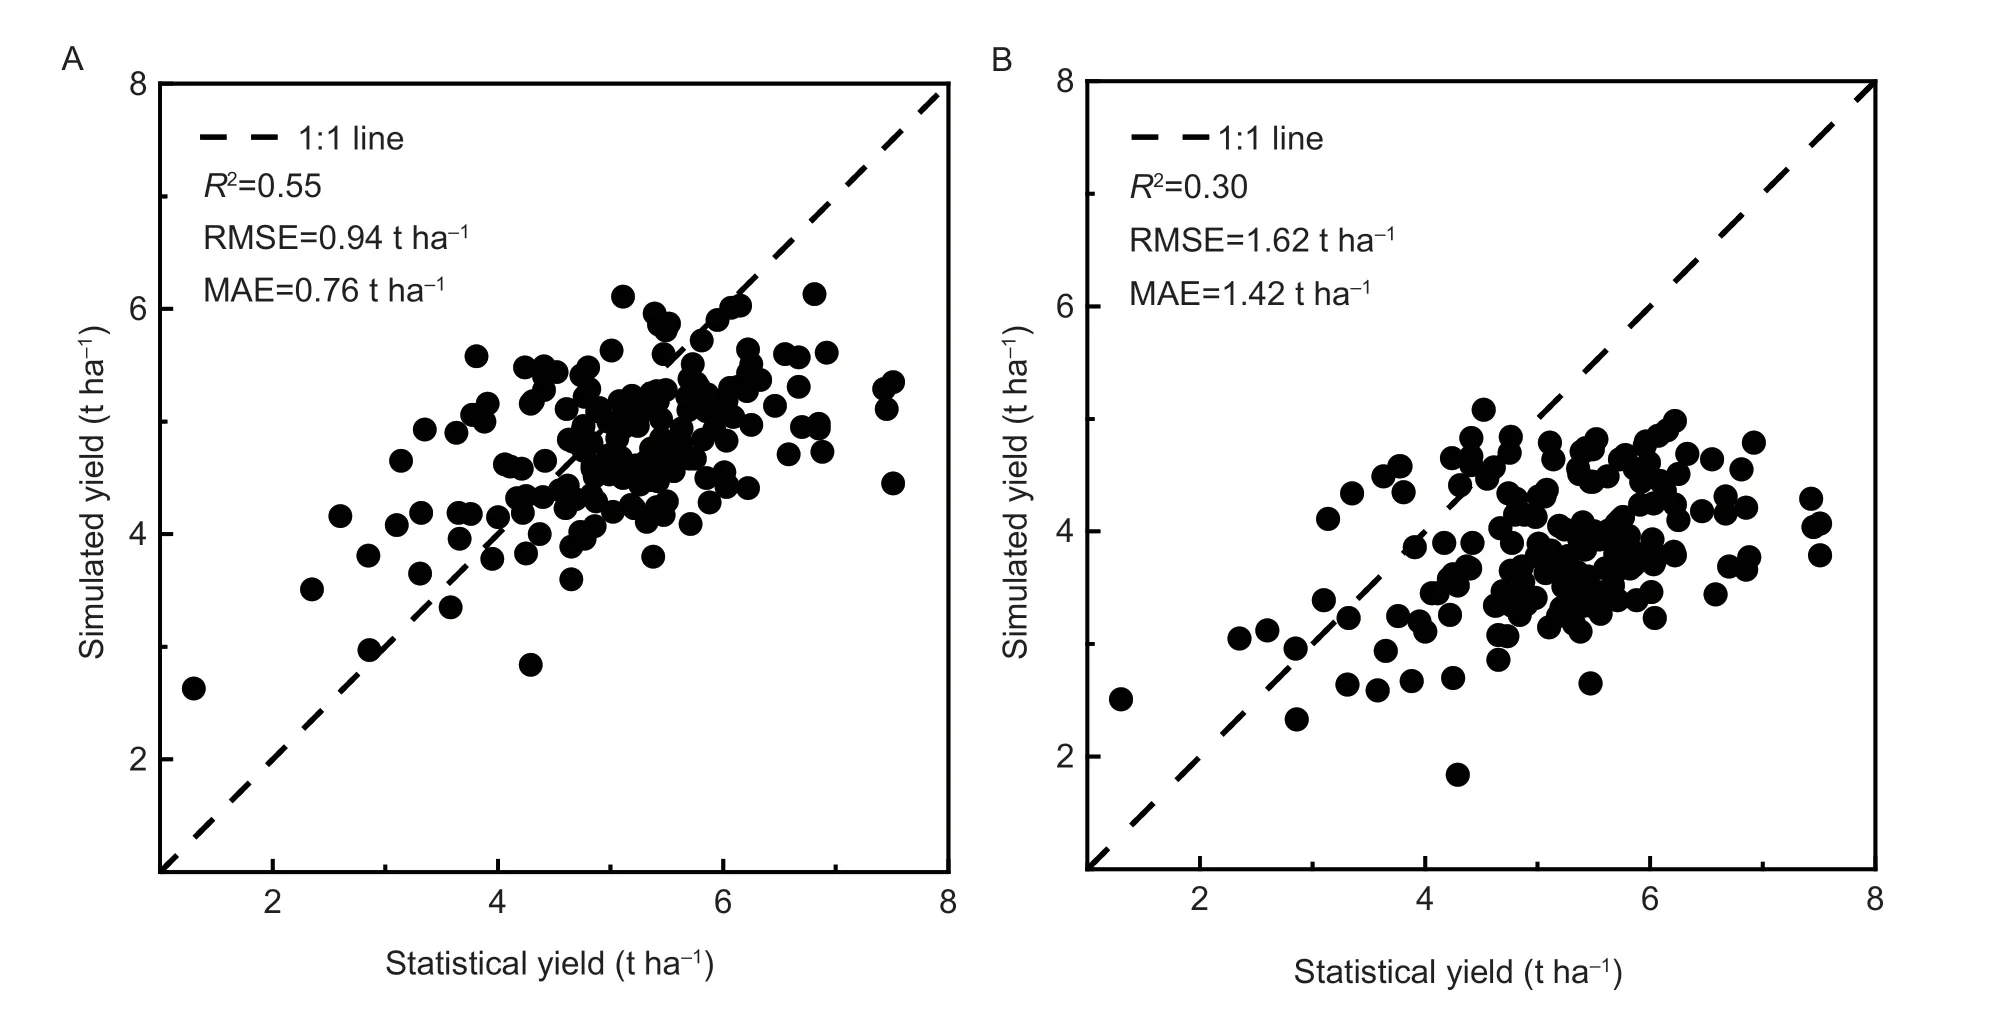
Fig.3 Relationships between yield simulated by PRYM-Wheat-Fr and statistical yield (A) and yield simulated by PRYM-Wheat-HI and statistical yield (B).R²,the coefficient of determination of simulated yield vs.statistical yield;RMSE,root mean standard error;MAE denotes mean absolute error.Statistical yield was obtained from provincial yearbooks.
3.3.Spatial distribution of yield
The yield simulated by PRYM-Wheat-Fr and the statistical yield of Henan and Hebei provinces was used to map,as shown in Fig.4-A and B.The distribution of simulated high-yield and low-yield areas was almost same as that of statistical yield.The maps showed that the winter wheat yield gradually decreased from east to west.This implies that PRYM-Wheat-Fr can adequately capture the spatial distribution of winter wheat yield.
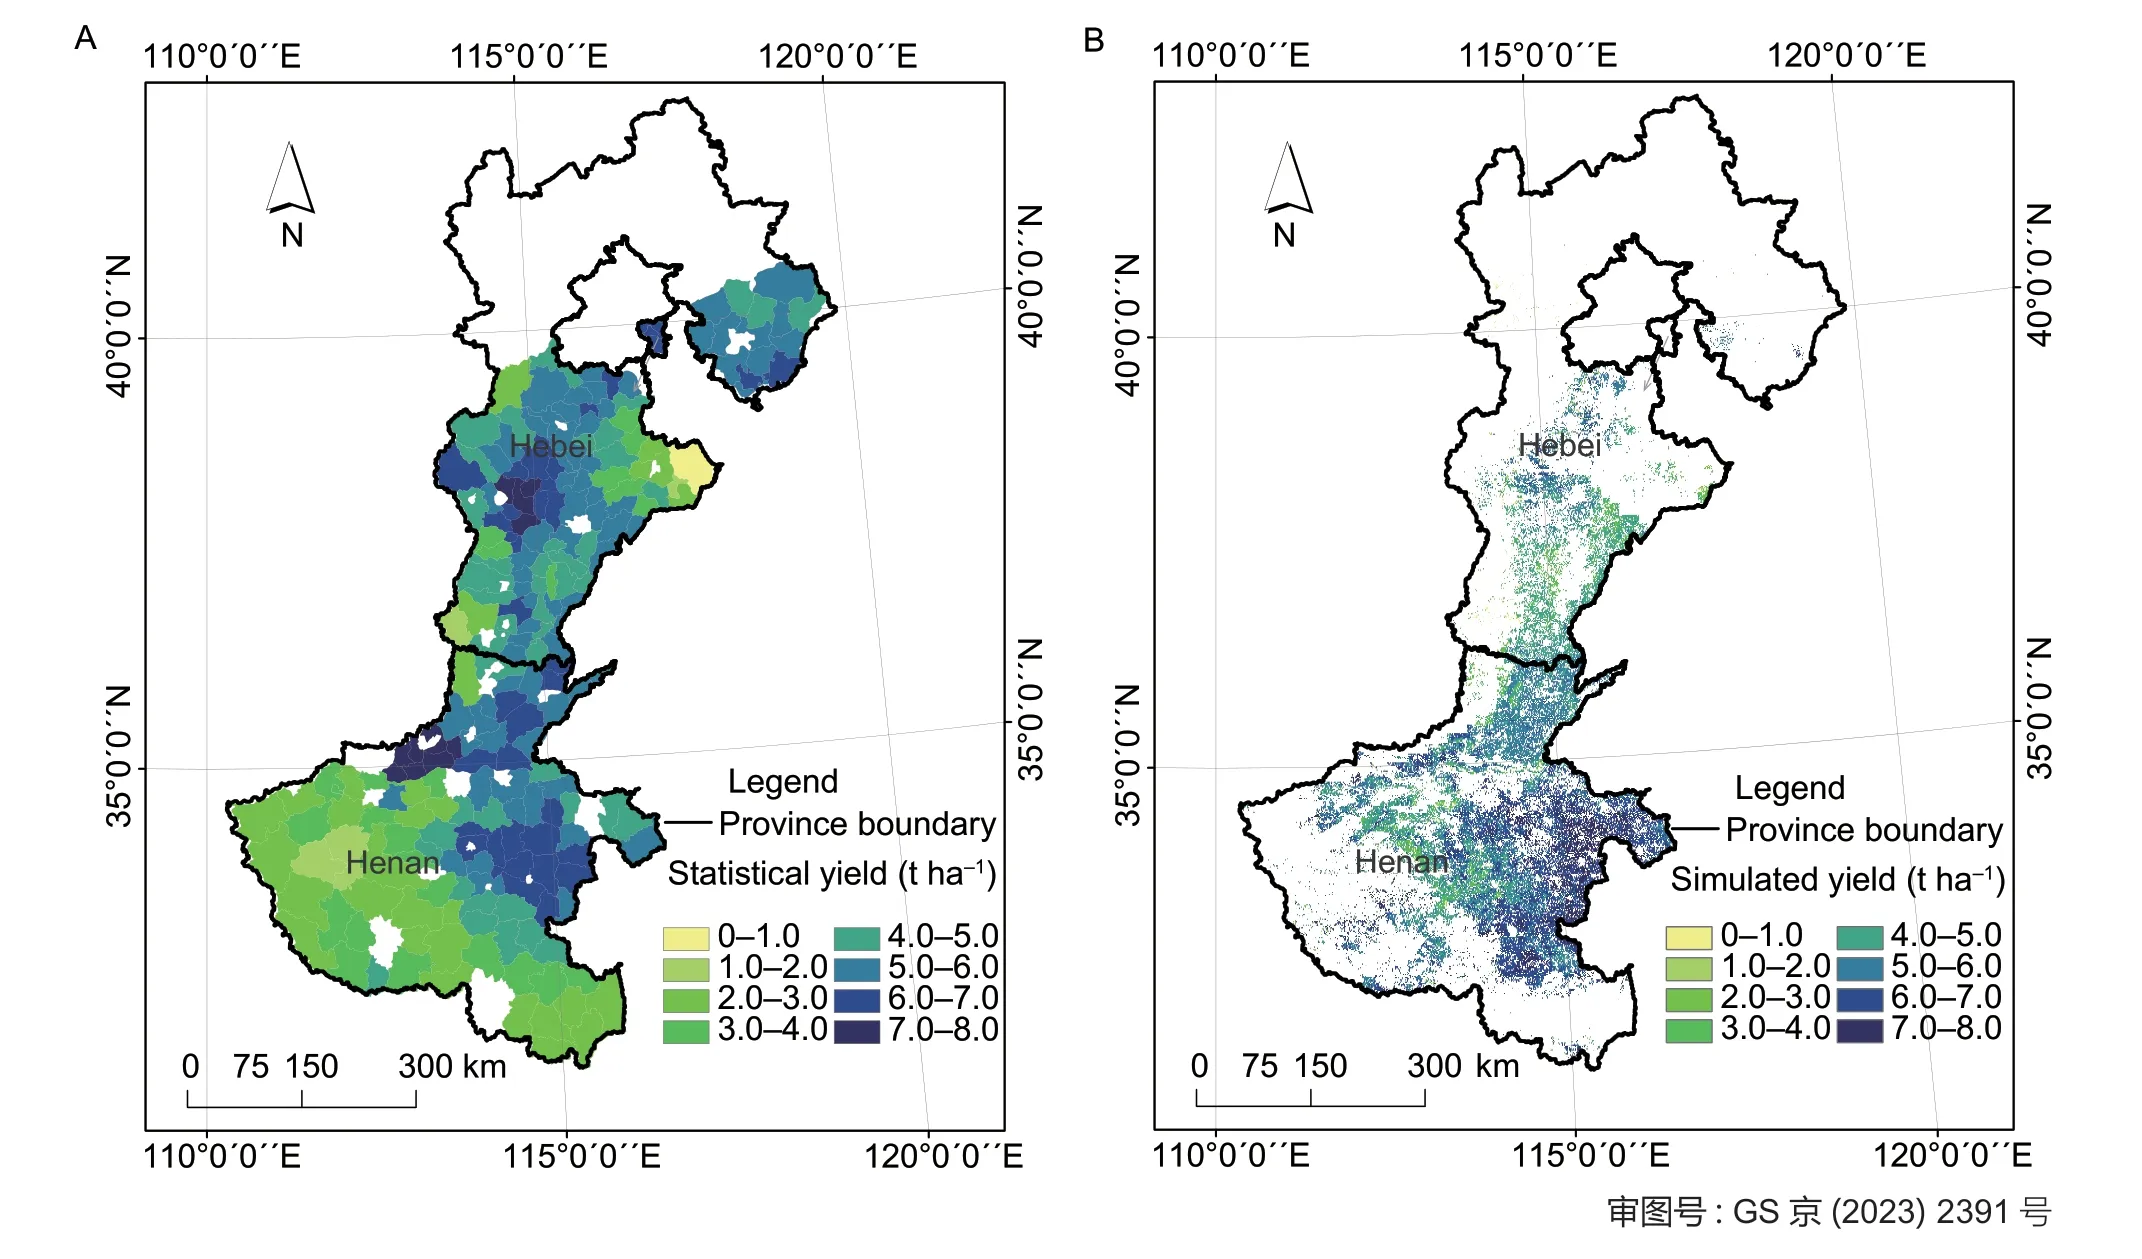
Fig.4 Spatial distribution of statistical winter wheat yield of different counties (A) and simulated winter wheat yield by PRYMWheat-Fr (B) for the year 2000.Statistical yield was obtained from provincial yearbooks.
3.4.Accuracy of the PRYM-Wheat-Fr in other years
To further illustrate the performance of PRYM-Wheat-Fr in other years,PRYM-Wheat-HI and PRYM-Wheat-Fr were used to simulate winter wheat yield in the study area from 2013 to 2015.The simulated yield based on PRYMWheat-Fr had higherR² and lower RMSE than PRYMWheat-HI (Table 5).This demonstrated that PRYMWheat-Fr performed better than PRYM-Wheat-HI in years other than those used for development of the yield simulation model,indicating that the PRYM-Wheat-Fr model is more versatile than the PRYM -Wheat-HI model.

Table 5 R² values for the relationships between simulated yield by PRYM-Wheat-HI and statistical yield,and PRYM-Wheat-Fr and statistical yield1)
4.Discussion
4.1.Spatial variation of Hl from PRYM-Wheat-Fr simulation
Currently,RS process models mainly use HI to simulate crop yield,however it should be noted that in the present study HI was the main source of simulated yield deviation due to spatial differences between each county.In order to demonstrate the spatial differences in HI between regions,the simulation biomass of PRYM-Wheat-Fr and statistical yield was used to estimate HI on county scale,as shown in Fig.5.Obvious differences were found in HI between different counties over the study area,indicating that HI was not a constant value at a regional scale.The use of a stable HI in the PRYM-Wheat-HI model neglects the spatial variation in HI,leading to errors in regional yield simulation.
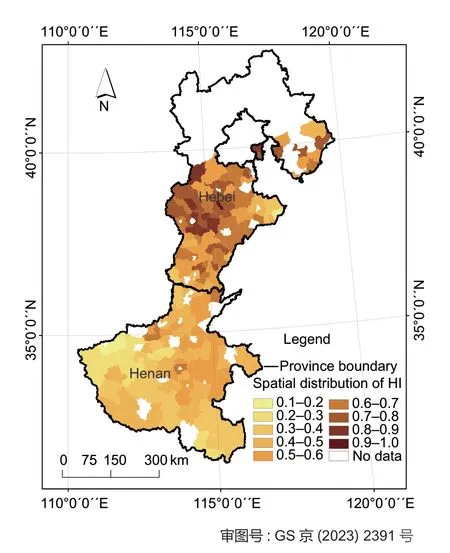
Fig.5 Spatial distribution of harvest index (HI) for different counties simulated by PRYM-Wheat-Fr biomass and statistical yield from provincial yearbooks in 2002.
The different value in the estimated HI of winter wheat in different counties of Henan and Hebei provinces is shown in (Fig.5).The average of estimated HI values in Hebei and Henan provinces was calculated and compared with observed winter wheat HI values from Jiet al.(2010),as presented in Table 6.The simulated winter wheat HI in Hebei Province was higher than the observed HI,which was caused by the large number of mixed pixels in Hebei Province.Zhanget al.(2023) reported that the existence of mixed pixels was the main reason for the underestimation of winter wheat yield in Hebei Province,since these mixed pixels affect the LAI calculation based on the empirical formula.Therefore,the estimated HI is overestimated due to underestimation of biomass in Hebei Province.The planting area of winter wheat in Henan Province was relatively concentrated and was less affected by mixed pixels;thus,the estimated HI was closer to the observed HI.The distribution frequency of simulated HI as estimated by PRYM-Wheat-Fr in Hebei and Henan provinces is shown in Fig.6.In summary,spatial differences in HI were observed between each county,leading to simulated yield deviation estimated by PRYM-Wheat-HI.

Table 6 Estimated harvest index (HI) from this study and statistical HI values for Hebei and Henan provinces,China

Fig.6 Distribution frequency of simulated harvest index (HI) in Hebei (A) and Henan (B) provinces,China.
4.2.Uncertainties in the input data
Previous studies have reported that meteorological dataand LAI are important input data for crop yield models (Wartet al.2013).RS data can improve the accuracy of crop yield models (Gilardelliet al.2019),and RS data used in the PRYM-Wheat-Fr model decreased the errors caused by the input data to some extent.Meteorological factors have great impact on crop growth and yield.In this study,meteorological data from ERA-interim and China Meteorological Administration (CMA) were used to drive PRYM-Wheat-Fr and PRYM-Wheat-HI.Zhanget al.(2021) found that best results were obtained using T from ERA-Interim and Rsg from CMA in yield simulation for all different combinations between T and Rsg.Rsg interpolated by the CMA site data performs better than ERA-Interim data over the NCP,however the sparse distribution of sites in the NCP is also one of the reasons for the interpolation error,leading to the error in yield simulation.
The quality of RS data significantly influences the accuracy of the crop yield simulated by RS process models,including PRYM-Wheat-Fr.LAI used in this study is based on MODIS EVI and empirical formulae because MODIS LAI is underestimated (Yanget al.2014).The observed,estimated,and MODIS LAI values at Yucheng station are shown in Fig.7 which shows that the estimated LAI can reduce the error caused by directly using MODIS LAI.However,the empirical formula is calibrated based on a limited amount of data,which can cause experimental errors.High-accuracy time-series LAI data can improve yield simulation by PRYM-Wheat-Fr on a regional scale.
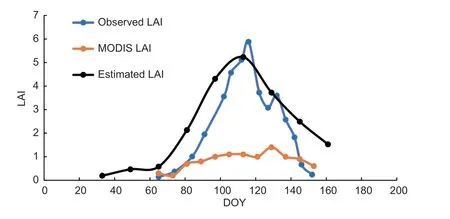
Fig.7 Estimated leaf area index (LAI) in this study and observed LAI at site scale which was extracted from Wang et al. (2007) in Yucheng Station,China (116.34°E,36.50°N) in 2001.MODIS is moderate resolution imaging spectroradiometer,DOY is the day of year.
4.3.lnfluence of mixed pixels
The statistical yield data used in this study were obtained from the statistical yearbooks for winter wheat in Henan and Hebei provinces using a sample survey method.However,the estimated winter wheat yield using PRYMWheat-Fr in this study were based on a pixel scale.The existence of mixed pixels in RS images resulted in a scale mismatch between the simulated and statistical yields.In particular,the winter wheat planting proportions in some cities,such as Zhangjiakou,Chengde,Tangshan,and Qinhuangdao in the north of Hebei Province and Nanyang,Xinyang,Sanmenxia,Luoyang,and Jiyuan in the southwest of Henan Province,are small and have more mixed pixels than other cities.Thus,mixed pixels much more obviously influence the accuracy of winter wheat yield simulation in the abovementioned cities than other cities.TheR² and RMSE of simulatedvs.statistical yields were calculated,including and excluding the abovementioned cities.TheR² and RMSE between the simulated and statistical yields,including and excluding the abovementioned areas,were 0.48 and 1.37 t ha-1,0.55 and 0.94 t ha-1,respectively.This shows that theR² and RMSE values were increased and decreased,respectively,when the abovementioned cities with mixed pixels were removed.Thus,to obtain the “true” performance of the PRYM-Wheat model,the abovementioned areas were excluded when validating simulated yield.
5.Conclusion
This study integrates a yield estimation method based on dry matter partition coefficients,which have a more specific physiological meaning than HI,with the PRYM-Wheat-Fr model to improve regional winter wheat yield simulation.This study then compares the accuracy of estimated yield using the original and improved PRYM-Wheat models (denoted as PRYM-Wheat-HI and PRYM-Wheat-Fr) across different years.The main conclusions are as follows: (1) The PRYM-Wheat-Fr model improved the accuracy of yield estimation over the NCP.For simulated yield averaged over 3 years (2000-2002) PRYM-Wheat-Fr had higherR² and lower RMSE values than PRYMWheat-HI.(2) PRYM-Wheat-Fr performed well across different years.Comparison of results for validation years (2013-2015) also showed that the performance of PRYMWheat-Fr was better than that of PRYM-Wheat-HI.(3) PRYM-Wheat-Fr captured the spatial distribution of winter wheat yield over the study area.In summary,PRYMWheat-Fr performed better than PRYM-Wheat-HI over the study area and is a useful tool for regional winter wheat yield simulation.
Acknowledgements
This work was supported by the National Natural Science Foundation of China (42101382 and 42201407),and the Shandong Provincial Natural Science Foundation,China (ZR2020QD016 and ZR2022QD120).
Declaration of competing interests
The authors declare that they have no conflict of interest.
杂志排行
Journal of Integrative Agriculture的其它文章
- OsNPF3.1,a nitrate,abscisic acid and gibberellin transporter gene,is essential for rice tillering and nitrogen utilization efficiency
- Fine mapping and cloning of the sterility gene Bra2Ms in nonheading Chinese cabbage (Brassica rapa ssp.chinensis)
- Basal defense is enhanced in a wheat cultivar resistant to Fusarium head blight
- Optimized tillage methods increase mechanically transplanted rice yield and reduce the greenhouse gas emissions
- A phenology-based vegetation index for improving ratoon rice mapping using harmonized Landsat and Sentinel-2 data
- Combined application of organic fertilizer and chemical fertilizer alleviates the kernel position effect in summer maize by promoting post-silking nitrogen uptake and dry matter accumulation
