Nonlinear constitutive models of rock structural plane and their applications
2024-03-25WenlinFengShungjinNiuChunshengQioDujinZou
Wenlin Feng,Shungjin Niu,Chunsheng Qio,Dujin Zou
a School of Civil and Environmental Engineering, Harbin Institute of Technology, Shenzhen, China
b Shenzhen Municipal Engineering Corporation, Shenzhen, 518000, China
c School of Civil Engineering, Beijing Jiaotong University, Beijing,100044, China
Keywords: Structural plane Engineering stability Roughness Normal stress Elasto-plastic constitutive model Discrete element method
ABSTRACT Structural planes play an important role in controlling the stability of rock engineering,and the influence of structural planes should be considered in the design and construction process of rock engineering.In this paper,mechanical properties,constitutive theory,and numerical application of structural plane are studied by a combination method of laboratory tests,theoretical derivation,and program development.The test results reveal the change laws of various mechanical parameters under different roughness and normal stress.At the pre-peak stage,a non-stationary model of shear stiffness is established,and threedimensional empirical prediction models for initial shear stiffness and residual stage roughness are proposed.The nonlinear constitutive models are established based on elasto-plastic mechanics,and the algorithms of the models are developed based on the return mapping algorithm.According to a large number of statistical analysis results,empirical prediction models are proposed for model parameters expressed by structural plane characteristic parameters.Finally,the discrete element method (DEM) is chosen to embed the constitutive models for practical application.The running programs of the constitutive models have been compiled into the discrete element model library.The comparison results between the proposed model and the Mohr-Coulomb slip model show that the proposed model can better describe nonlinear changes at different stages,and the predicted shear strength,peak strain and shear stiffness are closer to the test results.The research results of the paper are conducive to the accurate evaluation of structural plane in rock engineering.
1.Introduction
Structural plane is a special structure in rock engineering,which affects the strength of rock mass,and seriously endangers engineering stability,such as mine slope,tunnel support (Scotta et al.,2016;Feng et al.,2019;Ge et al.,2021;Zhu et al.,2022).Rock mass includes intact rock and structural planes,and structural planes play a decisive role in strength and deformation.Therefore,it is very important to study the mechanical properties of structural plane for the stability evaluation of the rock engineering.Understanding the shear properties of structural planes under constant normal stress is very important;Shear failure could potentially lead to many geological engineering disasters,such as sliding of large rock mass on rock slope,and movement of dam foundation along the ground (Brown,2015;Mata et al.,2014;Meng et al.,2017;Lin et al.,2020;Xie et al.,2023).
To reveal the shear characteristics of structural planes,many scholars have carried out mechanical tests by various tests,revealing various shear behaviors.Kumar and Abhiram (2016)studied anisotropic shear behavior under constant normal stress for structural planes.Their study results show that as the ratio of normal stress to compressive strength increases,the peak dilation angle decreases exponentially,while shear component increases in a power function form.Niktabar et al.(2017)carried out shear tests of conventional serrated structural planes,and results show that the shear strength increases with magnifying in the concaveconvex angle and the normal load,and the degradation mode of the concave-convex body affects the wave form of shear curves.Pirzada et al.(2020)conducted a series of shear tests on structural planes of shale,limestone,and sandstone types with both dry and saturated states,and analyzed change laws of the strength and residual strength with different water weakening effects and normal stress,as well as the deformability.Wu et al.(2022)revealed attenuation rules for the shear strength and stiffness,and established quantitative relationships for shear strength,stiffness,and effective strain.Among existing research results,most studies focus on the influence of single factor,while the influence of multi-factors coupling is relatively less.In addition,the quantitative relationships,which can directly guide engineering practice,are not proposed between the mechanical parameters and multifactors.
Based on the research results of the mechanical properties,many scholars have established a series of constitutive models by the elasto-plastic mechanics,and the study results show that elasto-plastic models can well reflect the deformation characteristics of structural plane.Based on the plastic contact,Plesha(2010)simplified the rough structural plane into the serrated shape,assuming that stress is evenly distributed on serrated plane,and established a two-dimensional constitutive model.Shen et al.(2021) improved a Goodman linear elasto-plastic shear model and proposed a total shear model,deriving the expression of tangential coupling stiffness coefficient.Zhang et al.(2022) proposed an elasto-plastic model considering the change of aperture through cyclic compression and shear test results.Based on the Mohr-Coulomb model,Rulliere et al.(2023)developed a nonlinear model that can describe shear behavior,and implement it into UDEC.In summary,the existing elasto-plastic models are mostly based on serrated plane,without considering roughness characteristics,and there are few nonlinear models.
With development of computer technology,more and more numerical methods are used to predict engineering stability.As an important method of stability evaluation in discontinuous rock mass,the discrete element method(DEM)can be used to simulate the discontinuity of the geological structure and present its failure characteristics,thus it has been paid more and more attention by scholars.Sun et al.(2016)used universal discrete element software to study failure process of footwall slope through triangle method,and obtained columnar mechanical model of double-plane footwall slope failure.Mayer and Stead (2017) studied different single crystal models in UDEC to obtain brittle fracture mechanism and crack development mechanism of rock mass.Viviana et al.(2017)combined discrete fracture network model with UDEC,and captured the composite mechanism of progressive failure of rock mass structure.Wang et al.(2022) used two-dimensional local model of deep roadway constructed by UDEC to simulate real stress loading path,and analyzed the rock burst in detail from micromacro perspectives.However,the most widely used constitutive model in numerical analysis is the Coulomb slip linear model,and nonlinear models are not widely used.The use of linear models leads to difference between numerical prediction and practical engineering monitoring results,and stability prediction engineering is also greatly affected.Hence,embedding reasonable structural plane model in numerical software is a key to the accuracy evaluation of geological engineering projects.
Due to incomplete consideration of multiple factors,lacking of nonlinear elasto-plastic model and limitations of numerical applications,this paper studies structural plane through the combination of experiment,theory and numerical method,aiming at revealing the changes in the mechanical properties,establishing nonlinear elasto-plastic constitutive models and realizing their application evaluation in DEM.Firstly,shear tests are conducted for green sandstone structural planes with different roughness.The test results reveal the shear mechanical properties under the coupling effect of roughness and normal stress.Based on elastoplastic mechanics,nonlinear shear elasto-plastic constitutive models are established,and corresponding return mapping calculation methods are developed.Using user defined model (UDM)development interface provided by UDEC,the proposed constitutive models are programmed and embedded,achieving numerical application.The research results have made contributions to the development of nonlinear calculation and numerical application of structural planes,and provide an effective reference for stability evaluation of rock engineering.
2.Methodology
In this paper,experimental research,theoretical derivation,and numerical application are combined to carry out research.The flow chart of whole research process is shown in Fig.1.The introduction of each part and related methods are as follows:

Fig.1.Flow chart of the research process.
(1) Experimental research: In Section 3,rocks are selected to prepare four sets of samples with different roughness based on the Barton standard spline curves.Four normal stress levels are designed based on 2.5%,5%,7.5%,and 10% of rock uniaxial compressive strength (UCS).According to test results,the variation laws of the mechanical parameters(strength,peak displacement,shear stiffness,JRC,normal displacement,dilatancy angle) are analyzed.Analyzing test results of this paper and other scholars,empirical prediction models for the mechanical parameters are established with the structural plane characteristic parameters by multifactor analysis method.
(2) Theoretical derivation: In Section 4,the Barton shear strength criterion is adopted as the plastic yield condition,and the plastic displacement is used as the internal variable.Combined with the change of the model parameters,incremental elasto-plastic constitutive models are built under the condition of the non-associated flow rule.The change of the post-peak roughnessJRCis chosen to characterize the softening of shear stress.The empirical relationships are established between model parameters and the structural plane characteristic parameters.Based on the back mapping algorithm principle,the calculation methods are developed,which is suitable for nonlinear elasto-plastic constitutive models.
(3) Numerical application:In Section 5,with UDM development interface,the program is compiled by C++,and running programs are embedded into UDEC.The model parameters are obtained by inputting structural plane characteristic parameters,and numerical simulations are carried out for shear.The applicability and reliability are analyzed and discussed according to numerical simulation,theoretical,and test results.
3.Shear mechanical properties of structural plane
3.1.Preparation of structural plane shear test
Green sandstone samples were collected from a slope in Sichuan Province,China.The mechanical test results for the green sandstone show that stress-strain curves are approximately consistent(numbered A-1,A-2,A-3 and A-4,respectively),as shown in Fig.2.The hoop strain of A-1 sample could not be measured due to failure of strain gauge during the test.

Fig.2.The stress-strain curves of four groups of green sandstone samples:(a)Axial stress-strain curves of the specimens,and(b)Axial stress-hoop strain curves of the specimens.
The UCS values of samples A-1,A-2,A-3,and A-4 are 77.03 MPa,74.28 MPa,83.4 MPa,and 82.01 MPa,respectively.The maximum strength difference is about 8.27%,and the average value is 79.1 MPa.The elastic moduli are 15.64 GPa,14.41 GPa,15.18 GPa,and 13.92 GPa,respectively.The maximum difference in elastic modulus is approximately 12.36%,and the average value is 14.8 GPa.The Poisson’s ratios are 0.2239,0.2562,and 0.2198,respectively.The average Poisson’s ratio is 0.23.Hence,the rock shows a good homogeneity.The mechanical properties of sandstone and structural plane are shown in Table 1.

Table 1 Mechanical parameters of the tested green sandstone samples and structural planes.
According to the roughness standard contour curves proposed by Barton (Barton and Quadros,2015),structural planes are prepared with different roughness by the wire cutting (as shown in Fig.3a and b,JRC=5.8,9.5,12.8 and 16.7).Using RMT-150B testing machine (as shown in Fig.3c),shear tests are carried out under different normal stresses (2 MPa,4 MPa,6 MPa and 8 MPa,respectively),and the shear rate is 1 mm/min.Structural planes are dyed red to record morphological changes before and after shear.

Fig.3.Barton structural planes with different roughness values and shear testing machine:(a)The selected Barton structural surface spline curve in the test,(b)Prepared structural surfaces with different roughness values,and (c) Structural plane sample in shear test.
3.2.Shear displacement and strength characteristics of structural plane
The shear stress-displacement curves are shown in Fig.4a and b for structural planes under different normal stresses,and the test results with roughness (JRC) values of 5.8 and 16.7 are taken as examples.The change of shear curves can be roughly divided into four stages: linear elastic stage,pre-peak nonlinear hardening stage,post-peak nonlinear softening stage and residual strength stage.The shear curves exhibit a highly nonlinear characteristics,and the change are approximately consistent.

Fig.4.Changes of shear stress-displacement curve,shear strength and displacement of structural planes: (a) Shear stress-displacement curves with roughness of 5.8,(b) Shear stress-displacement curves with roughness of 16.7,(c) Comparison between Barton strength criterion and test results,and (d) Variation of peak shear displacement.
The calculation results of Barton strength criterion are close to test results (as shown in Fig.4c).The strength criterion can well predict shear strength of structural planes(Bandis et al.,1983):
where τpeakis the shear peak stress (MPa),JRCis the roughness coefficient,φris the basic friction angle(°),JCSis the UCS of the rock wall (MPa),and σnis the normal stress(MPa).
The changes of the shear peak stress (τpeak) and displacementare shown in Fig.4c and d and Table 2.Under same roughness,as normal stress increases,shear peak stress goes up nonlinearly;with an increase in the roughness(JRC),shear peak stress also ascends nonlinearly,and increasing extent is also up.For example,under the normal stress of 2 MPa,the maximum strength difference is 2.42 MPa for samples with different roughness values,and under the normal stress of 8 MPa,the maximum strengthdifference can reach 4.29 MPa.Although shear peak displacement fluctuates,the change laws can be roughly obtained.Following with ascent of normal stress,shear peak displacement decreases gradually.For instance,when the roughness is 5.8,the peak shear displacement increases by about 30% when the normal stress increases from 2 MPa to 8 MPa.Along with roughness raising,the shear peak displacement also increases gradually.Such as,when the normal stress is 2 MPa,the shear peak displacement increases by about 21% as the roughness increases from 5.8 to 12.8.

Table 2 Shear peak stress and displacement of structural planes.
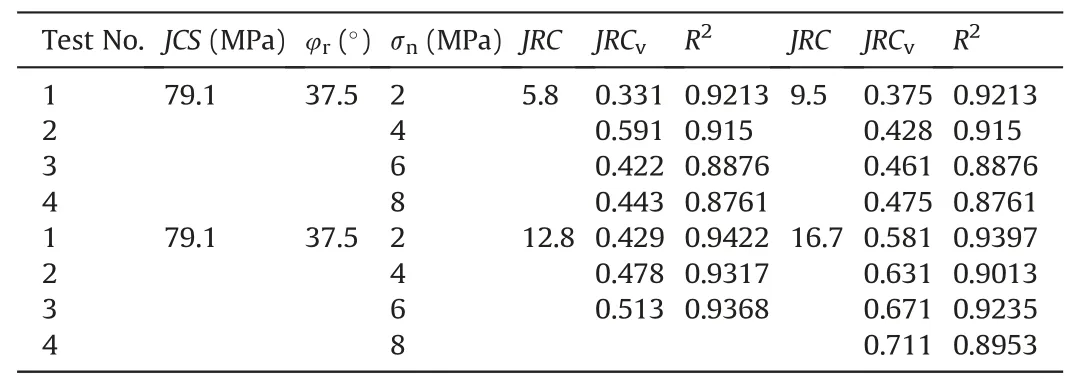
Table 3 Fitting results of shear stress softening model in this study.

Table 4 Fitting results of shear stress softening model in Bandis et al.(1983) and Li et al.(2016).
3.3.Shear stiffness of structural plane at pre-peak stage
The shear test results show that shear curves are not a straight line in the pre-peak stage.Because of hardening,shear stress changes nonlinearly with shear displacement at the pre-peak stage.In the elasto-plastic theory,the pre-peak stage is defined as the elastic stage,and it is characterized by nonlinear elastic displacement.The relationship can be shown by the following equations:
whereksis the shear stiffness (MPa/mm),δsis the shear displacement (mm),and τ is the shear stress (MPa).
Due to nonlinear variation of shear stress,the shear stiffness(ks)is not constant.According to the test results,the change trend of shear stiffness is obtained from different shear curves(as shown in Fig.5).According to Fig.5,shear stiffness fluctuates but remains approximately stable at the initial shear stage.This period lasts short,and the mean value of this stiffness is defined as the initial shear stiffness (ks0).With increasing shear displacement,shear stiffness reduction rate gradually decreases.The relationship is obtained between shear stiffness and shear displacement:
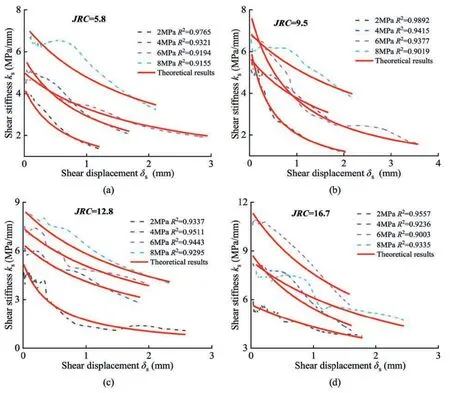
Fig.5.The variation trends of shear stiffness at the pre-peak stage.
whereaandbare the material parameters.The changes of the prepeak shear stiffnesses can be fitted by Eq.(3),and the fit correlation coefficients (R2) and curves are shown in Fig.5.The results show that Eq.(3) can well reflect the change of the pre-peak shear stiffness,and the test results are approximately consistent with the fitting results.All correlation coefficients (R2) are greater than 0.9.
When the shear displacement approaches zero,the following relationship can be obtained:
The physical meaning of material parameterais the initial shear stiffness (ks0,MPa/mm).
When the shear peak displacementis reached,the following relationship can be obtained:
Combined with Eq.(4),the following relationship can be obtained after transformation:
Based on the above,the constitutive model of the pre-peak shear stiffness is as follows:
Eq.(7) contains three parameters:τpeak,andks0.τpeakcan be determined by Eq.(1),andcan be approximately determined by the following empirical equation(Asadollahi and Tonon,2010):
However,the determination of the initial shear stiffness (ks0)has not been given.Many research results show that the initial shear stiffness is determined by the structural plane characteristic parameters,such asJRC,normal stress(σn),and UCS of the rock wall(JCS) (Jang and Jang,2015;Zhang et al.,2019).According to 204 groups of shear test results,the initial shear stiffness decreases with the increasing of the ratio of rock wall strength to normal stress(JCS/σn),and rises along with the roughness enlarging(as shown in Fig.6).The empirical equation of initial shear stiffness can be obtained by multi-factor optimization analysis method,and the correlation coefficient is 0.8663:

Fig.6.The change laws of initial shear stiffness with the structural plane characteristic parameters: (a) JCS/σn,and (b) JRC.
whereLis the length of structural plane (mm).
3.4.Roughness and residual strength of structural plane
During shearing,attenuation of the roughness occurs due to the interaction of micro-convex body wear and gnawing.According to Eq.(1),the roughness can be obtained by the inversion of the strength criterion (Simon et al.,2017).The specific formula is as follow:
whereJRC(δs)isJRCto arbitrary shear displacement δs,and τ(δs)is the shear stress to any shear displacement δs.
TheJRCat the shear peak stress(JRCp)and theJRCat the residual strength stage(JRCr)are obtained by inversion method.The change laws ofJRCfor structural planes are shown in Fig.7.The roughness shows a decreasing change during shearing,but the amount ofJRCreduction is influenced by normal stress and roughness.For smooth structural planes,JRCreduction is small under low normal stress.As normal stress ascends,JRCreduction increases gradually,and reduction rate is high with large roughness.JRCreduction and reduction rate all decrease with increasing normal stress.
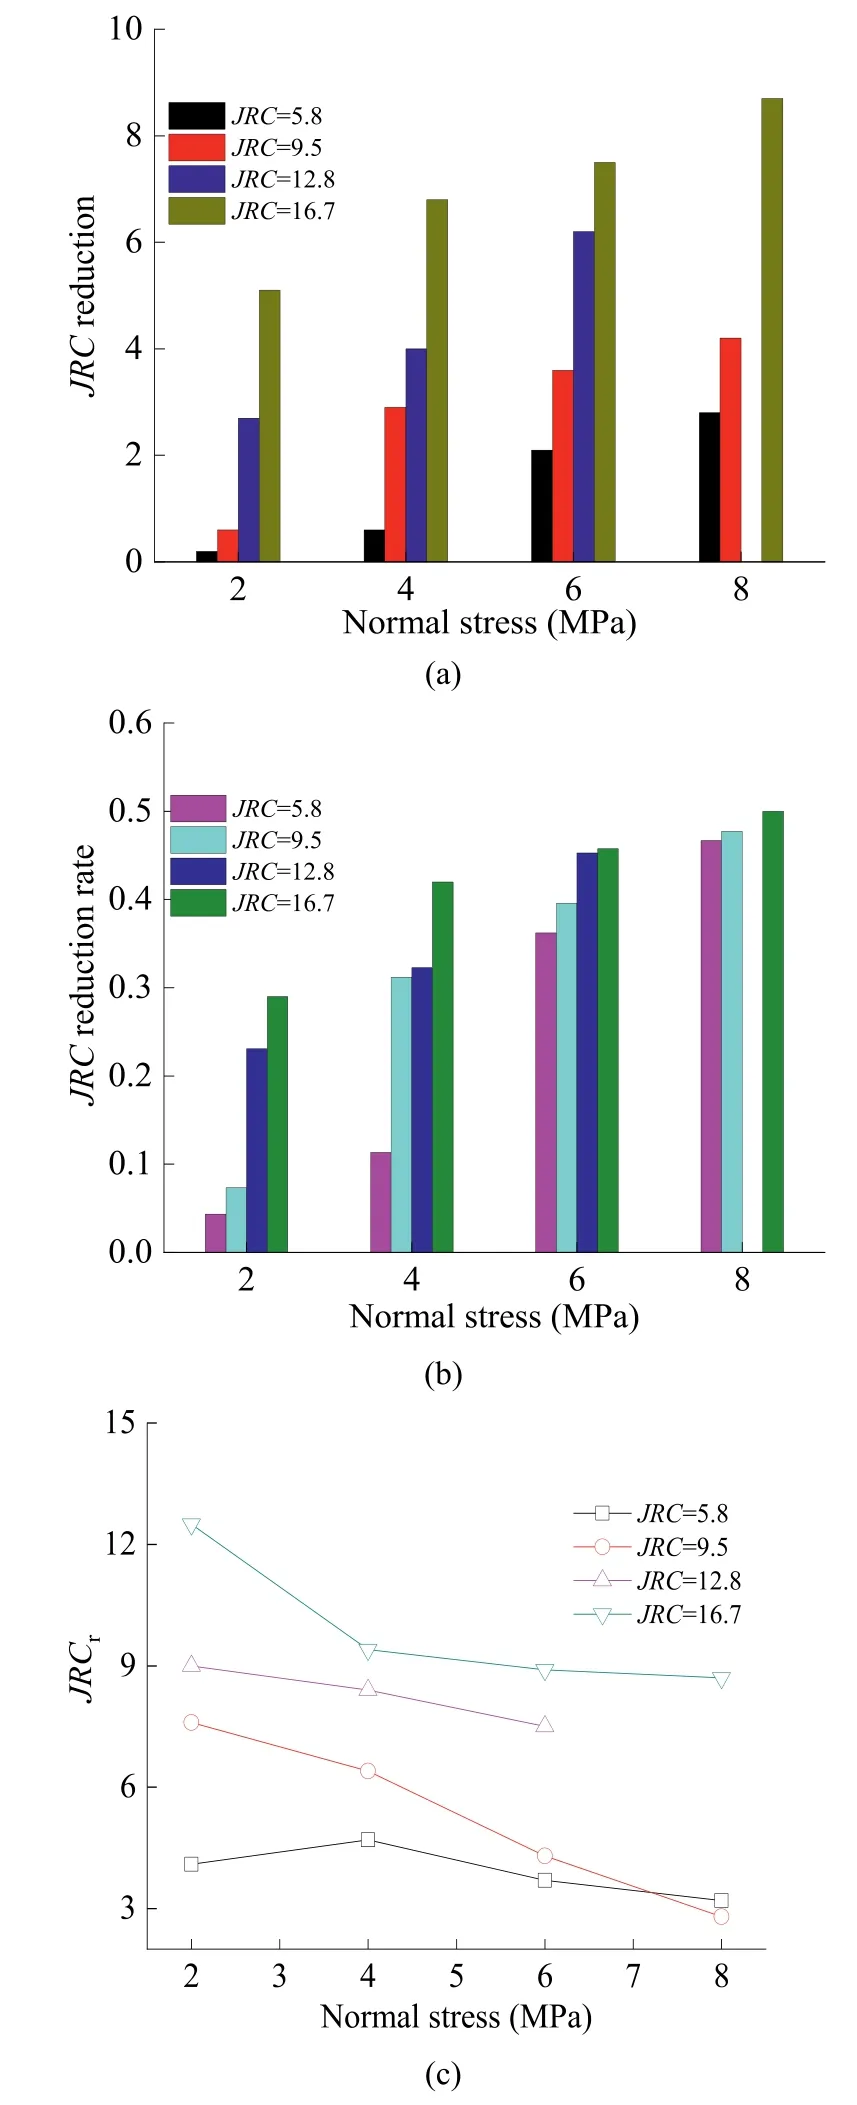
Fig.7.Changes of JRC of structural plane after shearing: (a) Reduction of JRC under different normal stresses,(b) Reduction ratio of JRC under different normal stresses,and (c) Residual strength stage JRC (JRCr) under different normal stresses.
The change ofJRCrwith normal stress (σn),rock wall strength(JCS)and roughness(JRC)can be obtained by analyzing 204 groups test results.Fig.8 shows the change ofJRCrwith the ratio of normal stress to rock wall strength(σn/JCS),and roughnessJRC.As shown in Fig.8,with the ratio of normal stress to rock wall strength increasing,JRCrshows a tendency to decay.With an increase in roughness,JRCrshows a magnifying trend.The empirical formula can be obtained forJRCrwith normal stress(σn),rock wall strength(JCS)and roughness(JRC)by multi-factor analysis method,and the fitting correlation coefficient is 0.8537:

Fig.8.Changes of JRCr with the structural plane characteristic parameters: (a) JCS/σn,(b) JRC,and (c) Three-dimensional (3D) surface change of JRCr.
3.5.Normal displacement and dilatancy angle of structural plane
During shearing,various concave and convex points cross each other on the structural plane.Although structural plane is constrained in the vertical direction,it still appears normal displacement.Usually,the phenomenon that the negative normal displacement is called contraction,and the positive normal displacement is called dilatancy.Fig.9 shows the change of normal displacement with different roughness under different normal stresses.According to Fig.9,most normal displacement is dilatancy,and the dilatancy is much larger than the contraction.The starting point of the dilatancy is generally near the shear peak stress.The change of the dilatancy is first continuously increasing,then gradually decreases,and finally reaches a stable state,which is a nonlinear process.
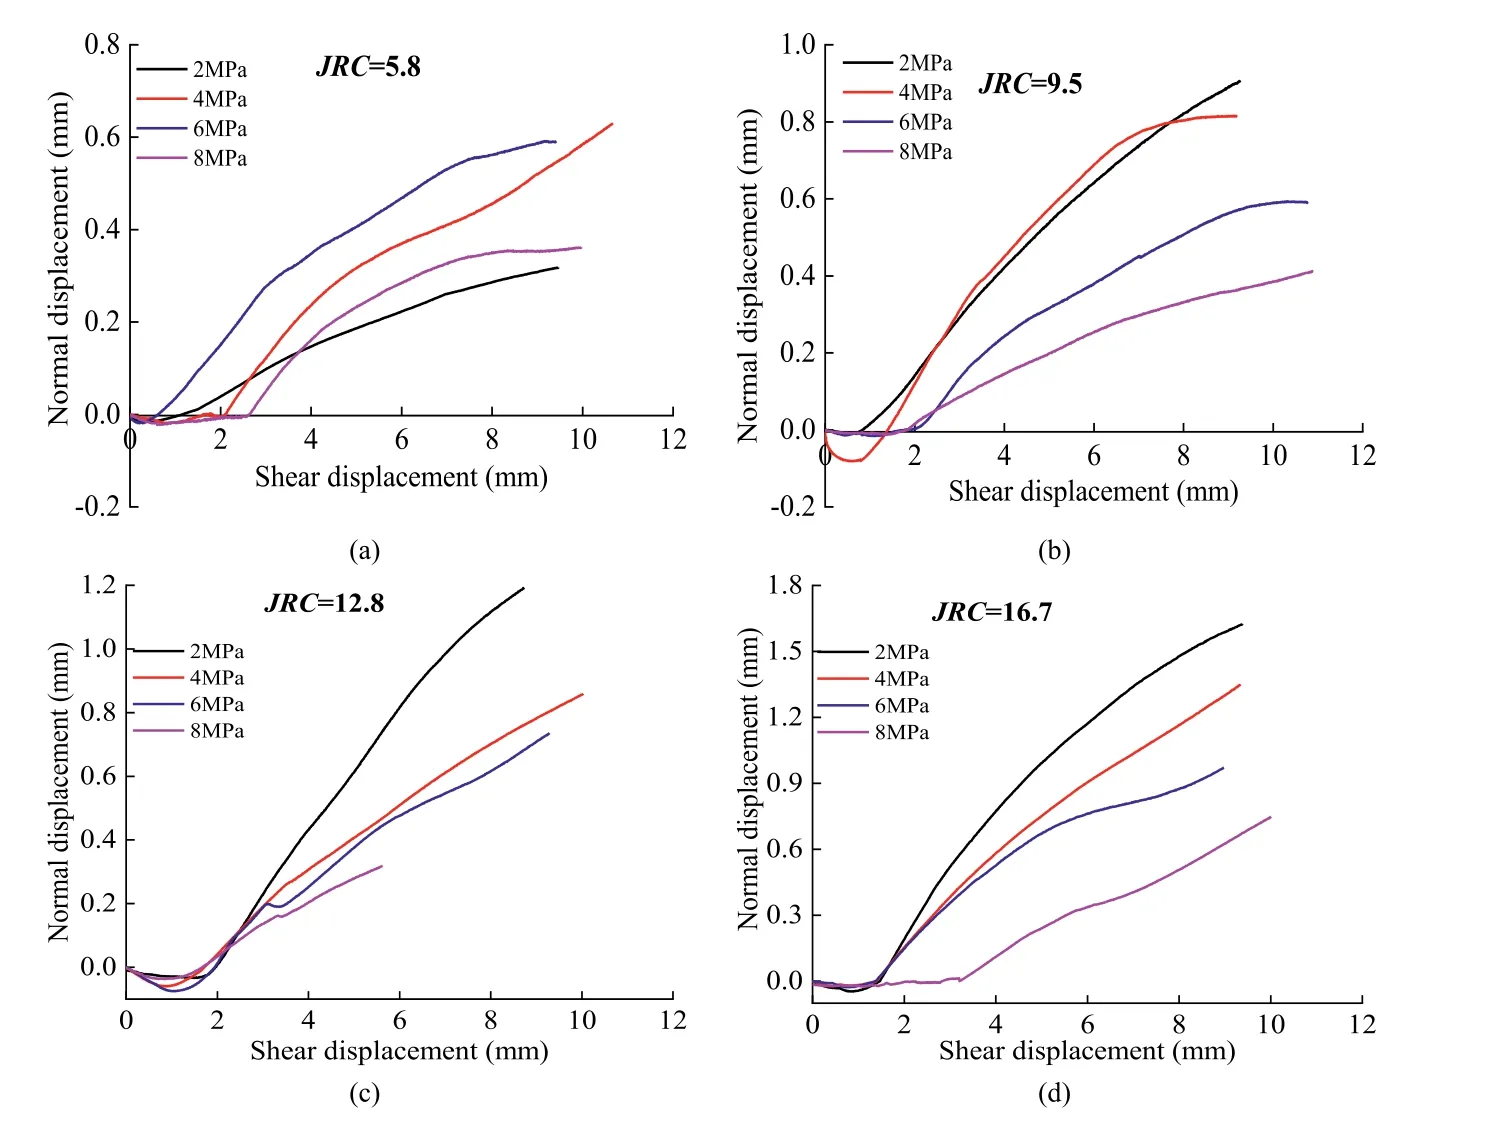
Fig.9.Dilatancy of structural surfaces with different roughness values under various normal stresses.
Although normal displacement has fluctuation,the variation characteristics of normal displacement still can be obtained.Under same roughness,sunch as 2 MPa,4 MPa 6 MPa and 8 MPa,as normal stress magnifies,normal displacement decreases gradually,and normal stress can limit the change of normal displacement.
With roughness going up,the normal displacement amplifies.Rough structural planes have large undulation and unevenness;thus,the normal displacement is relatively large.
The occurrence of normal displacement is due to the change of dilatancy angle during shearing.As roughness continues to decrease at the post-peak stage,dilatancy angle also reduces in nonlinearity.Dilatancy angle is the largest at the shear peak stress.The calculation method of dilatancy angle is as follows (Barton et al.,1985):
whered(δs) represents the dilatancy angle for any shear displacements during shearing.
According to Eqs.(12) and (13),the change of dilatancy angle can be obtained during post-peak shear process.Fig.10 shows the change of the post-peak dilatancy angle with different roughness and normal stresses.The post-peak dilatancy angle is gradually decreasing from the shear peak stress to the residual strength stage,and final dilatancy angle reaches an approximately constant.With the same roughness,the peak dilatancy angle is relatively large with low normal stress.In pace with normal stress enhancing,the reduction rate of the dilatancy angle gradually increases.As roughness rises,the dilatancy angle gradually enlarges under same normal stress.Especially for the structural plane with large roughness and normal stress,the reduction rate is very severe.
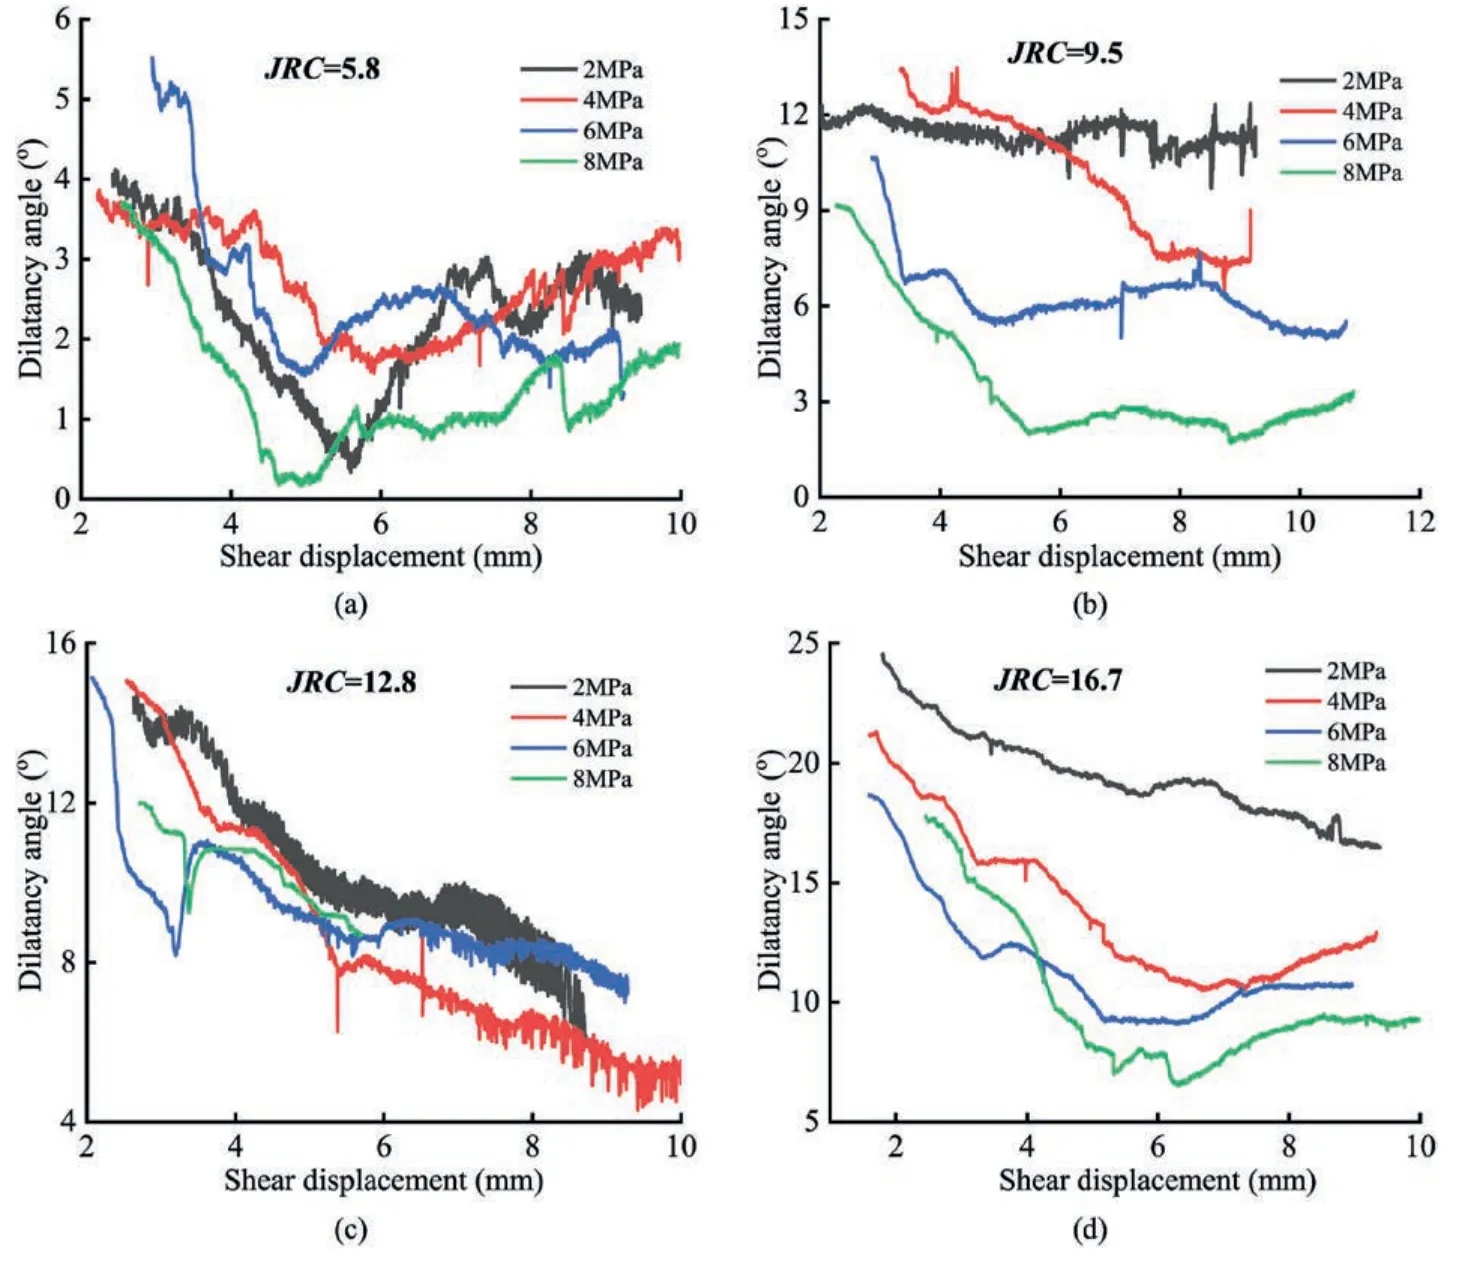
Fig.10.Changes of post-peak dilatancy angle of structural planes with different roughness values.
4.Incremental elasto-plastic constitutive model of structural plane
4.1.Shear yield and potential function under non-associated flow rule
Compared with many shear strength criteria,the Barton strength criterion has strong applicability in engineering field,and high accuracy of prediction results(Bandis et al.,1981;Bandis et al.,1983).The Barton strength criterion as yield function can be expressed as follows:
According to the author’s previous research results (Feng et al.,2022),based on the non-associated rule framework (Melentijevic et al.,2017;Simon et al.,2018),the potential function (Q) is different from the yield function(F)(Son et al.,2004),which can be expressed as
Without considering the elastic expansion displacement,the ratio of displacement incrementcan be set as the function of the dilatancy angle:
where Δλ represents the plastic factor and is also a nonnegative scalar.
The dilatancy angle is a function of shear plastic displacement,and the results have been verified (Li et al.,2014;Zhang et al.,2022).The integral form of the potential function can be obtained by substituting the dilatancy angle:
4.2.The elasto-plastic basic constitutive model of structural plane
In the elastic deformation phase,the shear and normal stress increment are defined as Δτ and Δσn,respectively;the shear and normal displacement increment are defined as Δδsand Δδn,respectively.The incremental constitutive model is as follows:
wherekerepresents the elastic stiffness matrix;andandare the shear and normal displacement increments,respectively.
After shear stress reaches the yield stress,shear displacement will satisfy the following relationship:
The constitutive relation of Eq.(18) is extended:
Each plastic displacement increment is as follows:
By the framework of the consistency condition (ΔF=0),the following expression can describe:
4.3.Reflection of shear stress at post-peak stage
The nonlinear change of shear stress at pre-peak stage is reflected by the change of shear stiffness,which has been clarified in detail in the previous section.The shear test results show that the softening of shear stress at the post-peak stage is due to the attenuation of roughness.Therefore,the attenuation of roughness(JRC) can reflect shear stress.
Fig.11 shows the change of the post-peakJRCwith shear plastic displacement.The negative exponential function can accurately reflect the change characteristics ofJRCat the post-peak stage,and Tables 3 and 4 list the fitting results:

Fig.11.Change laws of post-peak JRC for different test results:(a)JRC=5.8,(b)JRC=9.5,(c)JRC=12.8,(d)JRC=16.7,(e)Data from Bandis et al.(1983),and(f)Data from Li et al.(2016).
whereA,BandCare the material constants of the structural plane.
Based on the plastic boundary condition,shear plastic displacement occurs at the shear peak stress.Substituting this control condition,we have
If shear plastic displacement can continue to increase to infinity,the following relationship can be obtained:
The physical meaning of the parameterCisJRCr.Substituting the parameterCinto Eq.(25) results in
The physical meaning of the parameterAis the logarithmic value of the difference betweenJRCpandJRCr.ParameterBis the parameter that can control the change rate ofJRCat the post-peak stage,whose physical meaning isJRCdecay rate,and is denoted byJRCv:
According to the Barton strength criterion and Eq.(28),the postpeak shear stress can be expressed:
4.4.Development of incremental return mapping algorithm for elasto-plastic constitutive model
Keeping stress stable when the predetermined normal stress reaches,shear displacement contains two phases: the displacement is nonlinearly elastic at the pre-peak stage,and the displacement is nonlinearly elasto-plastic at the post-peak stage.This section introduces the incremental algorithm of the constitutive models in detail.
Assuming that in the shear elastic prediction state at timetn,according to shear displacement increment Δδsand shear plastic displacement δs(n+1)ptrial,trial shear stress at timetn+1is obtained:
The trial shear stress is updated by Δδs,and the stress state is decided based on the yield function:
The shear stress state can be divided into the following three cases:
(1)WhenF<0,this shows that the displacement is at the elastic stage,and the shear stress indicates:
(2) WhenF=0,this shows that the displacement reaches the elastic boundary.The shear stress does not need to be corrected,and it indicates:
(3) WhenF>0,this shows that the plastic displacement appears.The shear stress should be corrected:
The update of the shear plastic displacement is expressed as
At the post-peak stage,JRCwill gradually decay.With Eq.(32),a newJRC(n+1)is updated by
Since the return mapping algorithm can ensure stable calculation without stress drift,shear stress is corrected based on this algorithm (Bruno et al.,2020;Lee et al.,2021),and the corresponding trial shear stress is as follows:
By Eqs.(34)-(37),the following form can be obtained:
The model parameters can be determined,and the only unknown quantity isThus it can be treated as the equation regardingImproving calculation accuracy is a key to reasonable model results,and it is necessary to choose an appropriate iterative method to solve problem(Thomas et al.,2017;Areias et al.,2021).After reaching the iteration accuracy,iterative calculation stops:
Correcting the stresses and displacements that need to be corrected:
At the post-peak stage,the increase of normal displacement gradually tends to be stable.Substituting the relationship between dilatancy angle and shear plastic displacement,normal displacement increment is expressed:
The calculation process of normal displacement can be shown:
where δn(i+1)stands for the normal displacement after (i+1)th calculation.
4.5.Determination method of model parameters
The elasto-plastic models contain three model parameters:JRCp,JRCrandJRCv.JRCpis the initial roughnessJRC,which can be determined by histogram or empirical formulas.JRCrcan be determined by Eq.(11).The change ofJRCvaffects the change rule of the post-peak shear stress.It is very important to determineJRCvfor obtaining reasonable shear stress evolution.The shear test results of 204 sets of structural planes are analyzed.
According to many test results,the correlation betweenJRCvand the basic friction angle is small,but it has an excellent relationship with the structural plane characteristic parameters(roughnessJRC,normal stress σnand rock wall strengthJCS).Fig.12 shows the change ofJRCvwith the structural plane characteristic parameters.As shown in Fig.12,the value ofJRCis between 4 and 20.With the increase of roughnessJRC,JRCvshows a gradual increase,and the increase rate also magnifies.With the ratio of rock wall strength to normal stress(JCS/σn) increasing,JRCvdecreases gradually.

Fig.12.Variations of JRCv with the structural plane characteristic parameters: (a) JCS/σn,(b) JRC,and (c) 3D surface change of JRCv.
According to the change rules ofJRCv,the empirical formula ofJRCvis obtained among roughnessJRC,normal stress and rock wall strengthJCSby multi-factor analysis method,and the correlation coefficient can reach more than 0.87:
4.6.Validation of the proposed models
The elasto-plastic constitutive models and corresponding algorithms are verified by shear test results.Fig.13 shows the comparison of shear stress-displacement curves.
As shown in Fig.13,the red solid line represents the calculation results of the theoretical model,and the blue dotted line represents the results of the numerical simulation.The pre-and post-peak changes are all well presented by the new nonlinear model.The nonlinear variation characteristics of shear stress can be effectively reflected.It is reasonable to use the nonlinear change of the preand post-peakJRCattenuation to describe the change of shear stress.Several parameters in the elasto-plastic constitutive model can be obtained directly according to test results and can also be obtained according to empirical equations.The model parameters are few,and the calculation process is relatively easy to realize.
Fig.14 shows the comparison of normal displacement incremental constitutive and test results.From Fig.14,the dilatancy model of structural plane can well reflect nonlinear variation characteristics of normal displacement.The starting point of the dilatancy is at the shear peak stress,and this feature is like that obtained from shear tests.The relationship between normal displacement changes and dilatancy angle can be well reflected.The increase of normal stress can effectively inhibit normal displacement,and the two are inversely proportional.The increase of roughness aggravates climbing phenomenon,and normal displacement also increases.

Fig.14.Comparisons between shear dilatancy test results,dilatancy model results,and numerical simulation results:(a) JRC=5.8,(b) JRC=9.5,(c) JRC=12.8,(d) JRC=16.7,(e)Data from Bandis et al.(1983),and (f) Data from Li et al.(2016).
5.Application of shear elasto-plastic constitutive model in UDEC
5.1.Embedding elasto-plastic constitutive model into UDEC
The dynamic link library(.DLL file) is generated and embedded into the constitutive library of UDEC by using the C++language,realizing the application of the shear nonlinear elasto-plastic model.In this section,the operation process of the shear elastoplastic constitutive models is discussed in detail.For UDEC model,the force(Fi)is updated instead of the stress(σi).The calculation of the force is related to the stiffness parameters.The relationships for the stiffness parameters,force and stress used in the calculation are as follows:
whereksandknare the shear stiffness and normal stiffness,respectively;ks0aandknaare the initial shear stiffness parameter and normal stiffness parameter,respectively;ajis the initial structural plane aperture;Acis the force acting area;andLis the length of the structural plane.
The shear residual strength is reflected by the roughnessJRCr:
The shear elasto-plastic constitutive model can be divided into two stages:the pre-and post-peak stages.The shear force update at the pre-peak stage is determined by the previous shear displacement,current shear displacement increment,and previous shear force:
The calculated shear force of the (i+1)th trial is updated by previous shear force and force increment:
When the shear force reaches the maximum shear force,the elastic stage ends and enters the elasto-plastic stage.Therefore,the maximum shear force needs to be set:
In the shear force calculation,the stress state needs to be determined.WhenFstrial≤Fsmax,the shear force is at the elastic stage,and the shear force is updated by Eq.(52).WhenFstrial>Fsmax,the update form of shear stress changes and enters the elasto-plastic stage.
According to shear displacement increment,shear plastic displacement increment is solved by the Newton-Raphson iteration method,and then shear force is corrected:
Update shear force,shear elastic displacement and shear plastic displacement:
The starting point of dilatancy in constitutive model is at the shear peak stress.When stress decreases,force increment changes from negative to positive.When ΔFs≥0,the dilatancy behavior begins to occur:
The normal displacement is then updated according to the normal displacement increment:The above is the incremental calculation methods of the constitutive models embedded in UDEC,and the representation and physical meaning of the input parameters are shown in Table 5.

Table 5 Input parameter expression and physical meaning of shear elasto-plastic constitutive model in UDEC.
5.2.Computational model
The shear numerical model is established by UDEC.Fig.15 shows the established discrete element shear numerical model.The numerical model consists of top and bottom blocks.The size and boundary conditions of the two blocks are as follows:
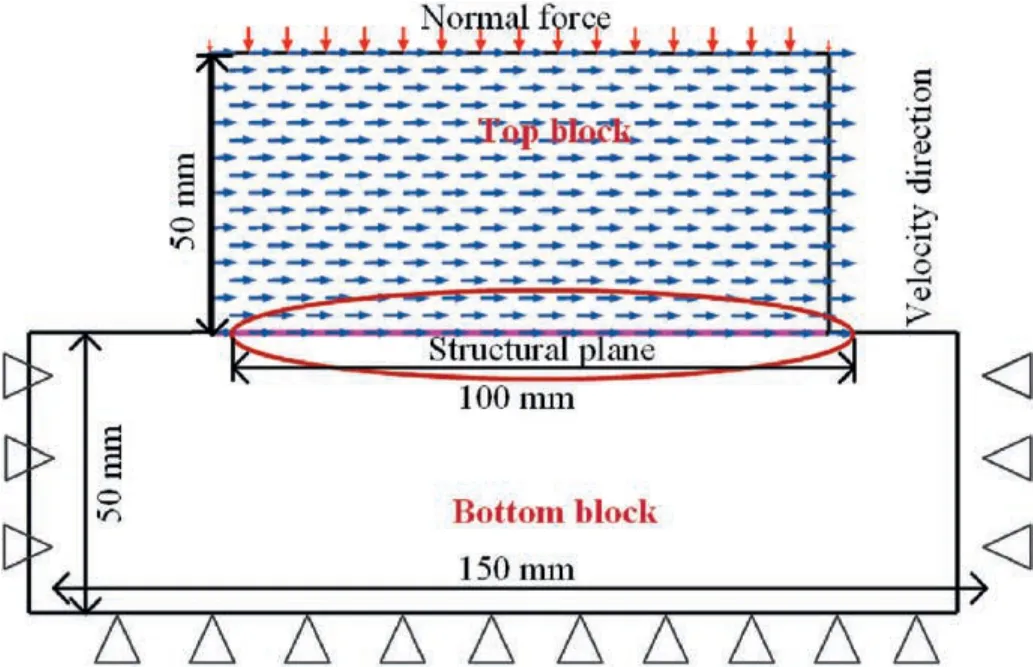
Fig.15.Shear numerical model of structural plane in UDEC.
(1) Top block: The top block is 100 mm long and 50 mm high,and it is a free block.During shear numerical simulation,they-negative normal stress is uniformly applied along the upper part of the top block,and a constant velocity in thexdirection is uniformly applied inside the block to create shear force.The shear rate is 1 mm/min.
(2) Bottom block:The bottom block is 150 mm long and 50 mm high.The reason why the bottom block is longer than the top block is that the structural planes are in contact during shear process.The bottom block belongs to the fixed block,and the left boundary,right boundary and lower boundary of the block will not produce displacement in the shear process.The structural plane is set in the area where the top block is in contact with the bottom block.
The average shear stress (sstav),average shear displacement(sjdisp),average normal stress (nstav) and average normal displacement (njdisp) are recorded by UDEC internal FISH language.
5.3.Analysis and discussion of numerical results
The embedded shear elasto-plastic constitutive model is used to conduct shear numerical simulation to verify the rationality of the discrete element application.Figs.13 and 14 show the comparison of the shear tests,theoretical and numerical simulation results.In these figures,red solid line represents the results of the theoretical model,and blue dotted line represents the results of the numerical simulation.
According to Fig.13,numerical simulation results can well show the pre-peak nonlinear elastic stage,the post-peak nonlinear softening stage and the residual strength stage.The average deviation between the shear peak stress obtained by numerical simulation,experimental results and theoretical results does not exceed 10%,and the average shear peak displacement deviation does not exceed 15%.Meanwhile,the model parameters have a good correlation with the structural plane characteristic parameters,which can be obtained by empirical formulae,and it has engineering application value.
Fig.14 shows the comparison of shear tests,numerical simulations,and theoretical results.According to the analysis,the embedded constitutive model of normal displacement can better reflect the nonlinear change process at the post-peak stage,and the influence of roughness and normal stress on normal displacement.With the increase of normal stress,the starting point of the dilatancy magnifies gradually,but normal displacement decreases.As roughness increases,normal displacement augments gradually.
The Mohr-Coulomb linear slip model,which is commonly used in rock mass stability evaluation,is used to carry out numerical simulations of structural plane shear (JRC=5.8 and 16.7 are compared).Fig.16 shows the comparison of shear stressdisplacement and dilatancy results between the proposed model and the Mohr-Coulomb model.The comparison results show that shear stress-displacement curves of the Mohr-Coulomb model are three straight lines,which cannot reflect the nonlinear characteristics of shear,and only reflect the general change trend.The proposed model can well reflect the nonlinear variation characteristics of each stage in shear curves.The dilatancy curves of the Mohr-Coulomb model are a straight line,which are very different from the dilatancy test results,and cannot reflect the nonlinear characteristics of the dilatancy.The dilatancy angle in the proposed model changes nonlinearly with the shear displacement,which solves the problem of the linear change of the original dilatancy result,and has applicability and rationality.

Fig.16.Comparison of numerical simulation results between proposed model and Mohr-Coulomb linear slip model.
6.Conclusions and prospect
This paper combines experimental analysis,theoretical derivation,and numerical application methods to conduct the study of nonlinear mechanical properties and constitutive model of structural plane.The shear mechanical properties are obtained for structural planes with different values of roughness and normal stress.Then,elasto-plastic constitutive models are established,and numerical application evaluation is achieved.According to the research results,the following conclusions can be drawn:
(1) The shear curves can be divided into three stages: the prepeak nonlinear stage,the post-peak nonlinear stage and the residual strength stage.As normal stress and roughness change,the shear peak stress and peak displacement show nonlinear changes.
(2) The change of the pre-peak shear stiffness satisfies hyperbolic form,and the physical meaning of each parameter can be obtained from the control conditions.Through statistical analysis,the empirical formula between the initial shear stiffness and the structural characteristic parameters is established.
(3) With the increases of normal stress and roughness,JRChas different degrees of attenuation.JRCris affected by both normal stress and roughness at the residual strength stage.The relationship betweenJRCrand the structural plane characteristic parameters is established.
(4) The constitutive models for shear and dilatancy are established based on the elasto-plastic mechanics,and the shear stress softening model is established to reflect its variation law.Simultaneously,algorithms suitable for the constitutive models are developed by the return mapping algorithm.
(5) Using the interface of the constitutive model in UDEC,running programs of the constitutive models are written in C++,and numerical applications of the constitutive models is realized.
The author used the elasto-plastic method to establish the constitutive models for structural planes,and verified the rationality and applicability of the models through experiments.However,there are still some limitations in the study of constitutive models in this paper.The coupling effect of different directions of structural plane is not considered.The constitutive models do not consider the 3D form,and the nonlinear constitutive model of normal loading is not considered.
In future research,the authors will carry out the research on 3D constitutive model with the multi-directional coupling effect.At the same time,considering nonlinearity of the compression,the normal and shear constitutive models will be integrated to improve the constitutive model of structural plane.
Declaration of competing interest
The authors declare that they have no known competing financial interests or personal relationships that could have appeared to influence the work reported in this paper.
Acknowledgments
This work presented in this paper was funded by the National Natural Science Foundation of China (Grant Nos.51478031 and 51278046)and Shenzhen Science and Technology Innovation Fund(Grant No.FA24405041).The authors are grateful to the editor and reviewers for discerning comments on this paper.
杂志排行
Journal of Rock Mechanics and Geotechnical Engineering的其它文章
- Using deep neural networks coupled with principal component analysis for ore production forecasting at open-pit mines
- Sliding behaviors of the trapezoidal roof rock block under a lateral dynamic disturbance
- Real-time arrival picking of rock microfracture signals based on convolutional-recurrent neural network and its engineering application
- Failure characterization of fully grouted rock bolts under triaxial testing
- Mechanical behaviors of backfill-rock composites:Physical shear test and back-analysis
- Slope stability of reclaimed coal mines through a new water filling index
