Assessment of soil total phosphorus storage in a complex topography along China’s southeast coast based on multiple mapping scales
2024-03-07ZhongxingCHENJingLIKaiHUANGMiaomiaoWENQianlaiZHUANGLichengLIUPengZHUZhenongJINShiheXINGandLimingZHANG
Zhongxing CHEN ,Jing LI,2 ,Kai HUANG,3 ,Miaomiao WEN ,Qianlai ZHUANG ,Licheng LIU ,Peng ZHU,Zhenong JIN,Shihe XING and Liming ZHANG,*
1Fujian Provincial Key Laboratory of Soil Environmental Health and Regulation,College of Resources and Environment,Fujian Agriculture and Forestry University,Fuzhou 350002(China)
2State Key Laboratory of Atmospheric Boundary Layer Physics and Atmospheric Chemistry,Institute of Atmospheric Physics,Chinese Academy of Sciences,Beijing 100029(China)
3Guangxi Zhuang Autonomous Region Plant Protection Station,Nanning 530022(China)
4Department of Earth,Atmospheric,and Planetary Sciences,Purdue University,West Lafayette IN 47907(USA)
5Department of Bioproducts and Biosystems Engineering,University of Minnesota-Twin Cities,Saint Paul MN 55108(USA)
6Department of Geography,The University of Hong Kong,Hong Kong 999077(China)
ABSTRACT Soil phosphorus(P)plays a vital role in both ecological and agricultural ecosystems,where total P(TP)in soil serves as a crucial indicator of soil fertility and quality.Most of the studies covered in the literature employ a single or narrow range of soil databases,which largely overlooks the impact of utilizing multiple mapping scales in estimating soil TP,especially in hilly topographies.In this study,Fujian Province,a subtropical hilly region along China’s southeast coast covered by a complex topographic environment,was taken as a case study.The influence of the mapping scale on soil TP storage(TPS)estimation was analyzed using six digital soil databases that were derived from 3 082 unique soil profiles at different mapping scales,i.e.,1:50 000(S5),1:200 000(S20),1:500 000(S50),1:1 000 000(S100),1:4 000 000(S400),and 1:10 000 000(S1000).The regional TPS in the surface soil(0-20 cm)based on the S5,S20,S50,S100,S400,and S1000 soil maps was 20.72,22.17,23.06,23.05,22.04,and 23.48 Tg,respectively,and the corresponding TPS at 0-100 cm soil depth was 80.98,80.71,85.00,84.03,82.96,and 86.72 Tg,respectively.By comparing soil TPS in the S20 to S1000 maps to that in the S5 map,the relative deviations were 6.37%-13.32%for 0-20 cm and 0.33%-7.09%for 0-100 cm.Moreover,since the S20 map had the lowest relative deviation among different mapping scales as compared to S5,it could provide additional soil information and a richer soil environment than other smaller mapping scales.Our results also revealed that many uncertainties in soil TPS estimation originated from the lack of detailed soil information,i.e.,representation and spatial variations among different soil types.From the time and labor perspectives,our work provides useful guidelines to identify the appropriate mapping scale for estimating regional soil TPS in areas like Fujian Province in subtropical China or other places with similar complex topographies.Moreover,it is of tremendous importance to accurately estimate soil TPS to ensure ecosystem stability and sustainable agricultural development,especially for regional decision-making and management of phosphate fertilizer application amounts.
Key Words: agricultural management,appropriate mapping scale,digitized conventional soil map,estimation uncertainty,subtropical hilly region
INTRODUCTION
Soil phosphorus(P)plays a crucial role in both ecological and agricultural ecosystems(Alewellet al.,2020),where the global estimation of soil total P storage(TPS)is about 200 Pg(Kellogg and Bridgham,2003).Any slight changes in the P pool may have a significant impact on the biogeochemical cycle(Stileset al.,2017).Utilizing P fertilizers can promote root growth and accelerate the growth of crops(Hanselet al.,2017).However,a significant increase in soil total P(TP)content in farmland was observed due to the overuse of phosphate fertilizers(Ulénet al.,2016).According to the Food and Agriculture Organization of the United Nations,the applicable amount of phosphate fertilizer has substantially increased,at least in the past decade(Mekouar,2017).China has a relatively high application rate of phosphate fertilizer per unit cultivated land area(103.1 kg ha-1),which is much higher than other countries such as the United States(30 kg ha-1),Korea(60 kg ha-1),Japan(80 kg ha-1),and others(Liuet al.,2014).Excessive fertilizer P application has led to an accumulation of soil P in arable farming systems,which can lead to potential water pollution.Transportation of P from surface runoffto rivers and lakes usually accelerates eutrophication and affects the utilization of water resources such as drinking water,fishery,and leisure(Foy and Withers,1995).Additionally,the continuous accumulation of P in soil could cause a reduction in soil quality(Hanselet al.,2017).Soil TP,a major indicator of soil fertility and quality,is generally used to represent the overall P levels in soil.As compared to other soil properties,TP is distributed heterogeneously in soil,where the degree of variation is a function of the study scale and/or its aspects(Liuet al.,2013).Therefore,understanding soil TPS at regional scales in China is important for reducing non-point source pollution,improving fertilizer P use efficiency,and optimizing P nutrient management.
It is essential to have detailed spatial and attribute information about soil for many applications related to land management(Lagacherieet al.,2007;Grunwaldet al.,2011).Over the past decade,quantitative soil mapping techniques have advanced dramatically in both development and application (Balkovičet al.,2013;Arrouayset al.,2021).A digital soil mapping (DSM) method utilizes quantitative models to relate observations of a soil type or property to spatially exhaustive environmental data,whereas a digitized conventional soil map(DCSM)gives information on how soil properties are distributed in space by describing representative soil profiles associated with map units(Kempenet al.,2012).Complex soil-forming processes might be difficult to quantify using environmental explanatory variables.However,these complex processes can be easily addressed in DCSM.Even though the complexity of TP in soil P cycles have prompted a lot of interest in soil TPS estimation,only a few studies have examined soil TPS at diverse spatial scales(Schoumanset al.,2007;Osborneet al.,2011;Thomaset al.,2016;Iticha and Takele,2018).Stevenson and Cole(1999) postulated that the TPS of global soil at 0-50 cm was 50 Pg.Smil(2000)pointed out that the TPS in 1.5×10³Mha of world arable soil was 5-6 Pg.At the national level,Linet al.(2009)used the data from 2 400 soil profiles and the 1:1 000 000(S100)soil mapping scale to estimate soil TPS,which was found to be about 3.5 Pg at 0-50 cm in China.Wanget al.(2008)suggested that soil TPS in China was 5.3 Pg based on the data from 2 473 soil profiles and the 1:4 000 000 soil mapping scale.Shangguanet al.(2013) used a dataset of 8 979 soil profiles and the S100 soil mapping scale and estimated soil TPS to be 4.5 Pg at 0-100 cm in China.At the regional level,Jia and Shao(2014)showed that the soil TP content in the surface layer(0-10 cm)was significantly higher than that in three subsurface layers(10-20,20-30,and 30-40 cm)in the Northern Loess Plateau of China.Additionally,Weiet al.(2021)also confirmed the findings through a study in the Yellow River estuary in China,indicating that the soil TP content in the surface layer(0-10 cm)was significantly higher than that in the other three layers(10-20,20-30,and 30-50 cm).
However,existing studies were often conducted using a single or a narrow range of scales of soil databases for a specific agricultural region,which largely ignored the impacts of using multiple mapping scales to estimate soil TPS.While this may not be a concern for regions with relatively homogeneous landscapes,the impact might be severe in areas with complex and slope-rich topography.Some studies indicated that the ability to represent soil properties differs significantly at different mapping scales(Zhaoet al.,2006).Spatial variability of soil properties is expressed by map delineations and map unit composition(Heuvelink,1998).The scale of the soil database not only directly affects the accuracy of the soil type and area information,but also affects the integration of soil attributes and spatial data(Zhaoet al.,2005).Additionally,changes in soil mapping scales may affect the number of profiles considered in the estimation process of soil TP density(TPD)(Zhaoet al.,2006),which would contribute to the overall variation in TPS among different soil mapping scales.Thus,the choice of soil mapping scales used in soil TPS estimation at the regional scale may lead to large uncertainties(Arnold,1995).Therefore,it is necessary to identify an appropriate soil mapping scale for minimizing the uncertainty in the estimation of TPS in a large region of slope-rich and complex topography.
To verify this hypothesis,the Fujian Province in China,which has mountainous and hilly regions,was selected as our study area.According to the statistics of the digital elevation model (DEM),87.16% of the region is in the hill-mountain areas,7.24% in the valley-basin areas,and 5.61%in the plain-platform areas(Longet al.,2018,2020).Then we used six soil databases at the scales of 1:50 000(S5),1:200 000(S20),1:500 000(S50),S100,1:4 000 000(S400),and 1:10 000 000 (S1000) to compare the uncertainties in soil TPS estimation among different mapping scales.These scales contain all the basic national soil mapping scales in China.The core objectives of this study were to i)quantify the effects of soil mapping scales on soil TPD and TPS estimation for a particular area and ii) identify appropriate soil mapping scales for soil TPD and TPS estimation in Fujian Province,a subtropical region of China covered with complex and slope-rich topography.
MATERIALS AND METHODS
Study area
Fujian Province has a total area of 12.4×10⁷ha and is located on the southeast coast of China(23°33′-28°20′N,115°50′-120°40′E).It is characterized by a typical subtropical climate and encompasses nine cities,including Nanping,Fuzhou,Longyan,Sanming,Quanzhou,Putian,Zhangzhou,Xiamen,and Ningde.According to the statistics of 66 meteorological stations in Fujian Province,the mean annual temperature(MAT),mean annual precipitation(MAP),and frost-free duration are 14.6-21.3°C,1 037-2 051 mm,and 300 d,respectively(Fig.S1,see Supplementary Material for Fig.S1).The study area is covered by large,slope-rich,and complex topography,with three typical landforms,namely valley-basin,plain-platform,and hill-mountain(Fig.S2,see Supplementary Material for Fig.S2).Previous publications provide more information on these three landforms(Longet al.,2018,2020).
According to an S5 digital soil map,red soil covers around 71%of the soil area in Fujian Province,making it the dominant soil type in this region(Fig.S3,see Supplementary Material for Fig.S3),whereas the paddy soil accounted for about 80% of the total cultivated land soil area in Fujian Province.According to the soil reference derived from the Genetic Soil Classification of China (GSCC) system,the GSCC nomenclature,as well as the World Reference Base Soil Taxonomy system,we obtained 12 soil groups in the study area,including coastal saline soil(Gleyic Solonchak),fluvo-aquic soil(Arenic Fluvisol),latosolic red soil(Ferric Acrisol),aeolian sandy soil(Gleyic Solonchak),mountain meadow soil(Leptic Cambisol),limestone soil(Eutric Cambisol),Entisol (Arenic Fluvisol),skeleton soil (Skeletic Regosol),purplish soil(Eutric Cambisol),red soil(Alumic Acrisol),paddy soil(Anthrosol),and yellow soil(Dystric Cambisol)(Huanget al.,2017).
Data source
Data from 3 082 soil profiles were obtained from the Second National Soil Census in China,which was the most extensive and comprehensive soil survey ever conducted in China between 1980 and 1999 (Zhaoet al.,2006;Zhiet al.,2014).Soil maps in China are compiled at six mapping scales for different administrative divisions,including county level of S5,district level of S20,province level of S50,and national levels of S100,S400,and S1000(Zhaoet al.,2006)(Table I).The soil maps at different spatial scales (i.e.,county,district,provincial,and national scales) from the Second National Soil Census in China in the 1980s are the most important data sources(Zhiet al.,2014).Additionally,changes in the mapping scale of soil datasets were associated with an increase(or decrease)in the number of profiles as they are linked to polygon spatial extent(Xuet al.,2013).We found that the soil polygons in the S5,S20,S50,S100,S400,and S1000 maps in Fujian Province were 247 969,46 408,15 282,6 343,440,and 345,respectively (Fig.S3).The corresponding number of soil profiles were 3 082,3 082,2 718,2 547,1 000,and 890,respectively(Table I).
The soil maps were established by ArcGIS 12.0.A laborintensive effort was taken to produce the six maps of the soil database,consuming almost 7 years and over 30 people to collect and digitize the historical document of soil maps and soil profiles.We developed the soil attributes at the six mapping scales by a pedological knowledge-based(PKB)method(Zhaoet al.,2006)(Fig.1),where the soil properties in each polygon included a wide range of information,such as the soil name,profile location,horizon thickness,TP content,organic matter (OM) content,clay content,bulk density(BD),pH,etc.The soil TP content in different databases was measured using the method of oxidation by sodium hydroxide(NaOH)pellets with the molybdate autoanalyzer after the samples were air-dried and the animal and plant residues were removed,crushed,and sieved through a 0.25-mm filter(Blakemoreet al.,1987).

Fig.1 Schematic diagram of the pedological knowledge-based method to link soil profiles with polygons(adopted from Zhao et al.,2006).A1-A3=profiles belonging to map unit A;B1 and B2=profiles belonging to map unit B;C1=profile belonging to map unit C.
Figure 1 shows the linking process using the PKB method.For profile C1 and two polygons of map unit C(one profile to multi-polygons),the soil property values of the profile will be linked to each of these two polygons of map unit C.For profiles B1 and B2,there is only one polygon of map unit B (multi-profile to one polygon).The mean soil property values of profiles B1 and B2 will be linked to the polygon B.For profiles such as A1,A2,and A3,there are two related polygons of map unit A (multi-profile to multi-polygons).A1 will be linked to the polygon of map unit A located in the top left corner of the map,and A3 will be linked to the polygon in the bottom right corner of the map(a simple point-in-polygon selection was included).Profile A2 will also be linked to the polygon at the top left corner according to the coexistence or adjacency in the distribution area based on the information recorded in the county,district,provincial,or national soil series.Thereby,the mean soil property values of profiles A1 and A2 will be linked to the polygon of map unit A located on the top left corner of the map.Using the PKB method,polygons with different spatial locations,but belonging to the same map unit,may obtain different soil property values(Zhaoet al.,2006).

TABLE IDifferences among various soil mapping scales in Fujian Province,China
Sample analysis
Soil TPD(kg m-3)was calculated with Eq.1(Linet al.,2009):
whereiis the order of polygons(i=1,2,3,...,n),andHi(cm),Bi(g cm-3),andOi(g kg-1)are the soil thickness,BD,and TP content in theith polygon,respectively,at 0-20 or 0-100 cm.
Soil TPS(kg)at different mapping scales was calculated using Eq.2:
whereSiis the distribution area(m2)of theith polygon.
The accuracy of P estimations using the six soil databases was analyzed using the most detailed digital soil map(S5)as a reference estimation(Zhiet al.,2014;Chenet al.,2022).The relative change(Y)of soil TPD,TPS,and area between different mapping scales was estimated according to Eq.3:
where ABS is the absolute function,Xois the soil TPD,TPS,or area based on the S5 map,andXsis the soil TPD,TPS,or area based on other databases,such as the S20,S50,S100,S400,and S1000 maps.
To quantify the influence of different mapping scales on the regional estimation of soil TPS,the Student’st-test was conducted to test the significance of differences between soil TPS estimated with S5 and those with other mapping scales using the SPSS statistical software(Leechet al.,2015).
Model verification
To consolidate the quantification and accuracy of the mapping scale,we simulated soil maps of soil TPD at different mapping scales(S5,S20,S50,S100,S400,and S1000)for upland soils(0-20 cm)in Minhou County located in the middle of Fuzhou,Fujian Province,China and compared them with the observations obtained from 400 upland soil sampling sites in the year of 1982,the Ministry of Agriculture of China(Fig.2).Two statistical metrics,the root mean square error(RMSE)(Loague and Green,1991)andr(Gollany and Elnaggar,2017),were used to measure the differences between observed and simulated soil TPD values at different mapping scales.The RMSE was defined as:

Fig.2 Verification points for consolidating the quantification and accuracy of mapping scales in Minhou County,Fuzhou City,Fujian Province,China.

Fig.3 Comparison between the observed and simulated soil total P density(TPD)based on soil databases at different mapping scales,1:50 000(S5),1:200 000(S20),1:500 000(S50),1:1 000 000(S100),1:4 000 000(S400),and 1:10 000 000(S1000),in Minhou County,Fuzhou City,Fujian Province,China.RMSE=root mean square error.
whereXoiandXsirepresent the observed and simulated soil TPD values for the samplei,respectively,andnrepresents the total 400 numbers in the sequence of the observed and simulated data pairs.Greaterrvalues and the smaller RMSE values suggest better agreement between the observed and simulated TPD values.
RESULTS AND DISCUSSION
Accuracy verification
Soil TPD maps for upland soils(0-20 cm)in Minhou County in 1982 were constructed based on the simulated data from the S5-S1000 soil databases.Figure 3 shows that S5-S1000 mapping scales simulated TPD for the 400 soil sampling sites,mostly varying from 0.01 to 0.40 kg m-3,which was close to their observational range of 0.01-0.23 kg m-3.In particular,S5,S50,and S100 showed good simulations with a significant (P=0.05) correlation to observations.Accordingly,all the RMSE values were low(0.038 87-0.125 19 kg m-3).
Effects of mapping scales on soil TP estimation
Our research indicated that the area-weighted average of the TP content in the surface soil(0-20 cm)were 0.68,0.67,0.71,0.70,0.68,and 0.71 g kg-1based on S5,S20,S50,S100,S400,and S1000 soil maps in Fujian Province,respectively (Fig.4).Correspondingly,the TP content at 0-100 cm soil depth was 0.51,0.49,0.54,0.53,0.51,and 0.52 g kg-1,respectively.Table II shows the TP content and area of different soil types at six mapping scales.Referring to S5,we found that the TP content and the area of different soil types also changed with changing mapping scales,which is related to generalization.Soil properties are spatially variable,which is expressed by how map units are defined and how the composition of map units varies with mapping scales.A soil map with a fine scale may merge soil types with small areas into their neighboring soil types(Heuvelink 1998;Zhaoet al.2006;Zhong and Xu 2011).As a result of this mapping scale effect,different soil types are allocated to different areas and attributes,causing the estimated soil TP to be substantially distorted.This enrichment of surface soil can be explained by P inputs,such as fertilizer,animal manure,or grazing(Wanget al.,2011).The TP content in the 0-20 and 0-100 cm soil layers in Fujian province is deficient,according to the standard issued by the Second National Soil Census in China.Compared with areas of similar climate zones and geography in China,soil TP content over the entire study area was higher than that in the adjacent Zhujiang County of Guangdong Province in southeastern China in 2009(335.8-1 190.1 mg kg-1at 0-10 cm)(Gaoet al.,2015),but lower than that in Yuanxishan County of Jiangsu Province(China) in 1982 (1.14 g kg-1at 0-20 cm) (Zhanget al.,2007).Some researchers discovered that low soil P content could limit ecosystem productivity in tropical and subtropical areas in China(Penget al.,2013).This phenomenon can be explained by:i)the tremendous changes in land use in recent years,which may be an important controlling factor for the low P content(MacDonaldet al.,2012),ii)the long-term rainfall increase in the wet season,increasing soil organic P accumulation,which in turn further reduces soil P availability for plant uptake in the tropical forests(Sunet al.,2020),and iii)microbial processes controlling P availability as affected by soil depth and properties(Achatet al.,2012).Moreover,90 724 ha of woodland in Southeast China,most of which were located in the tropical and subtropical regions,were converted into farmland between 1990 and 1995 (Chenget al.,2018).The high erosion rate of deforested lands may threaten soil productivity in this region(Lemenih,2004)and even cause a decrease in soil TP content(Penget al.,2013).
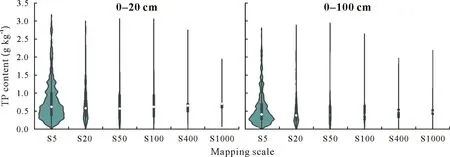
Fig.4 Soil total P(TP)contents at 0-20 and 0-100 cm soil depths based on soil databases at different mapping scales,1:50 000(S5),1:200 000(S20),1:500 000(S50),1:1 000 000(S100),1:4 000 000(S400),and 1:10 000 000(S1000),in Fujian Province,China.
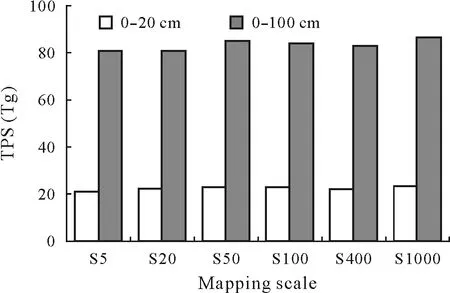
Fig.5 Soil total P storage(TPS)at 0-20 and 0-100 cm soil depths based on soil databases at different mapping scales,1:50 000 (S5),1:200 000(S20),1:500 000 (S50),1:1 000 000 (S100),1:4 000 000 (S400),and 1:10 000 000(S1000),in Fujian Province,China.
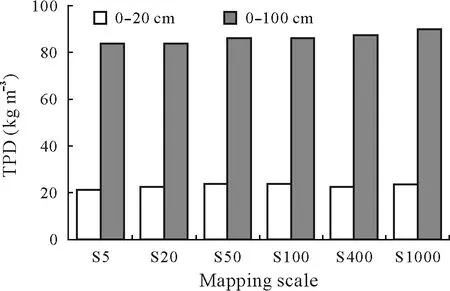
Fig.6 Soil total P density(TPD)at 0-20 and 0-100 cm soil depths based on soil databases at different mapping scales,1:50 000 (S5),1:200 000(S20),1:500 000 (S50),1:1 000 000 (S100),1:4 000 000 (S400),and 1:10 000 000(S1000),in Fujian Province,China.

TABLE IISoil total P(TP)contents at 0-20 and 0-100 cm soil depths and area for the whole region and different soil types based on soil databases at different mapping scales,1:50 000(S5),1:200 000(S20),1:500 000(S50),1:1 000 000(S100),1:4 000 000(S400),and 1:10 000 000(S1000),in Fujian Province,China
Effects of mapping scales on soil TPD and TPS estimation in the whole region
The S5 map was regarded as the most trustworthy and detailed soil database across a vast area of China(Zhiet al.,2014).The estimation based on the S5 map indicated that the TPS in the soil layers of 0-20 and 0-100 cm was 20.72 and 80.98 Tg,with the average TPD of 0.17 and 0.67 kg m-3,respectively,in Fujian Province.The TPD at 0-100 cm in Fujian Province was lower than the average TPD at the same soil depth in China(0.83 kg m-3)(Zhanget al.,2005)due to the high temperature and precipitation in subtropical regions which facilitate soil weathering and P loss through soil erosion(Neufeldtet al.,2000;Lehmannet al.,2001).
The spatial distribution of TPD in the S5 map exhibited large differences in surface soil,where the difference was over 170 times between the highest(0.85 kg m-3)and the lowest(0.005 kg m-3)values(Fig.S4,see Supplementary Material for Fig.S4).Furthermore,we evaluated the correlations between soil TPD and influential factors based on the S5 mapping scale,such as altitude(ALT),complete organic and nitrogenous fertilizers(COFand NF,respectively),soil OM,soil bulk density (BD),MAT,and MAP (Table III).The highest soil TPD (>0.4 kg m-3) was mainly distributed in the northern,western,and southwestern regions of Fujian Province,accounting for 6.17%of the total soil area in the study region(Fig.S4),which may be related to the low temperature and high elevation of the northwestern and western Fujian Province(Figs.S1 and S2).Accordingly,correlation analysis showed significant positive and negative relationships of TPD with ALT and MAT,respectively(Table III).In addition,the high ALT and low temperature can promote the accumulation of SOM(Klimeket al.,2020).Some studies also showed that OM can form an adhesive film on the surface of mineral particles to prevent mineral components from fixing P to increase soil P content(Finket al.,2016).This was consistent with the significant positive relationship between TPD and OM (Table III).Similarly,fertilizer application can lead to enhanced soil organic carbon(OC)content in subtropical regions by increasing biomass carbon and thus boosting carbon return to the soil(Mannaet al.,2005;Rudrappaet al.,2006;Jianget al.,2017),contributing to the positive relationship between TPD and NF.The lowest TPD(<0.1 kg m-3)was mainly distributed in the southeast of Fujian Province and accounted for 35.68%of the total area in the study region (Fig.S4).This may be due to the lower ALT,higher MAT,and abundant MAP in the southeastern region(Fig.S1),which may accelerate the decomposition of soil liable OM and adversely affect the accumulation of TP (Neufeldtet al.,2000;Lehmannet al.,2001).In addition to LAT and MAT,Table III shows a significant positive relationship between TPD and MAP.Furthermore,nitrogen fertilization application and pH are also beneficial to TPD,which could be obtained from the significant relationships between TPD and pH(Table III).Previous studies indicated that nitrogen fertilization synchronously causes soil acidification and soil OC accrual.Soil acidification increases soil OC content by decreasing its decomposition,acting as a linkage between nitrogen fertilization and soil OC accumulation(Hanet al.,2005;Zhanget al.,2020).
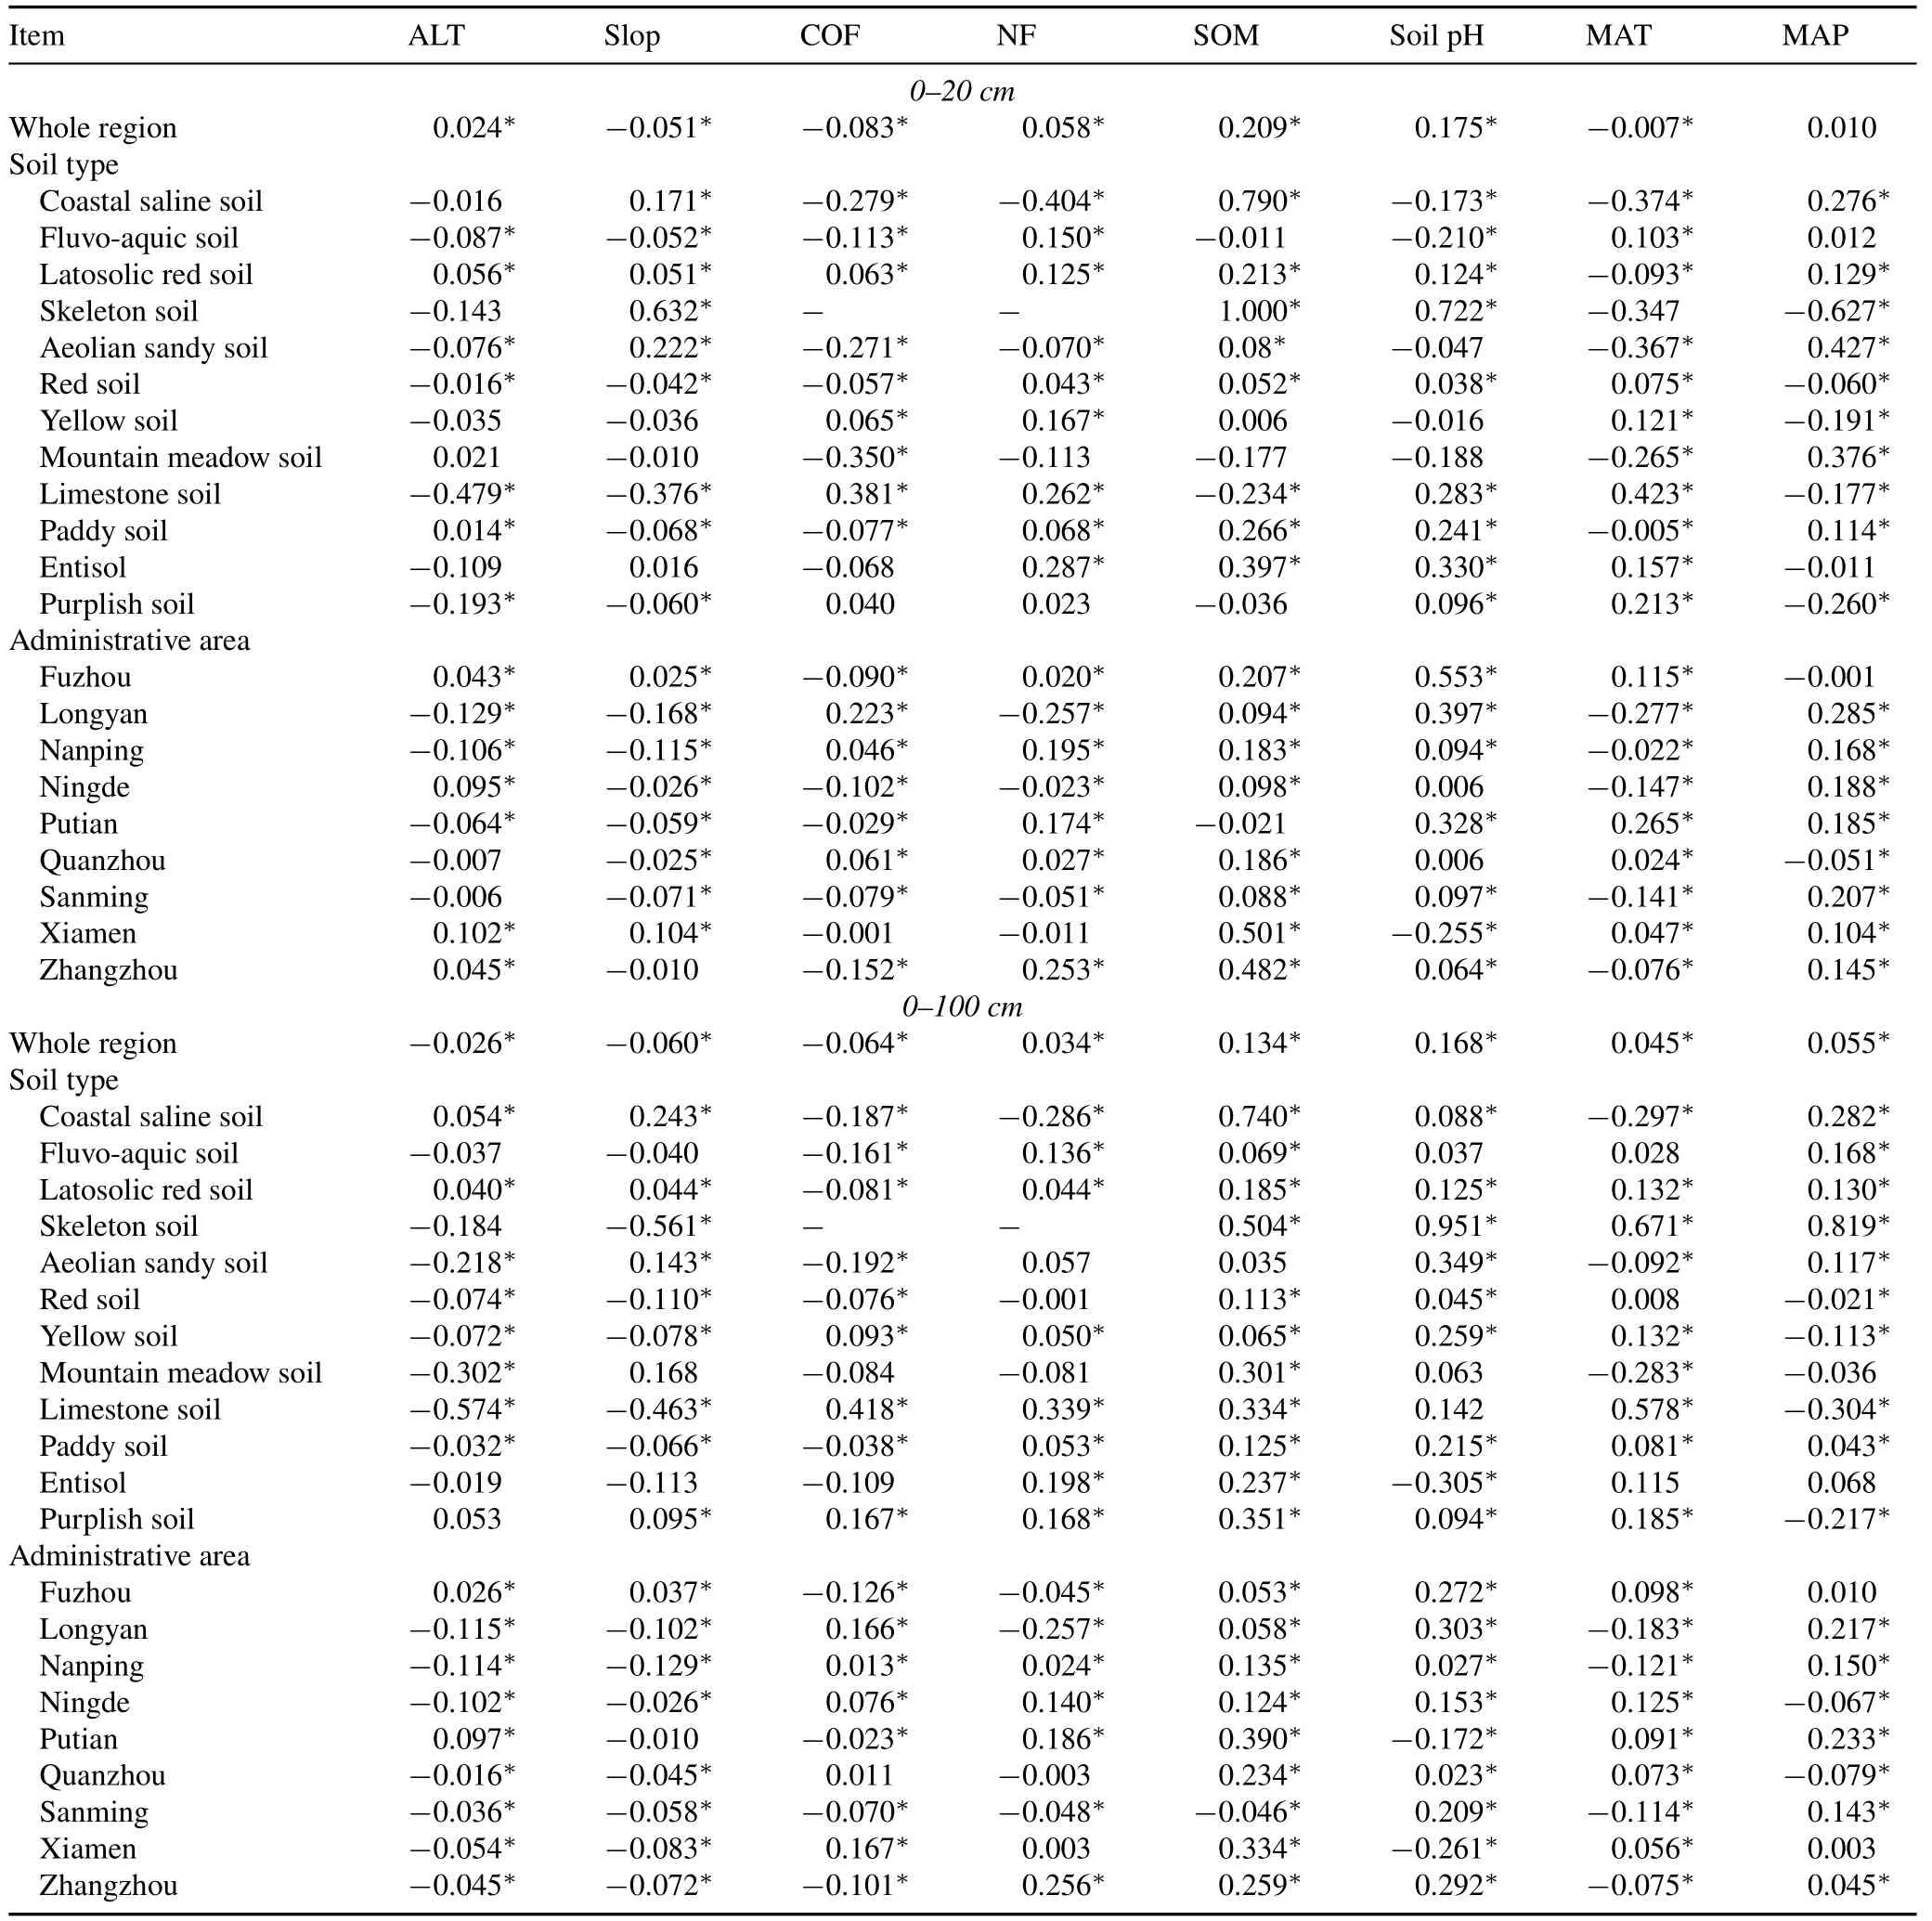
TABLE IIICorrelation coefficients between soil total P density and different influential factorsa) at 0-20 and 0-100 cm soil depths for the whole region,different soil types,and different administrative areas in Fujian Province,China
Similarly,the spatial distribution of TPD also exhibited large differences at 0-100 cm(Fig.S5,see Supplementary Material for Fig.S5),where the difference between the highest(0.94 kg m-3)and the lowest(0.008 kg m-3)values was over 118 times.The highest TPD(>2.0 kg m-3)was mainly distributed in the northern,western,and southwestern regions of Fujian Province and accounted for 3.78%of the total area in the study area.The lowest TPD(<0.5 kg m-3)was mainly distributed in the southeastern,eastern,and northeastern regions of Fujian Province and accounted for 49.14%of the total area in the study region.This is generally consistent with previous studies where soil TPD gradually decreased from the northern to the southern region of China(Zhanget al.,2005).

TABLE IVResults of the Student’s t-test for soil total P density estimation at 0-20 and 0-100 cm soil depths based on soil databases at different mapping scales,1:50 000(S5),1:200 000(S20),1:500 000(S50),1:1 000 000(S100),1:4 000 000(S400),and 1:10 000 000(S1000),in Fujian Province,China
Soil TPD and TPS estimation was affected by the spatial heterogeneity of soil P content represented in different maps(Figs.4-6).When the mapping scale was reduced from S5 to S1000,the spatial distributions of TPD at 0-20 and 0-100 cm were obviously different.The Student’st-test showed that the TPD estimation in the S5 map was significantly(P <0.001)different from those in other maps(Table IV).In addition,the S5 map was used as the reference for comparing the outcomes since it was the most detailed map.As a result,the relative deviations of S20,S50,S100,S400,and S1000 maps were 7.20%,9.33%,11.10%,7.81%,and 13.54%,respectively,at 0-20 cm and 0.14%,3.10%,3.60%,3.83%,and 7.29%,respectively,at 0-100 cm.The highest deviations of soil TPD and TPS were linked to the S1000 map.This is because the soil types with small polygons were merged into the larger polygons when the map downscaled(Table I).According to the statistics,eight soil groups of skeleton soil,coastal saline soil,fluvo-aquic soil,purplish soil,Entisol,mountain meadow soil,limestone soil,and aeolian sandy soil in the S5 map were merged into other soil groups in the S1000 map.Such a“scaling effect”caused the attribute and area variations of different soil types,especially the coarse soil maps missing relatively small soil patches containing low or high P content,which are sensitive to TPS estimation(Tables I and V).Some researchers also showed that the choice of soil mapping scales can lead to uncertainty in the estimation result,which is significantly influenced by the number of mapping units and the spatial distribution area at different mapping scales(Arnold,1995;Huanget al.,2014).Additionally,the number of soil profiles applied to derive P content differs significantly among various mapping scales(Table I).The number of soil profiles in the S5,S20,S50,S100,S400,and S1000 maps in Fujian Province is 3 082,3 082,2 718,2 547,1 000,and 890,respectively,which certainly can lead to a discrepancy in soil TPS estimation across the six mapping scales.Overall,we recommend S20 for soil TPS estimation in the Fujian Province of China due to the lower relative deviation.Moreover,allowing for data availability and estimation,S100 is also strongly recommended at the provincial level since it is the most detailed available soil database that covers all the locations in China(Yuet al.,2007).
Effects of mapping scales on TPD and TPS estimation in different soil types
The mapping scale impacts on soil TPD estimation exhibited substantial differences in the twelve soil types(Fig.S3).Soil TPD was influenced by soil attributes and area variations in different soil types and was accompanied by the reduction of mapping scales from S5 to S1000(Table VI).Usually,with digitizing original coarse scale maps,such as the S1000,S400,or S100 map,fewer soil polygons can be recognizable.Under such circumstances,dendritic,banded,and tiny spotted soil polygons are considered to be merged into nearby larger polygons,even into different soil types,when the map downscales(Hennings,2002;Häringet al.,2012).Such differences would be propagated into soil TPD estimate.The TPD of different soil types ranged from 0.09 to 0.31 kg m-3at the S5 mapping scale(Table VI).However,the spatial distribution of different soil types was obviously different when the mapping scales were reduced from S5 to S1000(Fig.4).The skeleton soil had the greatest influence on TPD estimation at different mapping scales,where the TPD in the S100 map is over 1.55 times that in the S5 map.Additionally,the TPS of the skeleton soil in the S100 map was over 3 341 times larger than that in the S5 map(Table VI).The area of the skeleton soil in the S100 map was much larger than that in the S5 map.This also demonstrates that soil database precision is important for governments or related units to implement agricultural management measures at a regional scale.Furthermore,although soil maps with coarse resolution could provide useful information for predicting the spatial distribution of TPD,these data might be too coarse for the basic management units to implement the government policies in the study area(Milleret al.,2015).
The red soil in the S5 map accounted for 71.40%of the total area in Fujian Province (Table VI).The TPS of red soils at 0-20 and 0-100 cm was increased from S5 to S1000 mapping scales (Table VI) due to the mergence of some polygons of the paddy soil,yellow soil,and latosolic red soil into the red soil,leading to the high relative deviations of S400 (11%) and S1000 (14%) in TPS estimation.The statistics showed that the red soil area in the S400 and S1000 maps reached 0.22 and 1.93 Mha,respectively,which were larger than that in the other maps.Many studies showed that the soil types with larger areas in larger-scale soil maps are likely to be major components of smaller-scale soil map units,while the soil types with small areas on larger-scale maps are merged into other map units during the map generalization process(Zhaoet al.,2006;Xuet al.,2013).

TABLE VRelative deviations of the areas estimated at the mapping scales of 1:200 000 (S20),1:500 000 (S50),1:1 000 000 (S100),1:4 000 000 (S400),and 1:10 000 000(S1000)compared to the area estimated at 1:50 000(S5)for the whole region and different soil types in Fujian Province,China
The paddy soil in the S5 map accounted for 14.93%of the total area in Fujian Province,which is the largest area in agricultural soil(Table VI).The TPS of paddy soil based on the S20,S50,and S1000 maps was much higher than that based on the S5 map(Table VI),because the small polygons of mountain meadow soil,fluvo-aquic soil,and coastal saline soil were merged into paddy soils with larger polygons as the map downscales.Statistics showed that the paddy soil areas in the S20,S50,and S100 maps reached 2.00,2.24,and 2.20 Mha,respectively,being higher than those in other maps.Furthermore,the limestone soil,coastal saline soil,and fluvo-aquic soil were not expressed in the S400 and S1000 maps(Table V).Many studies also showed that spatial patterns may change across scales,such that a variable may be homogeneous at one scale but heterogeneous at another(Xuet al.,2013).The geospatial soil data derived from the S400 and S1000 maps contain implicit generalizations that obscure the heterogeneities of soil properties.
Overall,the estimation based on different soil maps showed divergent TPS estimates in different soil types.When considering the accuracy of TPS estimation and the required work hindered by the development of detailed soil maps at the regional scale (e.g.,S5),it is necessary to identify an appropriate soil mapping scale as well as appropriate soil types.Therefore,in this study,the S5 map was used as a reference for comparison,where the appropriate mapping scale was S20 for the skeleton soil,aeolian sandy soil,paddy soil,and Entisol soil(Table VII).The most preferable mapping scale was S50 for the fluvo-aquic soil,latosolic red soil,red soil,and purplish soil,whereas S100 was the optimum mapping scale for the coastal saline soil,yellow soil,and mountain meadow soil(Table VII).
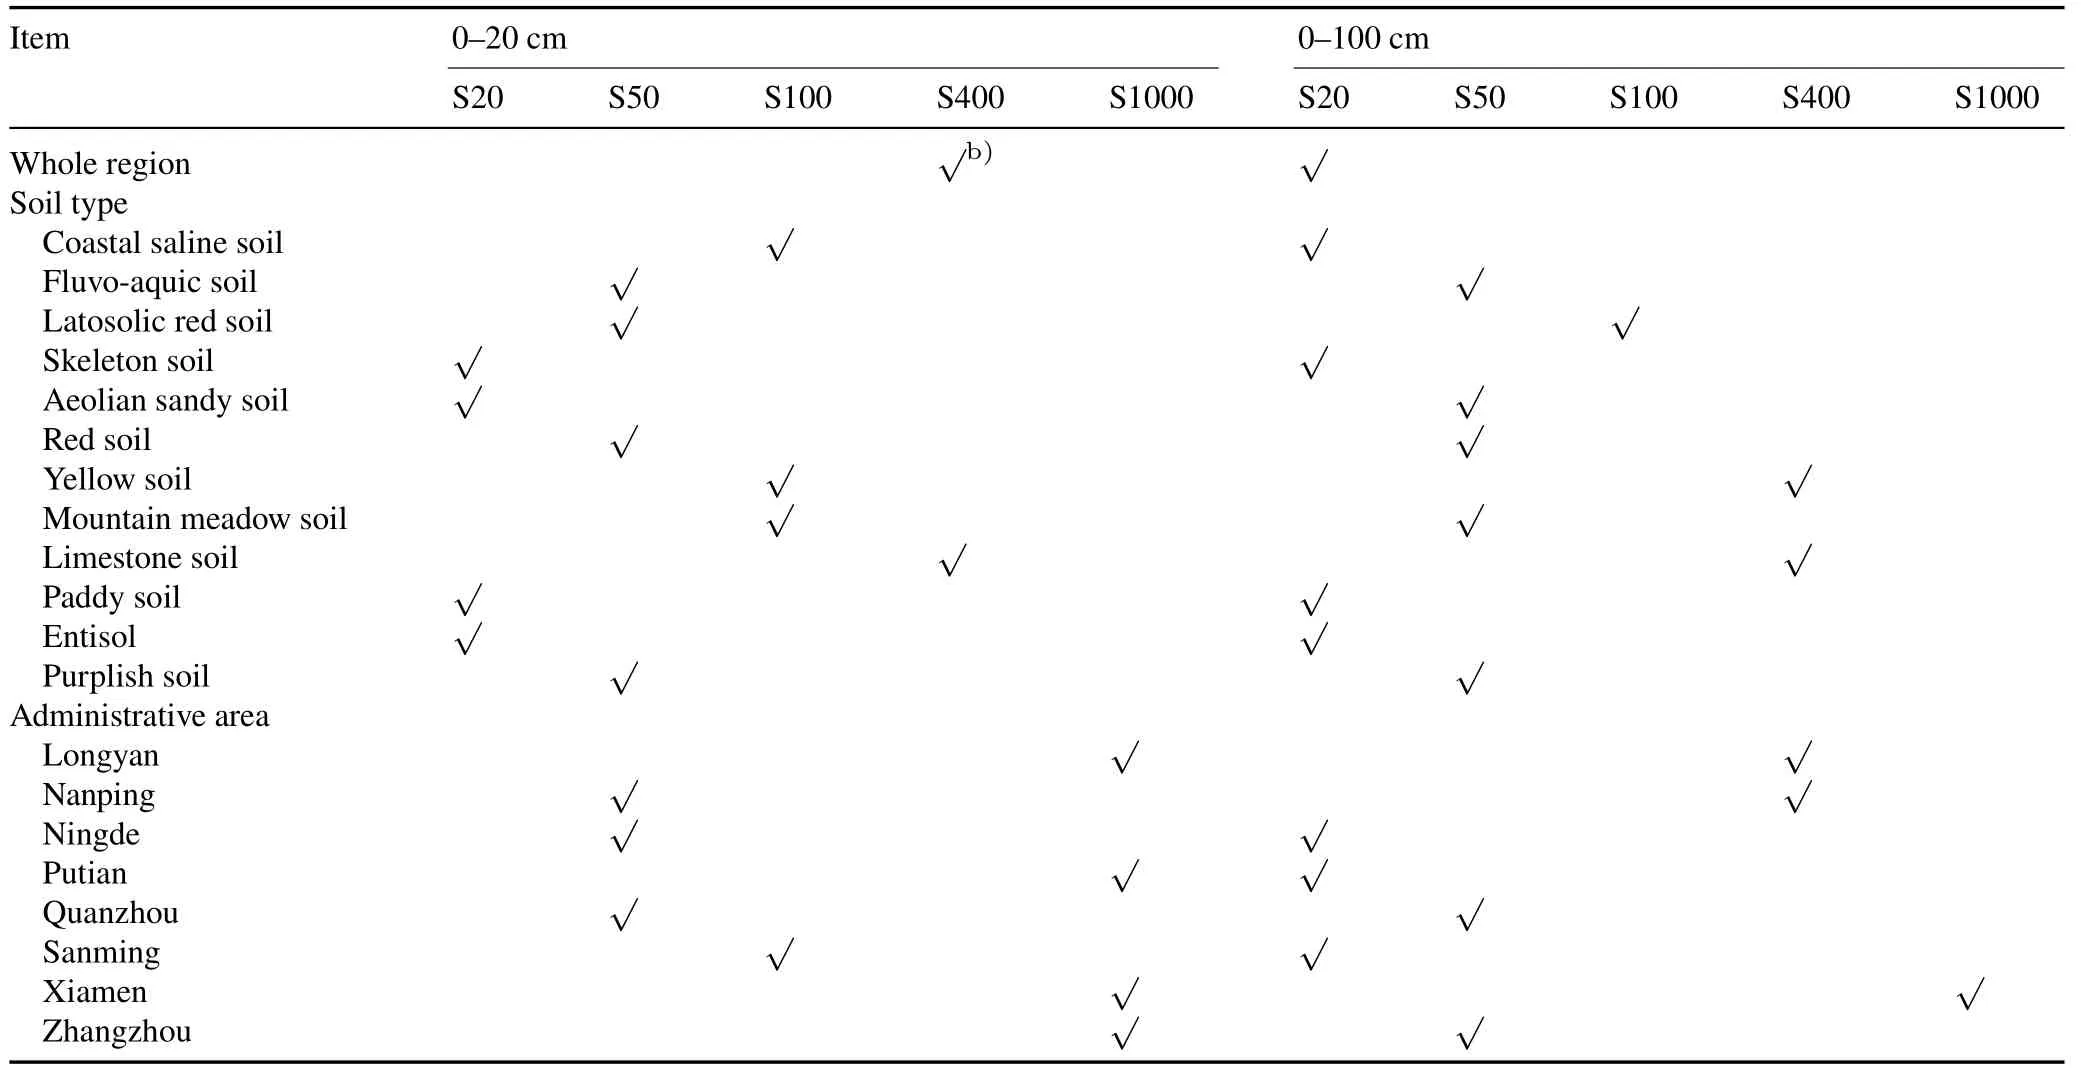
TABLE VIIMost appropriate mapping scalesa) for soil total P storage(TPS)estimation at 0-20 and 0-100 cm soil depths over the whole region,different soil types,and different administrative areas in Fujian Province,China
Effects of mapping scales on soil TPD and TPS estimation in different administrative regions
Based on statistics of the S5 map,the soil areas within different administrative regions,such as Fuzhou,Longyan,Nanping,Ningde,Putian,Quanzhou,Sanming,Xiamen,and Zhangzhou cities,were 1.19,1.89,2.61,1.28,0.37,1.09,2.27,0.14,and 1.25 Mha,respectively.The TPS and TPD estimations based on different mapping scales varied dramatically for the same administrative region.The highest TPD at 0-20 and 0-100 cm was found in the two cities of Sanming(0.22 and 0.76 kg m-3,respectively)and Longyan(0.21 and 0.82 kg m-3,respectively),since these two cities are close to the Wuyi Mountains with relatively low MAT and heavy rainfall.Table III shows the significant positive/negative relationships between TPD in Sanming and Longyan cities and MAP/MAT.As a result,low temperature and heavy rainfall are beneficial to soil OM accumulation in these two cities (Hobleyet al.,2016).It is commonly observed that soil TP content increases with increasing soil OM content (Caioneet al.,2021).The lowest soil TPD at 0-20 cm was observed in Ningde City (0.11 kg m-3)and at 0-100 cm in Putian City(0.41 kg m-3).The main reason for this outcome was that the P fertilizer application rates in Ningde and Putian cites were the lowest among all the administrative areas (Fujian Provincial Bureau of Statistics,2016),and Putian City possessed a relatively high temperature (20°C) and low rainfall (1 424 mm).Soil TPD in Ningde and Putian cities also had significant positive relationships with MAP(Table III).Some studies indicated that the rising air temperature leads to an increase in soil temperature,which stimulates soil TP decomposition(Wanget al.,2002).Additionally,low rainfall could result in a decrease in crop biomass and consequently result in a reduced return of crop residues to soil(Wuet al.,2011).
Soil TPD estimation in Ningde City was mostly impacted by the changes in mapping scales(Table VIII).The relative deviations at 0-20 and 0-100 cm were 71.70%and 69.85%in the S1000 map,respectively,which were the highest among all the mapping scales.The main reason was that Ningde City possessed 40 337 soil polygons and eight soil groups in the S5 map,whereas had just 24 soil polygons and three soil groups in the S100 map(Table VI).In general,finer soil maps(e.g.,the S5 map)would improve the accuracy of TPS and TPD estimation effectively(Zhiet al.,2014).This was because the soil database based on the S5 map provided relatively the most detailed spatial and attribute information of TPD,which would be the closest one for TPS estimation in Fujian Province.However,the S5 soil map of the provincial-level administrative region requires more labor force,material resources,and financial support to collect and analyze soil samples and edit them(Chenet al.,2018).Preparing such a detailed soil database for the entire Fujian Province in a short time would be impossible.In such a case,the S5 map should be replaced by other mapping scales,which can guarantee relatively high precision and cost less time and effort.To avoid unnecessary complications,it is necessary to choose the appropriate mapping scale rather than a more detailed one.Table VII proposes other appropriate mapping scales for different soil types and administrative areas in Fujian Province using the most detailed S5 as a reference.Results showed that in terms of the surface soil,S20 was suitable for the skeleton soil,aeolian sandy soil,paddy soil,and Entisol,S50 was appropriate for the fluvo-aquic soil,latosolic red soil,red soil,and purplish soil,S100 was suitable for the coastal saline soil,yellow soil,and mountain meadow soil,and S400 was appropriate for the whole Fujian Province and limestone soil.For the soil layer of 0-100 cm,relatively suitable mapping scales were S20 and S50.Specifically,S20 was suitable for the whole region,coastal saline soil,skeleton soil,paddy soil,and Entisol,and S50 was appropriate for the fluvo-aquic soil,aeolian sandy soil,red soil,mountain meadow soil,and purplish soil.For both soil layers of 0-20 and 0-100 cm,S1000 was too coarse to estimate TP,so we should refrain from relying on it.
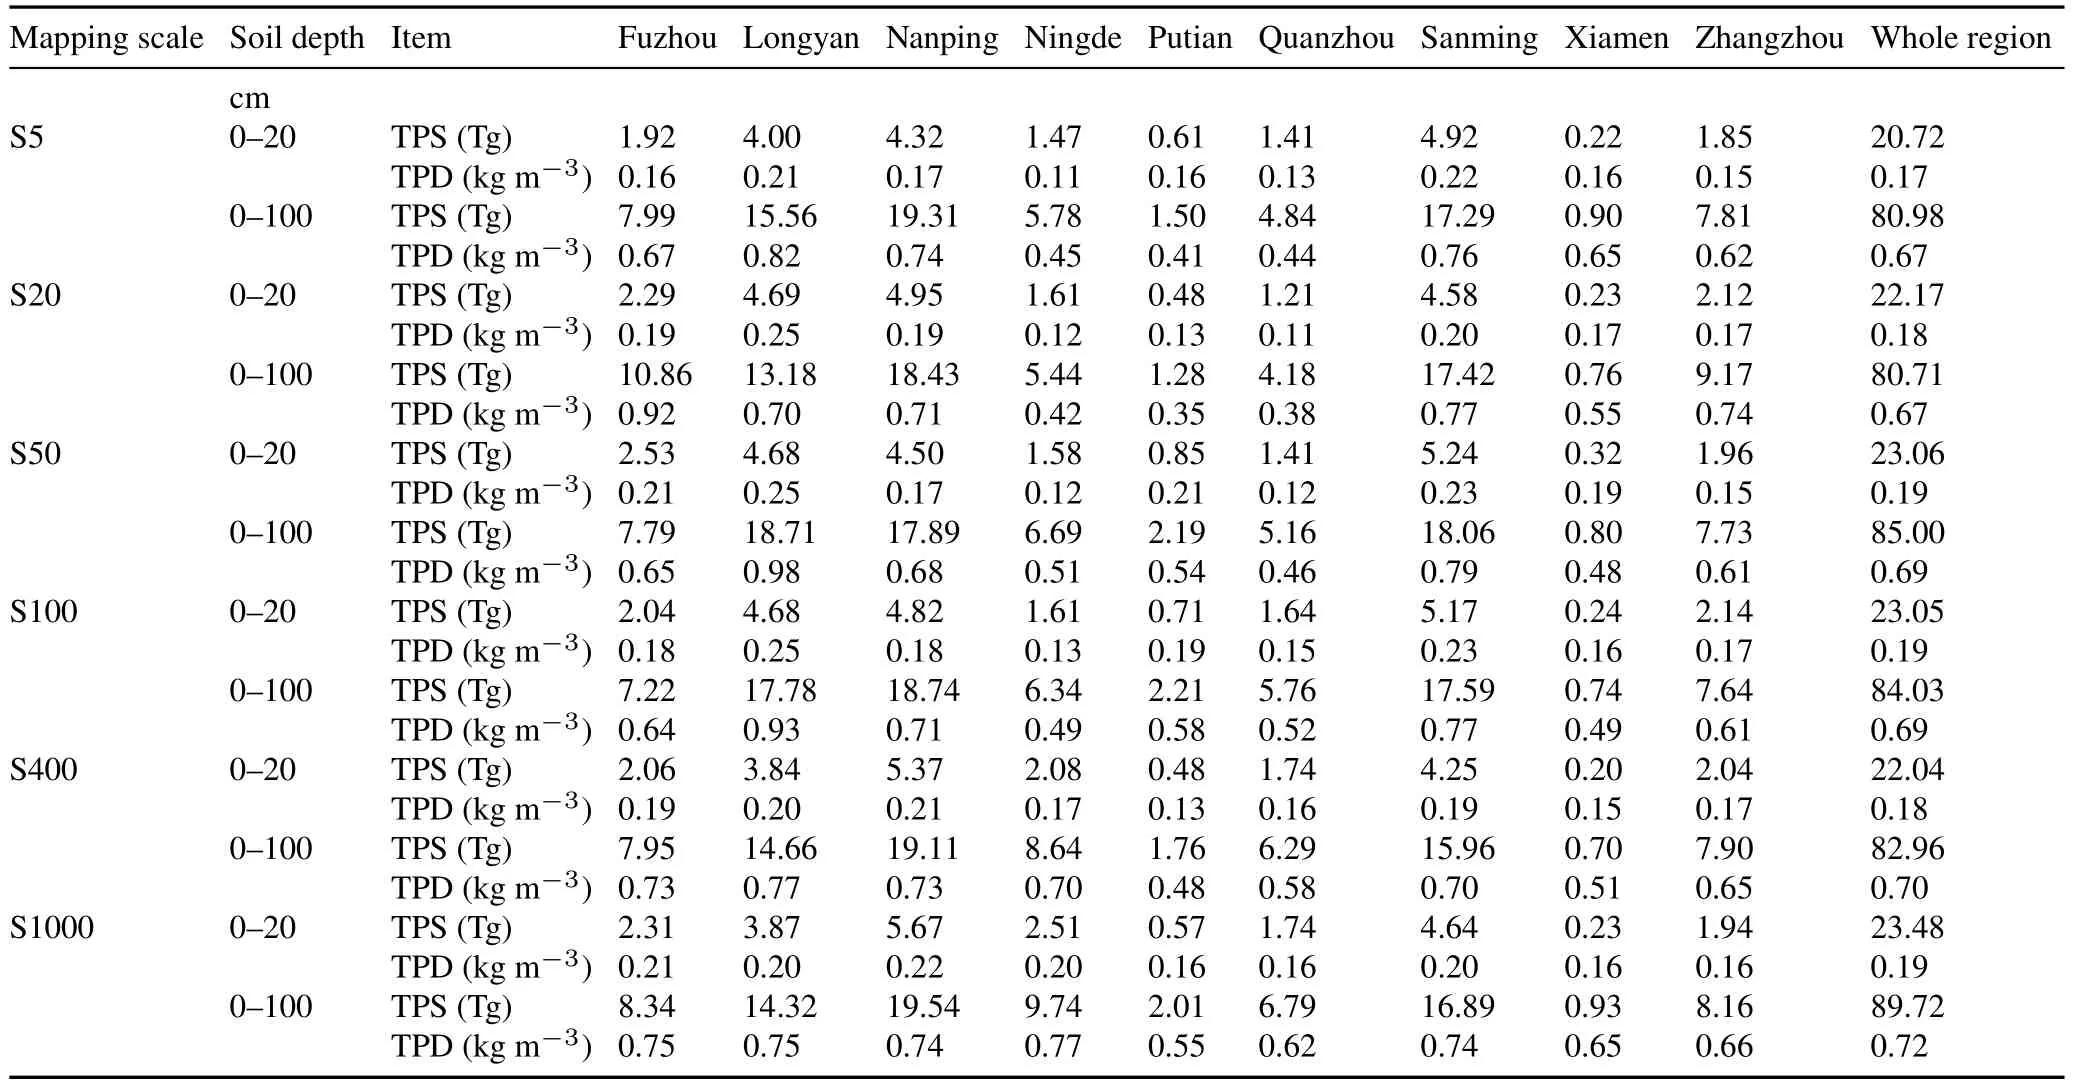
TABLE VIIISoil total P storage(TPS)and total P density(TPD)at 0-20 and 0-100 cm soil depths for different administrative areas based on soil databases at different mapping scales,1:50 000(S5),1:200 000(S20),1:500 000(S50),1:1 000 000(S100),1:4 000 000(S400),and 1:10 000 000(S1000),in Fujian Province,China
Considering the accuracy in estimating soil properties,developing detailed maps at regional scales(e.g.,S5)require a great deal of effort and money,which often dissuades scholars from adopting the most precise mapping scales.As with all other mentioned available soil mapping scales,S20 was the most popular for a variety of scientific research studies.Behrens and Scholten (2006) reviewed that more than 75% of German territory is covered by small-scale soil maps,including a particular interesting soil mapping scale at S20 since it was created through the joint effort of the federal states and the Federal Institute for Geosciences and Natural Resources,which comprises a standardized legend and an underlying soil database(Eckelmann,2005).Balamirzoevet al.(2008) also adopted the S20 mapping scale to analyze the ecological status of the soil cover of the Dagestan Republic and suggested measures for nature protection and rational land use.Yermolaev(2017)analyzed the soil erosion data at S20 of the Middle Volga region based on geoinformation mapping.Zhanget al.(2016)drove the DeNitrification-DeComposition model to quantify soil OC dynamics for the period between 2001 and 2019 at different mapping scales and found that the soil mapping scale of S20 provided the best accuracy in the Tai-Lake region(China)based on the most detailed soil map(S5)as a reference.In addition,the S20 soil mapping scale has been widely used at the provincial level by some domestic scholars as well.For example,Yuet al.(2008) used the S20 map and soil dataset to estimate soil OC storage and density in Henan Province,China;Shenet al.(2005)analyzed the distribution characteristics of soil fertility along rivers in Jiangsu Province(China)based on the S20 soil mapping scale.In our study,S20 was appropriate for paddy soil(Table VII),the dominant cultivated soil type in Fujian Province.Additionally,we discovered that S20 provided more soil information and an even richer soil environment than the smaller mapping scales,with higher accuracy from a time and labor perspective.Since almost all basic soil mapping scales of China were involved,we believe that the knowledge achieved in this study can be used in other regions of eastern China.It might provide new insight into the adoption of appropriate soil mapping scales for defining the implementation of government policies designed to optimize agricultural management practices.
Differences in multi-scale soil TP estimation results
Soil properties vary widely when using different mapping scales,which is mainly influenced by the generalization effect of soil maps in the process of mapping (Xuet al.,2013;Zhanget al.,2019).Hence,the generalization will affect the attribute information of the soil map spots.The results of the soil mapping generalization are mutual across distinct soil types,resulting in a decrease in the soil type and a change in the distribution area of each soil type.The area of upland soils at the mapping scales of S20,S50,S100,S400,and S1000 changed significantly with mapping downscaling(Fig.7).The areas of the coastal saline soil,fluvo-aquic soil,and skeletal soil changed the most,where they reached around 1.13% of the total area in the S5 map,but were merged into other soil types in the S400 and S1000 maps.In addition,the red and paddy soils,which were the most widely distributed soil types and accounted for 86.33%of the total soil area in the S5 map,showed a relative area deviation of 2.56%-22.33%and 10.69%-46.08%,respectively,with mapping scales downscaling from S20 to S1000 compared to S5.These changes had a significant impact on the estimation of TPD and TPS.
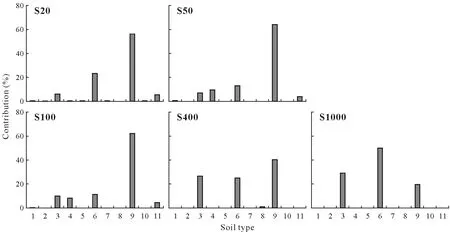
Fig.7 Contribution percentages of soil type areas to the changes in red soil areas with mapping scales downscaling from 1:200 000(S20)to 1:500 000(S50),1:1 000 000(S100),1:4 000 000(S400),and 1:10 000 000(S1000)compared to 1:50 000(S5),in Fujian Province,China.1=coastal saline soil;2=fluvo-aquic soil;3=latosolic red soil;4=skeletal soil;5=aeolian sandy soil;6=yellow soil;7=mountain meadow soil;8=limestone soil;9=paddy soil;10=Entisol;11=purplish soil.
The areas of the red soil,the main soil type in Fujian Province,were 7.08×104,6.80×104,6.86×104,7.03×104,and 5.39×10⁴ha,retaining on the smaller mapping scales with downscaling from S5 to S20,S50,S100,S400,and S1000,respectively.Therefore,there were 1.54×10⁴(S20),1.83×104(S50),1.76×104(S100),1.59×104,and 3.24×10⁴(S1000)ha red soil area converted into other soil types on their corresponding mapping scales.Meanwhile,the overall number of soil types decreased as mapping scales got coarser,so substantial variances emerge among various soil types within different soil maps(Zhaoet al.,2006).Some studies also indicated that soil area variations from modeling errors were related to soil mapping scales,particularly for soil area missing small soil types in coarse soil maps,which can lead to higher sensitivity to changes in soil properties(Xuet al.,2013).In addition,the number of soil profiles applied to derive soil properties had a great variation among different maps(Table I),which leads to a higher probability of having discrepancies in soil properties among these six mapping scales.
The generalization effect leads to uncertainty in the assignment process of mapping soil polygons at different mapping scales.The number of soil profiles was markedly affected by different soil mapping scales on the regional scales.The number of soil profiles corresponding to each map location was minimal because of the big number of polygons in soil maps having a small area,and the soil classification level according to its basic mapping unit was low(such as soil genus).However,when the scale of the soil map was small,the soil classification level corresponding to its basic mapping unit was high(such as soil group),and the number of soil polygons was small and the area was large(Fig.8).For example,the S400 and S1000 soil maps had only 440 and 345 soil polygons,respectively.The soil information uncertainty derived from the soil polygons was increased as a result of the rising profile spot numbers when connected using the PKB method.Therefore,the difference in soil TPD obtained from maps at different scales,coupled with changes in the area of each soil type map during the cartographic generalization process,significantly influenced the estimation of regional TPS.
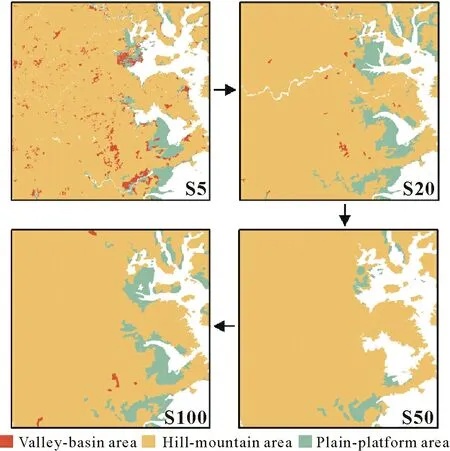
Fig.8 Spot generalization of soil in Fujian Province,China at mapping scales from 1:50 000 (S5) to 1:200 000 (S20),1:500 000 (S50),and 1:1 000 000(S100).
CONCLUSIONS AND FUTURE PERSPECTIVES
Soil TP estimation using different scales of soil map databases has significant implications for agricultural management and ecosystem protection.In this study,we analyzed the scale influence on soil TP using six soil mapping scales in a large region with slope-rich and complex topography.The soil map at the S5 mapping scale was used as a reference because it included detailed information.The results showed that the relative deviations of the regional soil TPS derived from the S20,S50,S100,S400,and S1000 maps were 7.00%,11.23%,11.25%,6.37%,and 13.32%,respectively,for the 0-20 cm soil depth.The corresponding relative deviations were 0.33%,4.96%,3.77%,2.45%,and 7.09%,respectively,for the 0-100 cm soil depth.The mapping scales of S400 and S1000 were improper for estimating soil TPD in Fujian Province due to the high relative deviations for different administrative areas(i.e.,0.56%-70.29%)and soil types(i.e.,11.29%-396.35%).The S20 mapping scale had the lowest relative deviation for the 0-20 cm soil(7.20%)and 0-100 cm soil(0.14%).We suggest using the soil mapping scale of S20 to replace S5 for soil TP estimation in Fujian Province due to the long processing time and the needed work hampered by the construction of comprehensive soil maps at the regional scale.Our findings provide a guideline for the selection of appropriate mapping scales to accurately estimate soil TP in a large region with slope-rich and complex topography.
We selected DCSM in our analysis because it includes information on the spatial distribution of a wide variety of soil properties inferred from representative soil profile descriptions associated with the map units.However,DSM often employs reproducible and easy-to-update quantitative models that relate field observations of soil type or property to spatially comprehensive environmental data (Kempenet al.,2012).As a result of the increased development and implementation of DSM,we are exploring using DSM to update our research in the next step.
ACKNOWLEDGEMENT
This work was supported by the National Natural Science Foundation of China(Nos.41971050 and 42207271),the Provincial Natural Science Foundation of Fujian,China(No.2022J05036),and the Open Project Program of the State Key Laboratory of Atmospheric Boundary Layer Physics and Atmospheric Chemistry,Institute of Atmospheric Physics,Chinese Academy of Sciences(No.LAPC-KF-2022-08).
SUPPLEMENTARY MATERIAL
Supplementary material for this article can be found in the online version.
CONTRIBUTION OFAUTHORS
Zhongxing Chen and Jing Li contribute equally to this work and share co-first authorship.
杂志排行
Pedosphere的其它文章
- Developing the new soil science-Advice for early-career soil scientists
- Biophotoelectrochemistry:An emerging frontier for channeling photoelectric effect into darkness zone of soils and sediments
- Balancing machine learning and artificial intelligence in soil science with human perspective and experience
- Soils in extraterrestrial space:Need for studies under microgravity
- Role of biochar in raising blue carbon stock capacity of salt marshes
- Long-term fertilizer nitrogen management-Soil health conundrum
