Incorporation of source contributions to improve the accuracy of soil heavy metal mapping using small sample sizes at a county scale
2024-03-07JieSONGXinWANGDongshengYUJiangangLIYanheZHAOSiweiWANGandLixiaMA
Jie SONG ,Xin WANG ,Dongsheng YU,* ,Jiangang LI ,Yanhe ZHAO ,Siwei WANG and Lixia MA
1State Key Laboratory of Soil and Sustainable Agriculture,Institute of Soil Science,Chinese Academy of Sciences,Nanjing 210008(China)
2Chinese Academy of Sciences University,Beijing 100049(China)
3Agricultural and Rural Bureau of Luanping County,Luanping 068250(China)
ABSTRACT Estimating heavy metal(HM)distribution with high precision is the key to effectively preventing Chinese medicinal plants from being polluted by the native soil.A total of 44 surface soil samples were gathered to detect the concentrations of eight HMs(As,Hg,Cu,Cr,Ni,Zn,Pb,and Cd)in the herb growing area of Luanping County,northeastern Hebei Province,China.An absolute principal component score-multiple linear regression(APCS-MLR)model was used to quantify pollution source contributions to soil HMs.Furthermore,the source contribution rates and environmental data of each sampling point were simultaneously incorporated into a stepwise linear regression model to identify the crucial indicators for predicting soil HM spatial distributions.Results showed that 88%of Cu,72%of Cr,and 72%of Ni came from natural sources;50%of Zn,49%of Pb,and 59%of Cd were mainly caused by agricultural activities;and 44%of As and 56%of Hg originated from industrial activities.When three-type(natural,agricultural,and industrial)source contribution rates and environmental data were simultaneously incorporated into the stepwise linear regression model,the fitting accuracy was significantly improved and the model could explain 31%-86%of the total variance in soil HM concentrations.This study introduced three-type source contributions of each sampling point based on APCS-MLR analysis as new covariates to improve soil HM estimation precision,thus providing a new approach for predicting the spatial distribution of HMs using small sample sizes at the county scale.
Key Words:absolute principal component score-multiple linear regression,Chinese herbal medicine,influencing factors,spatial distribution,stepwise multiple regression
INTRODUCTION
Chinese herbal medicine(CHM)is an important component of traditional Chinese medicine,and the health and safety of medicinal plant have attracted high public attention due to its advantages in the treatment of certain diseases(Shamet al.,2014;Zuoet al.,2020).However,heavy metals(HMs),as potentially harmful soil contaminants,are usually not leached with water,nor degraded by microorganisms,medicinal plants can easily accumulate them from the native soil(Wanget al.,2016;Menget al.,2022).Therefore,in order to prevent HM contamination in soil and their accumulation in CHM,it is essential to accurately assess the spatial distribution of soil HMs in the growing area of CHM.
Conventional methods for field sampling and laboratory analysis are time-consuming and labor-intensive,and many sampling points are required to create accurate HM maps(Johnet al.,2021).Therefore,model robustness with small sample size is necessary to improve the prediction accuracy of HMs.Many reports have shown that accuracy could be improved by incorporating environmental auxiliary variables that influence HM accumulation(Caoet al.,2017;Songet al.,2019).But so far,only a limited number of factors affecting soil HM enrichment have been investigated (Yanget al.,2021).Thus,mining new auxiliary variables closely related to HM content is crucial to improve estimation accuracy with small sample size.
The spatial heterogeneity of soil HMs could be attributed to diverse pollution sources and contaminant spatial heterogeneity(Alamet al.,2015;Liuet al.,2016).In previous studies,various methods have been adopted to identify and apportion HM sources,such as principal component analysis (PCA),cluster analysis (CA),UNMIX,and positive matrix factorization(PMF)models(Anamanet al.,2022;Chenet al.,2022).Among these methods,absolute principal component score-multiple linear regression(APCS-MLR),on the basis of PCA and MLR analysis,could quantify the contribution rate(%)of possible HM pollution sources(Jinet al.,2019)and has the advantage of convenience and easy operation.Thus,it has been successfully applied to the source apportionment of HM in soil and groundwater(Menget al.,2018;Zhanget al.,2021;Yuet al.,2022).Many studies have focused on identifying contamination source types or quantifying source contribution to HM spatial accumulation,but few have on the correlation between HM spatial distribution pattern and the corresponding contribution rates of each source.Specifically,it is unknown whether incorporating pollution source contribution rates as new variables improves HM prediction accuracy in a specific area.
Apart from pollution source contribution rates,many factors can affect the concentrations of soil HMs,and they are mainly divided into natural and anthropic variables(Luet al.,2012).Natural factors usually refer to topography(i.e.,elevation,slope),climate(i.e.,precipitation,temperature),and soil properties(i.e.,pH,CEC,soil type).Previous studies have demonstrated that natural factors are closely correlated with HM concentrations(Feiet al.,2019;Wanget al.,2020).Human factors generated from agricultural and industrial inputs,such as wastewater irrigation,excessive fertilizer application,and fossil fuel combustion(Chen Tet al.,2016;Jianget al.,2017;Wanget al.,2019),could easily result in strong spatial variability of soil HMs,and pose a threat to the surrounding environment.For example,Linet al.(2018)found that there was a significant connection between soil HM contamination and intensive industrial practices in the Pearl River Delta of China.
Meanwhile,the usefulness of influencing factors and their relationship with soil HMs need to be assessed before soil mapping.Stepwise regression analysis is a MLR approach in which the contributions of all independent variables to the target variable are compared(Zenget al.,2022),and then the optimal variable set affecting HM concentration is selected.For example,Chenet al.(2020)reported that bioavailable As and amorphous iron oxides were the two most critical factors leading to As accumulation in wheat grain using stepwise regression analysis,which explained 82% of As spatial variation.Lüet al.(2013) explored factors controlling HM variation at different spatial scales through stepwise regression analysis.We simultaneously incorporated source contribution rates and environmental variables into a stepwise regression model to determine whether pollution source contribution rates could be identified as key factors and further improve the accuracy of heavy metal mapping.
Luanping County is the main producing area of CHMs and has the most abundant medicinal plant resources because of its unique geographical environment.To ensure CHM growth safety,it is necessary to investigate and map soil HM concentrations and identify the potential influencing factors driving HM accumulation.Based on an investigation of sampling points covering all county soil types,our main research objectives were i)to quantify the main sources of soil HMs in the study region through the APCS-MLR model,ii)to explore the effects of simultaneously incorporating source contributions and environmental variables into a stepwise regression model on HM prediction accuracy,and iii)to map the HM concentration spatial distribution for CHM growth safety.Our results could provide a new practical reference for soil HM mapping with small sample sizes at the county scale.
MATERIALS AND METHODS
Studyarea
Luanping County (40°39′21′′-41°12′53′′N,116°40′15′′-117°46′03′′E) is located in the northeastern Hebei Province of China.Covering 3 213 km2,the county has a typical continental monsoon climate with an average annual temperature of 7.7°C and an average annual rainfall of 351.1 mm.Land use is dominated by forests,cultivated land,and meadows and the major soil types are brown,cinnamon,and meadow soils,according to Genetic Soil Classification of China(Shiet al.,2018).Chinese herbal medicine plants are famous all over the country,mainly includingScutellariae,Shegan,Bupleurum,Atractylodes,andSchisandra.
Sampling and processing
In autumn 2020,44 topsoil(0-20 cm)samples were collected from the herbal cultivation area in Luanping County.To ensure representativeness,selection of soil sampling points was based on a consideration of soil types,topography,and the spatial distribution of herbal medicine planting in the county.Sampling points covered all soil types in the study area,with 26,15,and 3 points distributed in cinnamon,meadow,and brown soils,respectively.Five subsamples were randomly collected within a 5-m radius of sampling points and were fully mixed into a representative sample using the quartering method.The geographical location of the center of each sample was recorded using a hand-held global positioning system (GPS) and depicted by a black cross in Fig.1.All collected soil samples were naturally air-dried and protected from direct sunlight,while stones and plant and animal residues were manually removed.Then,samples were ground and sieved with 2-,0.25-,and 0.15-mm sieves for determinations of soil texture,chemical properties,and HM concentrations,respectively.
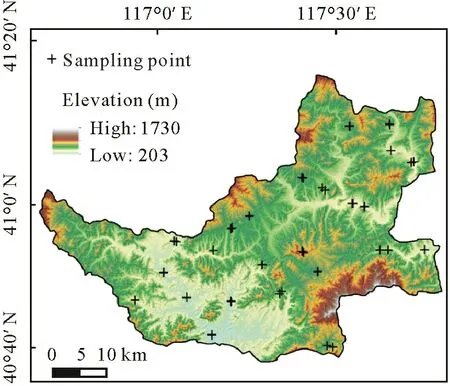
Fig.1 Distribution of soil sampling points in Luanping County in the northeastern Hebei Province of China.
Soil pH was measured at a soil:water ratio of 1:2.5(weight:volume) with an electronic pH meter (PHS-3C,Shanghai,China).Soil organic matter(SOM)was determined by the K2Cr2O7-H2SO4oxidation method (Nelson and Sommers,1996),and cation exchange capacity(CEC)was measured by 1 mol L-1ammonium acetate(pH 7)followed by a second extraction with KCl solution.Total N(TN)was analyzed using the Kjeldahl method with the H2SO4-H2O2digestion(Lu,2000).Total P(TP)and K(TK)concentrations were analyzed using the HClO4-H2SO4and HF-HClO4flame photometric methods,respectively(Lu,2000).Particle size content (clay,silt,and sand),as a percentage,was determined by the sieve-pipette method conforming to the USDA classification system(Bittelliet al.,2022).
Soil samples were sieved by the 0.15-mm mesh to detect soil HM concentrations.Soil Cu,Cr,Ni,Zn,Pb,and Cd concentrations were analyzed using HNO3-HF-HClO4digestion followed by the inductively coupled plasma optical emission spectrometry(ICP-OES)method.Total As and Hg were measured by atomic fluorescence spectroscopy(AFS)after aqua regia digestion(HNO3-HCl),with lower detection limits of 0.01 and 0.002 mg kg-1,respectively.Blank and parallel samples and the national standard soil samples(GBW07349)were used to ensure experiment accuracy.The recovery rates of eight HMs were within the allowable range(90%-105%)and the relative standard deviation of the duplicate samples was within 5%.
Environmental data
As soil HM spatial variation is mainly influenced by natural geology and human activities (Caoet al.,2017),our environmental data consisted of natural and anthropic variables.Natural factors include geographic information,climate data,and soil physicochemical properties such as pH,SOM,CEC,TN,TP,TK,and texture(clay,silt,sand).Geographic information data includes longitude and latitude provided by the Geospatial Data Cloud website,Computer Network Information Center,Chinese Academy of Sciences(http://www.gscloud.cn)(Wanget al.,2021).Climate variable data (temperature and precipitation) comprising 2011-2015 average was downloaded from the Resources and Environment Science and Data Centre,Chinese Academy of Sciences(http://www.resdc.cn).Anthropogenic factors include the nearest distance from each sampling point to the residential area(D_toRes),river(D_toRiver)and mine(D_toMine),which were calculated based on the land-use map acquired from the Chengde Municipal Bureau of Agriculture,China(http://nyncj.chengde.gov.cn/).In addition,polluting enterprises in the study area and their coordinates were available from the Chengde Ecology and Environmental Bureau,China(http://shj.chengde.gov.cn/),and the nearest distance to polluting enterprises (D_toPollution)was calculated.Correlations between soil heavy metals and environmental factors are shown in Table SI(see Supplementary Material for Table SI).
APCS-MLR model
The APCS-MLR receptor model could quantitatively determine the contribution of each pollution source(Jainet al.,2017;Maet al.,2018).The basic principle of APCS-MLR is to convert principal component scores(PCSs)achieved from factor analysis into absolute principal component scores(APCSs) and to further construct a MLR model between soil HM concentration and APCS.Meanwhile,regression coefficients are utilized to calculate the source contribution corresponding to each principal component(PC).It can be conducted in the following three steps.(i) A sample with a contamination zero point concentration is introduced and calculated as
whereCirepresents the concentration of HMi,bi0is the intercept of the regression of HMi,aijindicates the regression coefficient of HMifrom source factorj,and APCSjdenotes the absolute principal component score of source factorj(Jinet al.,2019;Zhanget al.,2021).Then,the source contribution rate to HMs at each sampling point(CR)was calculated using the following formula:
whereaij×APCSjis the contribution rate of source factorjtoCi,and the constant termbi0is considered as the contribution of the unidentified source term.Moreover,taking Cu as an example,the contribution rate of source 1 at each sampling point was denoted as Cu_S1.Here,sources 1,2 and 3 may represent natural,agricultural,and industrial sources,respectively.
Stepwise multiple regression analysis
The stepwise multiple regression method was utilized to add or remove variables from the model in controlled steps to determine the crucial factors affecting soil HMs(Yamashitaet al.,2007).There are three model-selection approaches,including forwards selection,backwards elimination,and bidirectional elimination.We adopted a bidirectional elimination model to determine dominant factors significantly associated with soil HM concentrations,and these variables were generated using theFstatistic(entry for the probability ofF=0.05;elimination for the probability ofF=0.1).Moreover,multicollinearity is detected by the variance inflation factor(VIF),and if it is>10,high multicollinearity is present(Kutneret al.,2004).Thus,all variables with VIF>10 were excluded.
In this study,we prepared two sets of factors as inputs:one group included the environmental variables and source contribution rates of each sampling point,while the other contained only environmental variables.The influencing predictors were obtained based on the stepwise regression and the results during modelling are shown in Tables SII and SIII (see Supplementary Material for Tables SII and SIII).Given the small sample size in this study,the accuracy was assessed using“leave one-out”cross-validation in terms of the determination coefficient(R2)and root mean square error(RMSE).
Statistical analysis and mapping
Correlation analysis,PCA,APCS-MLR,and stepwise multiple regression analysis were performed using SPSS 24.0 software.The spatial distribution maps of soil properties and source contribution rates were obtained by ordinary kriging interpolation of sampling points,and the accuracy was assessed using“leave-one-out”cross-validation.The raster calculator was further used to map soil HM spatial distribution using ArcMap 10.8(ESRI Inc.,USA)software.
RESULTS AND DISCUSSION
Descriptive statistics ofsoil HMs
The descriptive statistics of eight HM concentrations are presented in Table I.Except for Cu and Hg,the average concentrations of all HMs were lower than their corresponding background values(BVs)of Hebei Province(CNEMC,1990).The coefficient of variation (CV) is often utilized to assess human factor interference on soil HM enrichment(Gallardo and Paramá,2007).According to relevant studies on the grades of CVs (Chaiet al.,2021b),they can be classified into low (CVs<16%),moderate (16%<CVs<36%),and high variability(CVs>36%).The CV of Hg concentration(120.75%)was the highest,indicating that it may result from anthropogenic inputs.The CV of Cd concentration(16.01%)was the lowest,indicating that it was probably affected by the soil environmental background or natural processes.The CVs of Cu,Cr,Ni,Zn,Pb and As concentrations were moderate.Additionally,all HM concentrations did not surpass the corresponding risk screening values(MEE and SAMSA,2018),suggesting that their concentrations in the study area were within safe levels for planting herbal medicine.
Source apportionment ofsoil HMs
Pearson correlation analysis results among the eight HMs are presented in Table II.The concentrations of Cu,Cr,Ni,and Zn showed a significantly positive correlation with each other(P <0.01),suggesting that all four elements had a similar origin(Lianget al.,2017).Meanwhile,Zn was strongly correlated with Pb(P <0.01),and it is assumed that Zn may be attributed to a mixed source.Arsenic was significantly positively related to Cu and Ni,so they may have the same source.There were no obvious relationships identified between Cd and any of the other metals and it is speculated that Cd may have a different source(Lianget al.,2017).

TABLE ISummary statistics of soil heavy metal concentrationsa) in the study area
When the test coefficient of Kaiser-Meyer-Olkin(KMO)is>0.5 and thePlevel of Bartlett’s test is<0.05,data are applicable to PCA(Zhaoet al.,2019).The KMO(0.613)and Bartlett’s sphericity test(P <0.01)results suggested that PCA could be effectively utilized to identify possible soil HM sources in this region(Sharma and Sarma,2018).Three PCs in total with eigenvalues higher than 1.0 (Aminiyanet al.,2018) were extracted and explained 78.38% of the total variance(Table III).Principal component 1 explained 45.94% of the total variance and weighed heavily on Cu,Cr,Ni,Zn,Pb,As,and Hg.Among them,Cu,Cr,and Ni had the highest correlation coefficients(Table II),implying that they most likely come from the same contamination source(Lianget al.,2017).Principal component 2 explained 19.63%of the total variance and had a larger load on Zn,Pb,and Cd.Principal component 3 explained 12.81%of the total variance and weighed heavily on Hg and As(Table III).
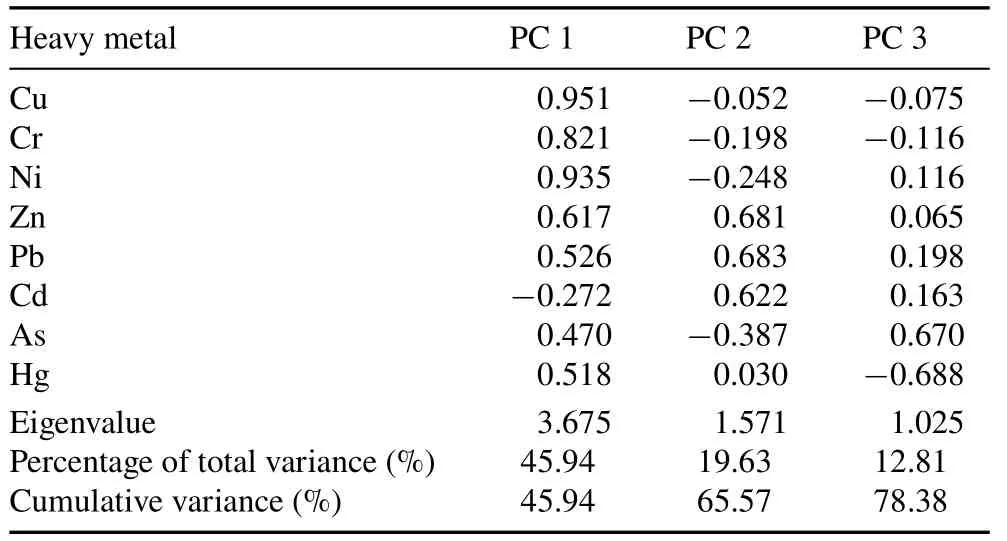
TABLE IIIPrincipal component(PC)factor scores for soil heavy metals in the study area
Furthermore,the APCS-MLR model was performed to quantify HM source contributions.Except for Cd,R-squared values for the other HMs were acceptable withR2>0.7,suggesting appropriate fitting results between predicted and measured concentrations using the APCS-MLR model(Fanget al.,2016).Results of HM source contribution are presented in Fig.2.
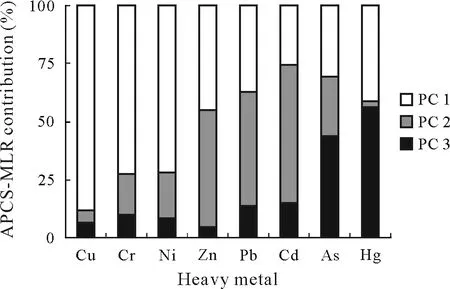
Fig.2 Heavy metal source contributions to the soils of the study area based on the absolute principal component score-multiple linear regression(APCS-MLR)model.PC 1,PC 2,and PC 3=principal component 1,2,and 3,respectively.
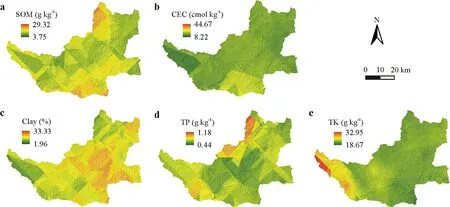
Fig.3 Spatial distributions of soil organic matter(SOM,a),cation exchange capacity(CEC,b),clay(c),total P(TP,d),and total K(TK,e)mapped using the ordinary kriging method in the study area.
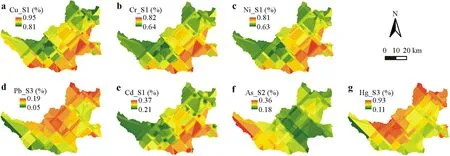
Fig.4 Spatial distributions of source(S1,S2,or S3)contribution rates to heavy metals(Cu,Cr,Ni,Cd,As,Pb,or Hg)mapped using the absolute principal component score-multiple linear regression(APCS-MLR)model in the study area:Cu_S1(a),Cr_S1(b),Ni_S1(c),Pb_S3(d),Cd_S1(e),As_S2(f),and Hg_S3(g).See Table IV for variable descriptions
Overall,the results derived from the APCS-MLR model were in agreement with PCA.Principal component 1 was Cu,Cr,Ni,Zn,Pb,As,and Hg with contribution rates of 88%,72%,72%,45%,37%,31%,and 41%,respectively.It is commonly believed that HMs related to soil parent materials are usually low-pollution elements(Chaiet al.,2021a).The mean values of Cr and Ni were lower than their BVs.Combined with related studies and field investigation,Cr and Ni are both siderophile elements and their concentrations are closely related to parent materials formed by the mineralization of iron ore-bearing basic rocks in the study area(Sunet al.,2021).For Cu,the high value is attributed to lithogenic components associated with parent materials(Sun H Yet al.,2019).Moreover,the significant correlations between Cu,Cr,and Ni concentrations suggested that these elements have the same origin.Many studies have confirmed that soil Cu,Cr,and Ni are closely associated with the parent materials(Caiet al.,2012;Liuet al.,2020).In addition,Zn and Pb concentrations were significantly related to Cu,indicating that these elements have the same source(Table II).Meanwhile,Zn and Pb concentrations of some sampling points were lower than the corresponding BVs,implying that the partial contribution to these two metals was affected by natural sources(Chaiet al.,2021a).Therefore,PC 1 represents the soil parent material,that is,the natural source.
Principal component 2 was mainly composed of Zn,Pb,and Cd,and their contribution rates were 50%,49%,and 59%,respectively.Concentrations of Zn and Pb of some samples exceeded their soil BVs,implying that these elements were affected by human practice (Chaiet al.,2021a).Houet al.(2017)reported that P fertilizer has been identified as a major source of Pb and Zn.Previous studies have demonstrated that large amounts of chemical fertilizer and pesticide inputs to agricultural production have led to Cd accumulation in soil(Shiet al.,2019;Sun Let al.,2019;Zhuet al.,2020).Koorimannilet al.(2010)also found that application of excessive chemical fertilizers would lead to Cd enrichment inBacopa monnieri(L.)Pennell.Therefore,PC 2 is likely to represent agricultural activities.
Principal component 3 reflects As and Hg,which were primarily caused by industrial activities,with contribution rates of 44% and 56%,respectively.Chaiet al.(2021a)reported that soil As concentrations had a high probability of coming from fossil fuel combustion.Additionally,most samples were polluted by Hg,and it had the highest CV values(Table I),reflecting that anthropogenic activities may be the primary source.Moreover,there was a significant relationship between Hg concentration and D_toMine(Table SI).According to our field investigation,the study area has abundant vanadium titano-magnetite deposits,the mining and smelting process could result in Hg accumulation(Sunet al.,2020).Many previous studies have also shown that coal burning is recognized as the most common source of Hg in China(Islamet al.,2016;Huet al.,2018;Penget al.,2019).Thus,PC 3 reflects the impact of industrial activities.
Influencing factors and MLR model
Stepwise linear regressions were performed to identify potential influencing factors and the results are presented in Table IV.Significant confidence levels(P <0.01)were observed for all regression models.When only environmental data were incorporated into the model,CEC was the dominant factor for Cu,Ni,Zn,Pb,and As distribution and had a positive impact on HM accumulation.Tianet al.(2017)also demonstrated a strong positive relationship between soil CEC and Cu,Cr,Pb,and Zn concentrations.Total K was an important factor influencing Cr,Zn,and Pb accumulation,perhaps implying that there were some correlations between K fertilizer application and soil HM concentrations.D_toMine was one of the key variables for predicting As concentration,indicating that the spatial distribution of As was related to mining sites.In addition,the adjustedR2values for eight soil HMs were in the range of 0.10-0.81.The optimal variables in the regression model for Cd and Hg prediction were precipitation and latitude,respectively(Table IV),which explained less spatial variance of 18%and 10%,respectively.It is presumed that some unstudied contributors affected the spatial distribution of Cd and Hg.
The three source contribution rates at each sampling point were combined as new auxiliary variables into the stepwise regression model,and the result showed that they were the crucial variables influencing the spatial variation of almost all soil HMs(Table IV).Except for Zn,the adjustedR2showed an overall significant improvement and explained 31%-86%of the spatial variance for different HMs,indicating that the three source contributions of each sample were reliable predictors for improving the fitting accuracy of soil HMs.The source contribution rates of Zn were not selected as the optimal variable during modelling because environmental variable effects on Zn concentration were greater than the three source contributions corresponding to this element(Tables SII and SIII).
Multiple linear regression models were established to predict HM spatial distribution,and the accuracy of“leaveone-out”cross-validation is provided in Table V.Regression models for Cu,Cr,and Ni were similar,Cu_S1,Cr_S1,and Ni_S1 were positively correlated with the corresponding HMs,while the remaining HMs were negatively correlated with the source contribution rates.Previous studies have shown that HM source apportionment helps to quantify the contribution of pollution sources from natural and anthropogenic activities(Anamanet al.,2022).Our study further revealed the relationship between each HM concentration and the corresponding source contribution,which could be used to enhance the prediction accuracy of HMs.In addition,theR2values ranged between 0.45 (Pb) and 0.82(As),except for Hg and Cd,indicating an acceptable prediction for HMs.Chen H Yet al.(2016)predicted the concentrations of Cu,Pb,Zn,Cd,and Hg in two cultivation systems using stepwise regression models,withR2values ranging from 0.41 to 0.63.Guanet al.(2019)demonstrated that HM concentrations could be effectively predicted based on stepwise regression models,and the correlation coeffi-cients were in the range of 0.48-0.61.However,soil Cd was mainly from agriculture sources and Hg was mainly from industrial sources in the study area(Fig.2),which affected their concentrations by point source pollution and resulted in a non-uniform spatial distribution.Thus,the relationships between Cd and Hg concentrations and environmental variables were not effectively fitted by the model.
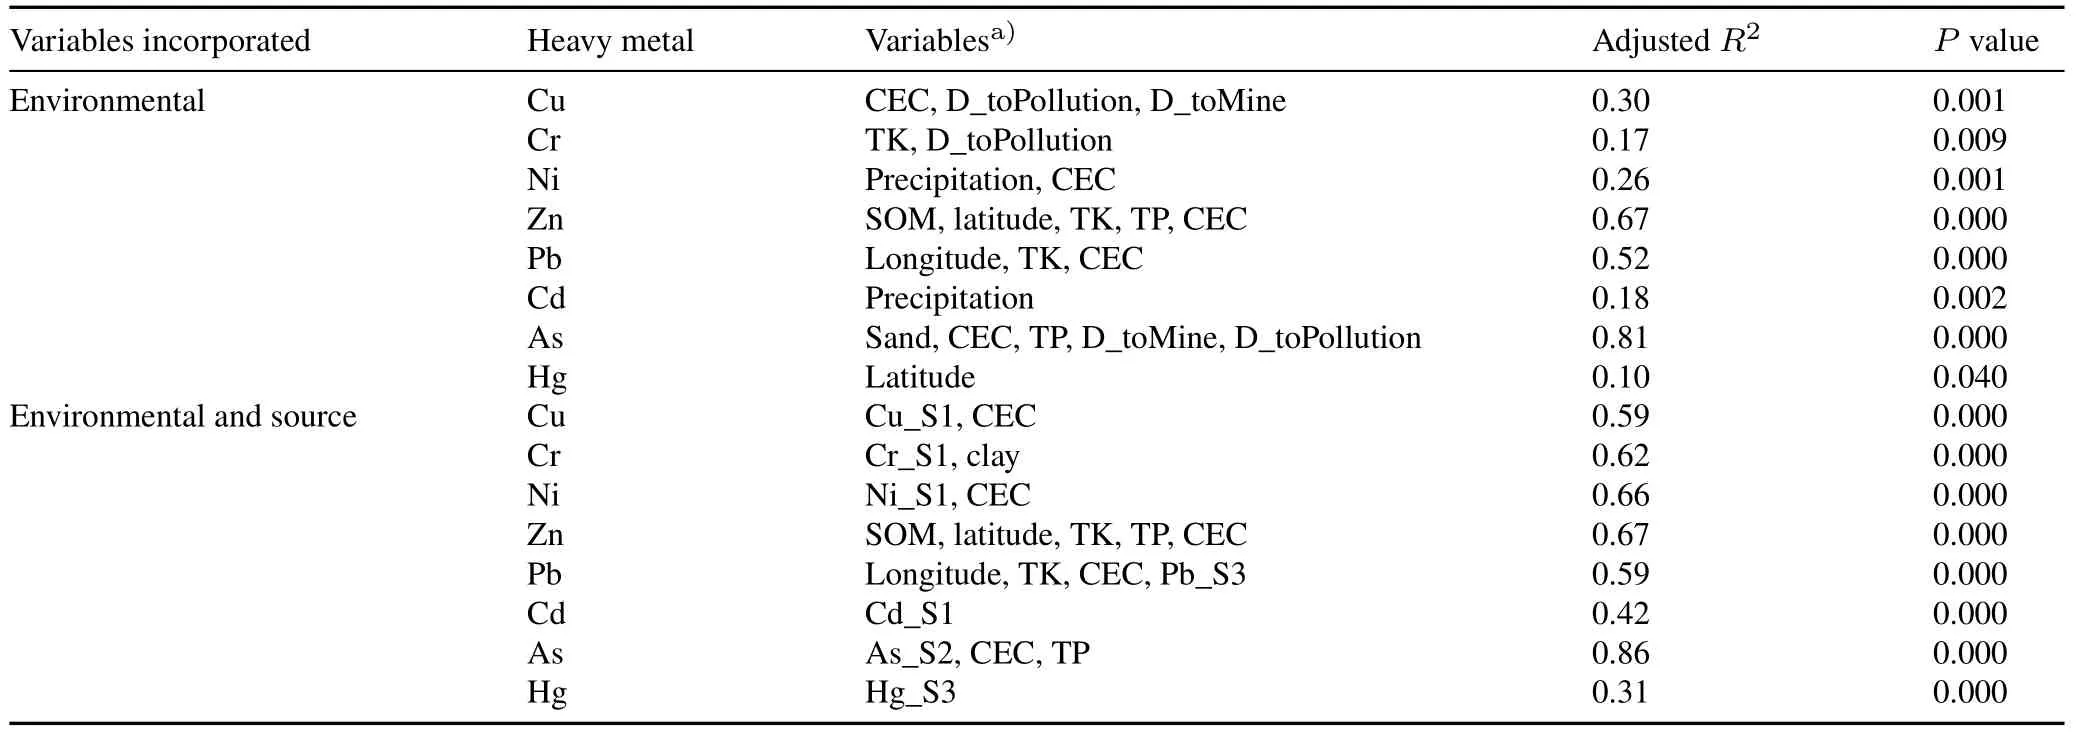
TABLE IVResults of important variables determined from stepwise linear regressions
Spatial distribution ofHMs
The spatial distributions of soil properties and source contributions are shown in Figs.3 and 4,and the crossvalidation results of predictors used for mapping spatial distributions by ordinary kriging are presented in Table VI.The values ofR2ranged from 0.28 to 0.67 (P <0.05),indicating that the kriging interpolation is a credible method to perform follow-up analysis.
Heavy metal spatial distributions based on the optimal set of variables are presented in Fig.5.The spatial patterns of Cu,Cr,and Ni were similar,and high concentrations were primarily located in the southern part of the study region,which was attributed to the same source.Concentrations of Zn and Pb ranged from 52.6to 105.8 and 13.9 to 33.1 mg kg-1,respectively,and high concentrations were mainly in the southwest of the study region.Moreover,the spatial interpolation of Pb concentration showed an increasing trend from northeast to southwest because longitude was closely related to Pb accumulation and showed a significant difference in the horizontal direction.Concentrations of Cd and As were lower than their BVs of 0.094 and 13.6mg kg-1(CNEMC,1990),respectively,so it could be assumed that there was no accumulation of them throughout the study area.
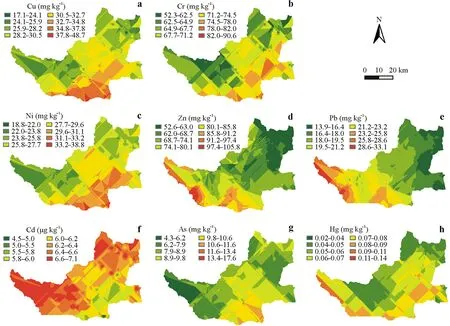
Fig.5 Spatial distributions of soil heavy metals Cu(a),Cr(b),Ni(c),Zn(d),Pb(e),Cd(f),As(g),and Hg(h)mapped using the multiple linear regression method in the study area.
Furthermore,the spatial distribution map showed that Cu and Hg concentrations were 17.1-48.7 and 0.02-0.14 mg kg-1,respectively.The Cu concentrations exceeding BVs were mainly distributed in the southeast,while Hg concentrations in almost the entire study area were higher than BVs.This indicates that these two elements should be given special attention in CHM planting.However,all HM concentrations investigated are controlled under the corresponding risk screening values(MEE and SAMSA,2018)across the study area,indicating that the HM concentrations are within the security level for CHM growth.
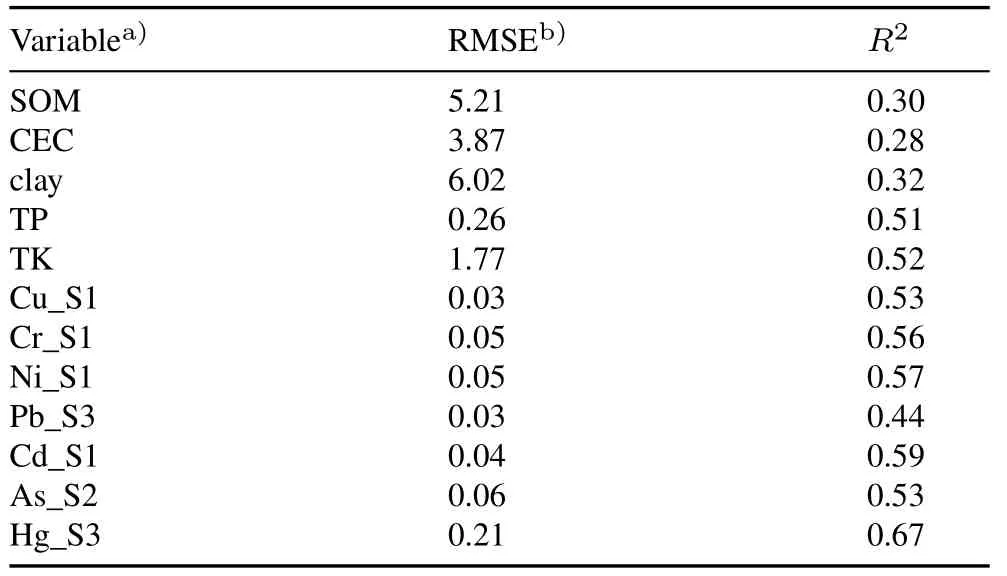
TABLE VICross-validation results for the predictors used for mapping heavy metal spatial distributions using the ordinary kriging method
CONCLUSIONS
Eight soil HMs were investigated in the growing area of CHM plants using small sample sizes.Apart from Cu and Hg,the average concentrations of HMs were lower than their BVs;the CV of Hg concentrations was the largest.All heavy metal concentrations were within the safe levels for CHM growth in this area.
Three types of sources for the eight HMs investigated were quantified according to the APCS-MLR model.Approximately 88%of Cu,72%of Cr,and 72%of Ni concentrations were attributed to parent materials,and these HMs had a similar spatial distribution pattern.For Zn and Pb,50%and 49%were closely related to agricultural activities,and both were high in the southwest and low in the northwest.Fifty-nine percent of Cd was derived from agricultural activities,and 56%of Hg originated from industrial activities.Soil As was mainly from mixed sources,with 31%and 44%derived from parent materials and industrial activities,respectively.
Meanwhile,stepwise linear regression analysis showed that soil properties were the key environmental factors driving HM spatial distributions in CHM planting areas.The sourcetype contribution rates identified by the APCS-MLR model were incorporated as covariates in MLR models and could improve the precision of predicting soil HMs except Zn.The results suggest that the three-type source contributions can be utilized as valuable auxiliary information to improve soil HM mapping precision with small sample sizes at the county scale.
ACKNOWLEDGEMENT
This research was supported by the special project of the National Key Research and Development Program of China(Nos.2021YFC1809104 and 2018YFC1800104).
SUPPLEMENTARY MATERIAL
Supplementary material for this article can be found in the online version.
杂志排行
Pedosphere的其它文章
- Developing the new soil science-Advice for early-career soil scientists
- Biophotoelectrochemistry:An emerging frontier for channeling photoelectric effect into darkness zone of soils and sediments
- Balancing machine learning and artificial intelligence in soil science with human perspective and experience
- Soils in extraterrestrial space:Need for studies under microgravity
- Role of biochar in raising blue carbon stock capacity of salt marshes
- Long-term fertilizer nitrogen management-Soil health conundrum
