Precisely Control Relationship between Sulfur Vacancy and H Absorption for Boosting Hydrogen Evolution Reaction
2024-03-01JingJinXinyaoWangYangHuZhuangZhangHongboLiuJieYinPinxianXi
Jing Jin, Xinyao Wang, Yang Hu, Zhuang Zhang, Hongbo Liu, Jie Yin✉, Pinxian Xi✉
ABSTRACT Effective and robust catalyst is the core of water splitting to produce hydrogen.Here, we report an anionic etching method to tailor the sulfur vacancy (VS) of NiS2 to further enhance the electrocatalytic performance for hydrogen evolution reaction (HER).With the VS concentration change from 2.4% to 8.5%, the H* adsorption strength on S sites changed and NiS2-VS 5.9% shows the most optimized H* adsorption for HER with an ultralow onset potential (68 mV) and has long-term stability for 100 h in 1 M KOH media.In situ attenuated-total-reflection Fourier transform infrared spectroscopy (ATR-FTIRS) measurements are usually used to monitor the adsorption of intermediates.The S- H* peak of the NiS2-VS 5.9% appears at a very low voltage, which is favorable for the HER in alkaline media.Density functional theory calculations also demonstrate the NiS2-VS 5.9% has the optimal |ΔGH*| of 0.17 eV.This work offers a simple and promising pathway to enhance catalytic activity via precise vacancies strategy.
KEYWORDS Hydrogen evolution reaction; S vacancies; Nanosheet; H; Adsorption
1 Introduction
Hydrogen energy usually be regarded as the most promising clean energy source for development at present [1–3].And electrochemical hydrogen evolution reaction (HER) is now considered one of the most effective and clean method to produce H2, as a promising candidate for sustainable development.In addition, industry tends to produce hydrogen in alkaline media due to their low cost, easy to manufacture and good performance [4–7].However, there are still challenges in alkaline media, and it is difficult to generate H* through the HER.In general, the appropriate H2O adsorption and dissociation energy is certainly one deciding factor for this process [8, 9].Crucial to addressing this challenge need to find high catalytic activity and good stability catalysts for HER.To date, Pt-based compounds are the most effective catalysts for HER, but their large-scale application is limited by high price, scarcity and poor stability [10–15].Therefore, designing effective, inexpensive and stable non-noble metal catalysts for HER will be the focus of future research.
Transition metal sulfides (TMS) usually be recognized as promising noble-metal-free electrocatalysts for HER due to the inherent high electrical transport and ideal atomic arrangement [16–21].Moreover, through a series of means which contain doping heteroatoms [22], controlling crystal face [23], engineering defects [24, 25], strains, etc.[26].Therefore, using these microstructure modulations can effectively modify the atomic structures of catalyst.Moreover, the chemical environment and electronic structure of TMS will be tuned by the vacancies control strategy, the local reaction environment of the catalysts also plays a crucial role in electrode processes, thus, to optimize the adsorption of reaction intermediate and accelerate the HER kinetics.However, developing a precise vacancy modulation approach remains a challenge that requires more in-depth studies.
Herein, we report a facile Ar plasma etching strategy approach is proposed to introduce homogeneously distributed S-vacancies (Vs) onto the NiS2nanosheet surface.And the S vacancy concentration can be precise tuning by varying the etching time.The obtained optimized material of NiS2-Vs is 5.9% which means the NiS2nanosheet with S-vacancies concentration of 5.9% under the Ar plasma etching for 3 min.This catalyst has the optimal S-vacancy state.Using the in situ ATR-FTIRS and density functional theory (DFT), the optimized H* adsorption strength is proven.Thus, this catalyst performs a superior HER performance.In strong alkaline electrolytes (for example, 1.0 M KOH), this catalyst shows an overpotential of only 108 mV at a current density of 10 mA cm-2and can maintain long-term stability up to 100 h, which are superior to those of the recently reported breakthrough HER catalysts.And this NiS2structure will occur the phase evolution under HER conditions.We conclude that precisely control of the S-vacancies concentration will open significant opportunities for rational design of electrocatalysts from earth-abundant and stable materials.
2 Experimental and Calculation
2.1 Synthesis
2.1.1 Synthesis of NiLDH Precursor
Using nickel (II) nitrate hexahydrate Ni(NO3)2·6H2O, 0.1 mol L-1, 60 mL as the reaction solution.Then, the three-electrode system was used to electrochemical deposition NiLDH.In detail, the Ag/AgCl electrode was used as a reference electrode, Pt net was employed as an auxiliary electrode, and the working electrodes were carbon cloth (CC).The NiLDH can be obtained on the working electrode under constant potential of - 1.0 V for 60 min.The precipitate was rinsed with water and ethanol for more than three times and dried under vacuum at 50 °C for 4 h.
2.1.2 Synthesis of NiS2 Nanosheets
In generally, 300 mg sulfur powder and two-piece of the NiLDH arrays on the carbon cloth (about 2 × 3 cm2) were placed in two crucibles, which are 20 cm apart in the tube.Then, the tube was heated to 300 °C with a rate of 10 °C min-1for 2 h under the flowing Ar atmosphere.Finally, the system was cooled under a flowing Ar atmosphere and NiS2nanosheets would be obtained.
2.1.3 Synthesis of P-NiS2 Nanosheets
In generally, the NiS2nanosheets were using plasma etching technology, at different etching time, can be obtained different S vacancies concentration NiS2nanosheets.
2.2 Materials Characterizations
X-ray diffraction (XRD) experiments were conducted 2 from 10° to 90° on an X’Pert ProX-ray diffractometer with Cu Ka radiation (λ= 0.1542 nm) under a voltage of 40 kV and a current of 40 mA.Sample compositions were determined by ICP-AES (HITACHI P-4010, Japan).Fieldemission scanning electron microscopy (FESEM, Zeiss) at an acceleration voltage of 5 kV.All samples were coated with a thin layer of gold prior to FESEM observations.Transmission electron microscopy (TEM) and high-resolution transmission electron microscopy (HRTEM) observations were performed under an acceleration voltage of 200 kV with a JEOL JEM 2100 TEM.Atomic-scale STEM images were recorded on a probe aberration-corrected STEM (Cubed Titan G2 60-300, FEI, USA) operated at 300 kV.X-ray photoelectron spectroscopy (XPS) analyses were made with a VG ESCALAB 220I-XL device.All XPS spectra were corrected using C 1sline at 284.6 eV.The absorption spectra of M (M = S, Ni) L/K-edge and were collected in transmission mode using a Si (111) double-crystal monochromator at the BLW141 station of the Shanghai Synchrotron Radiation Facility (SSRF).
2.3 Electrochemical Test for HER
Electrochemical measurements were carried out at room temperature using the three-electrode system directly connected to a CHI 760 E Electrochemical Workstation (CHI Instruments, Shanghai Chenhua Instrument Corp., China).Saturated Hg/HgO (in a saturated 1.0 M KOH solution) was employed as a reference electrode, the corresponding catalysts were used as working electrode, and a graphite rod was employed as a counter electrode.The potentials were referenced to the RHE (ERHE=EHg/HgO+ 0.098 V + 0.0591pH V).Also, a resistance test was made and the iR compensation was applied by using the CHI software.
2.4 Theoretical Calculations
All spin-polarized calculations are performed in the framework of the density functional theory with the projector augmented plane-wave method, as implemented in the Vienna ab initio simulation package [27].The generalized gradient approximation proposed by RPBE is selected for the exchange–correlation potential [28].The DFT-D3 method was used to describe the van der Waals interactions between intermediate and catalyst [29].The DFT + U method was used to optimize the geometric and electronic structures, where U value was 3.40 for Ni.The cut-off energy for plane wave is set to 450 eV.The energy criterion is set to 10-4eV in iterative solution of the Kohn–Sham equation.A vacuum layer of 15 Å is added perpendicular to the sheet to avoid artificial interaction between periodic images.The Brillouin zone integration is performed using a 3 × 3 × 1 k-mesh.All the structures are relaxed until the residual forces on the atoms have declined to less than 0.02 eV Å-1.
The adsorption energy (ΔEads) and free energy changes (ΔG) of reaction intermediates could be calculated by the following:
whereEadsandEslabare the energy of H + and substrate, respectively.The ΔEis the adsorption energy on the cluster surface from DFT calculations.The ΔEZPEand ΔSare the difference for the zero-point energy and entropy.The zeropoint energy and entropy are calculated at the standard conditions corresponding to the pressure of 10,1325 Pa (~ 1 bar) of H2at the temperature of 298.15 K.
3 Results and Discussion
3.1 Catalyst Design and Structural Characterization
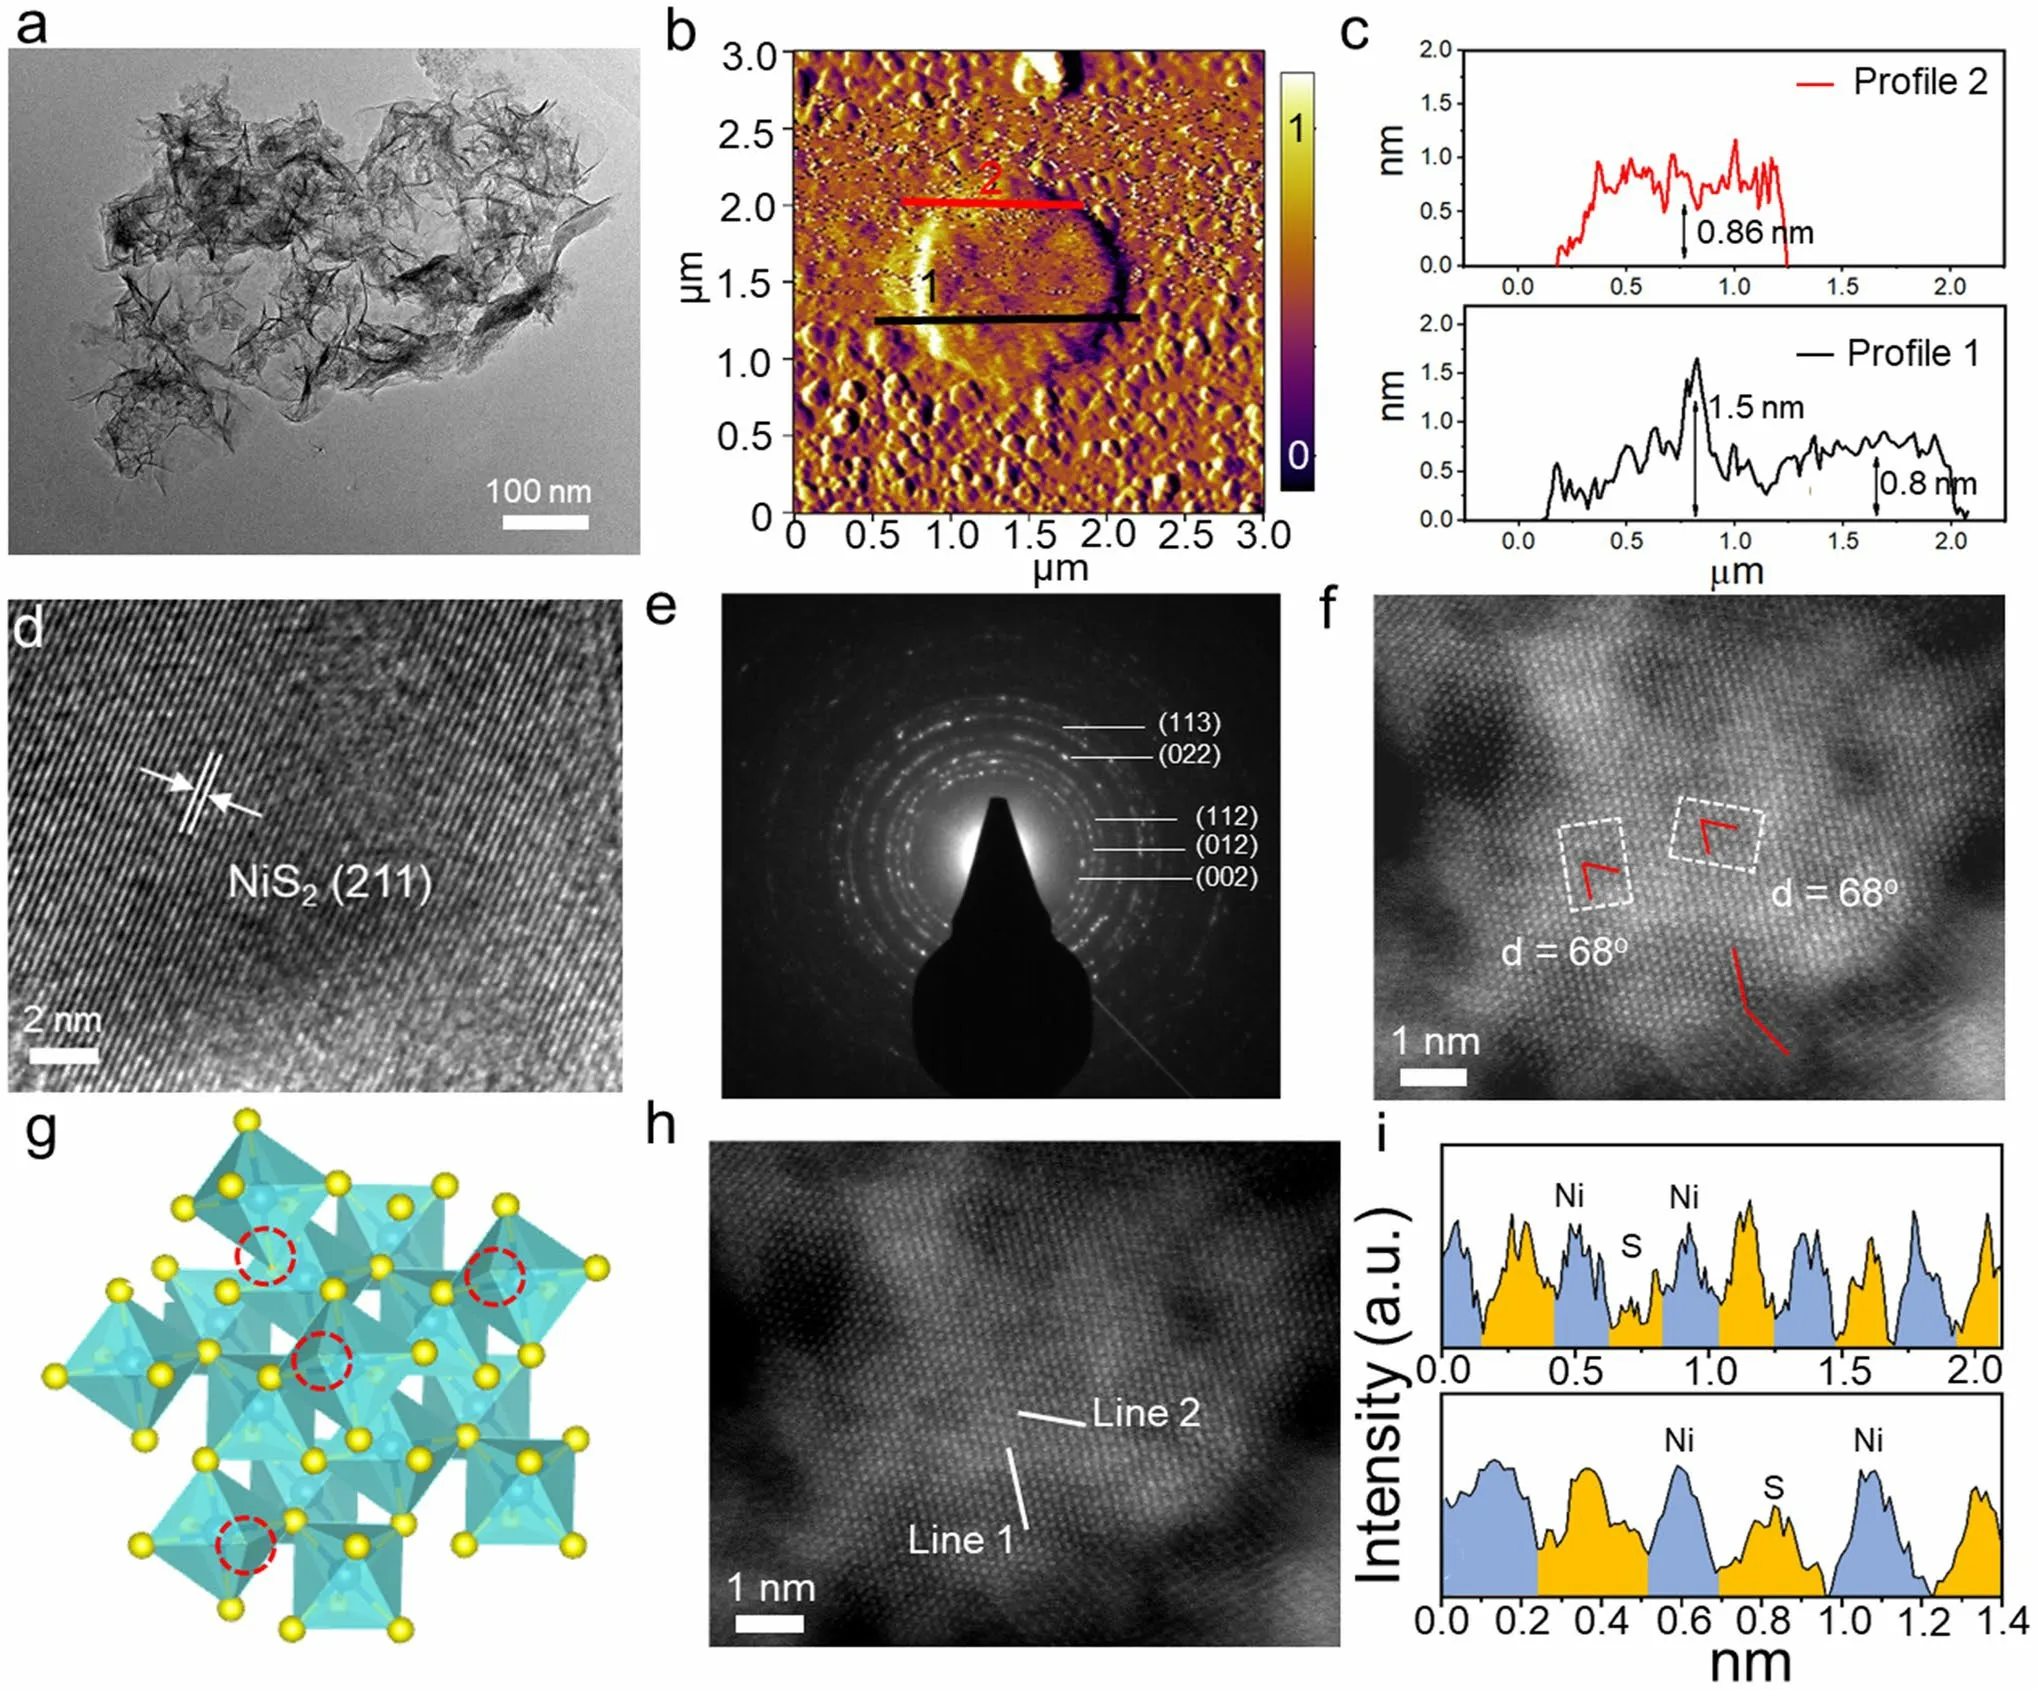
Fig.1 a TEM images of NiS2-Vs 5.9% NSs; b AFM image of the NiS2-Vs 5.9% NSs; c The corresponding height profiles obtained from two different line scans of 1, 2 in (b).d HRTEM images of NiS2-Vs 5.9% NSs; e SAED image of NiS2-Vs 5.9% NSs; f HAADF-STEM image of NiS2-Vs 5.9% NSs, the insert white squares show the lattice deformation of S vacancies introduced; g Crystal structure of NiS2-Vs 5.9% NSs; h HAADF-STEM image of S vacancies in NiS2-Vs 5.9% NSs; i Intensity profile of line 1 and 2 areas
We developed the Ni-LDH nanosheets precursor via electrochemical deposition, then the NiS2NSs are obtained through the calcination of the corresponding LDH under sulfur stream at 300 °C for 2 h, and finally, we introduced theS-vacancies on NiS2NSs by Ar plasma etching strategy and adjustingS-vacancy concentrations via controlling etching time.In general, the TEM is applied to characterize the morphology of the synthesized materials, as shown in Fig.1a, the NiS2-Vs 5.9% performs a uniform ultra-thin nanosheet structure.From Fig.1b, combined with the atomic force microscopy (AFM), we could evaluate the thickness of the NiS2-Vs 5.9% NSs, and the results further confirm the 2D morphology of these NiS2NSs.The AFM height profiles of the NiS2-Vs 5.9% NSs (Fig.1c) revealed that the nanosheets presented a uniform height of approximately 0.8 nm.Additionally, the HRTEM could confirm the fine structure of NiS2-Vs 5.9% NSs.From Fig.1d, the HRTEM image of NiS2-Vs 5.9% NSs displays the lattice space of 0.23 nm that matches with the (211) plane of NiS2.The introduced S vacancies did not cause change in the overall structure with NiS2NSs (Figs.S1 and S2).The selected-area electron diffraction (SAED) also confirms the NiS2-Vs 5.9% NSs maintain the NiS2crystal structure after Ar plasma (Fig.1e).At the same time, in order to further confirm the successful introduction of S vacancies in NiS2-Vs 5.9% NSs, the highangle annular dark field aberration-corrected scanning TEM (HAADF-STEM) was used and clearly observed the atomic arrangement of NiS2-Vs 5.9% NSs (Fig.1f), which shows the S vacancies introduced caused lattice distortion in local areas.In addition, the introduced S vacancies in the NiS2-Vs 5.9% NSs are examined by HAADF-STEM shown in Fig.1h, g.By analyzing the atom arrangement of lines 1 and 2, indicating the presence of S vacancies in the NiS2-Vs 5.9% NSs, the corresponding line intensity profiles in Fig.1i can directly display the different periodic atom arrangements of line 1 and 2 and reconfirm the introduced S vacancies in the NiS2-Vs 5.9% NSs.
The electronic and coordination structures of NiS2which using Ar plasma etching were further investigated using various spectroscopy methods.From Fig.2a, these NiS2NSs which under different etching time display the same XRD pattern of cubic NiS2with a space group of Pa3 (JCPDS No.11 - 99,a=b=c= 5.670 Å), has same result with the HRTEM image.In addition, combined with XPS could exploring the impact of introducing sulfur defects on the electronic environment of materials.As shown in Fig.2b, the XPS of Ni 2p, which contained with two spin–orbit doublets characteristic of Ni2+, Ni3+and two shakeup satellites (identified as “Sat”).By analyzing the peak area of two spin–orbit doublets characteristic of Ni2+and Ni3+, the introduced sulfur vacancies by Ar plasma etching could cause the electronic environment to change of NiS2, the proportion of Ni2+/Ni3+increase with growth of etching time, indicates that as the etching time increases, more sulfur vacancies will be introduced and resulting in decrease the metal valence state in NiS2(Fig.2e).Meanwhile, the electronic environment change of Ni site could optimize the adsorption and dissociation of water, which were advantageous to HER.Tailoring sulfur vacancies concentration plays important role of electronic structure change; thus, we need to clarify the different sulfur vacancies concentrations which caused by Ar plasma etching.As depicted in Fig.2c, S 2pXPS spectra have two peaks about S 2p1/2peak and S 2p3/2peak, according to the previous report, and the S 2p1/2peak corresponding to low coordination sulfur is related to sulfur vacancies [30].Thus, we have estimated the sulfur vacancy concentration of all NiS2which using Ar plasma etching.As shown in Fig.2f, with etching time extension the sulfur vacancy concentration also gradually increases, and this is consistent with the previous conclusion.Figure 2d shows the Raman spectra of the NiS2NSs with different S vacancies concentrations; from the detailed vibrational modes of the Raman spectra, we can observe the characteristic peaks of NiS2and with the increase of S vacancies, and this characteristic peaks gradually occur red shift.
3.2 Electrocatalytic Performance
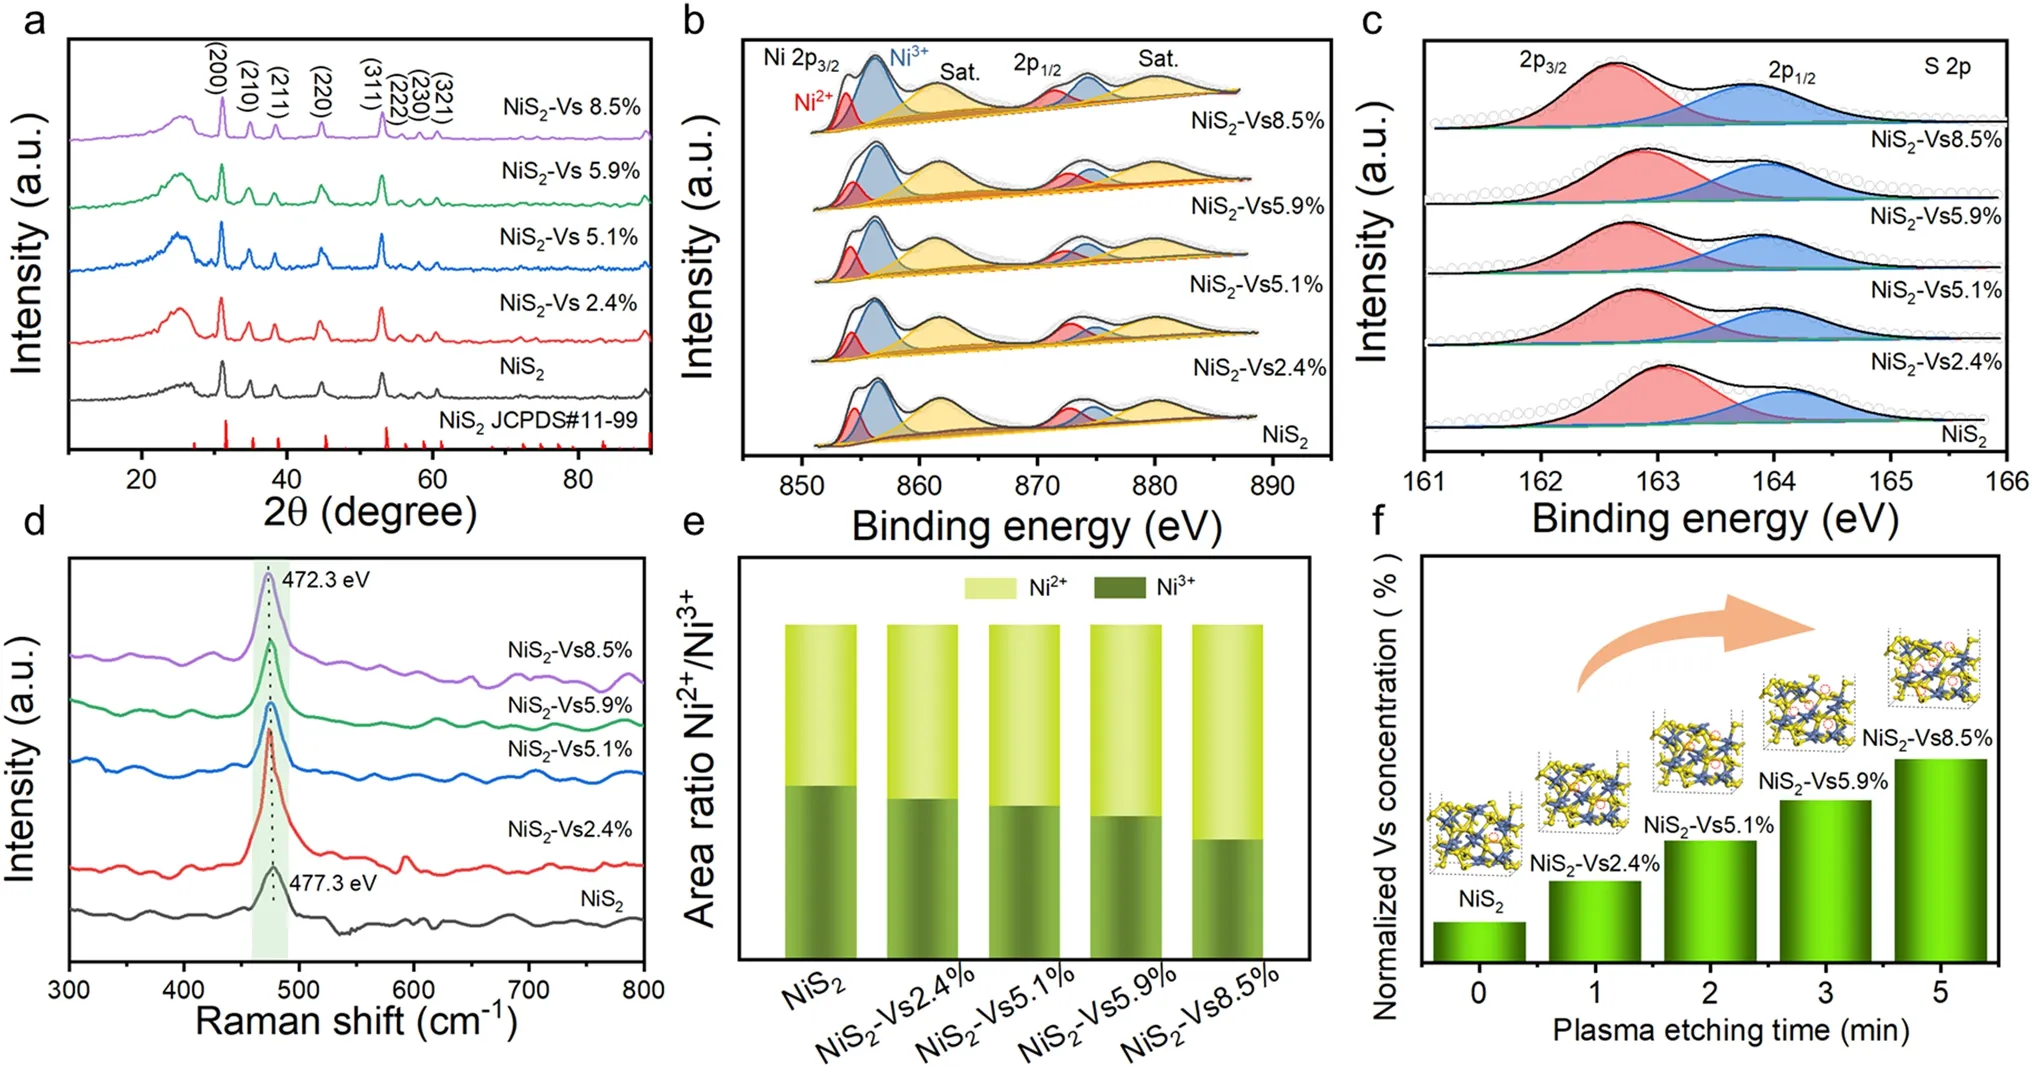
Fig.2 a XRD patterns of the NiS2 nanosheets with a series of S vacancies concentrations; b, c Ni 2p spectra and S 2p spectra of XPS for the NiS2 nanosheets with a series of S vacancies concentrations; d Raman spectra of the NiS2 nanosheets with a series of S vacancies concentrations; e The area ratio Ni2+/Ni3+ of the NiS2 nanosheets with a series of S vacancies concentrations; f Histogram of the calculated S vacancies concentrations
The HER catalytic activity of these materials which contain the NiS2at different times Ar plasma etching was assessed as the working electrode and evaluated by linear scan voltammogram (LSV) in N2-saturated 1.0 M KOH electrolyte (pH = 14) in a three-electrode cell (Fig.3a).Figure 3b shows the HER performance of these catalysts.As we think, NiS2-Vs 5.9% shows excellent HER performance which has ultra-low overpotentials, when the current density at 10 mA cm-2, the overpotential just 108 mV, it’s much better than those contrast materials which contain NiS2(182 mV), NiS2-Vs 2.4% (165 mV), NiS2-Vs 5.1% (150 mV) and NiS2-Vs 8.5% (146 mV).Additionally, the Tafel plots (log j ~η) also play a significant role in electrocatalytic can further measured to confirm the HER kinetic rate of those catalysts.As shown in Fig.3c, NiS2-Vs 5.9% has the smallest Tafel role (82 mV dec-1) indicating the fastest HER kinetics.Apart from that the electrochemical impedance spectroscopy (EIS) analysis could further investigate the electrode kinetics during the HER process.From Fig.3d, e shows the Nyquist plots of these electrodes, the NiS2-Vs 5.9% with low solution resistance (Rs) of 1.25 Ohm and charge-transfer resistance (Rct) of 4.5 Ohm (Table S1), was obviously lower than other contrast materials.Meanwhile, EIS also could be used to elucidate the redox processes at different potentials, the NiS2-Vs 5.9% phase angle maximum in the Bode plot moved fastest to lower values (Fig.S3), which further confirm the NiS2-Vs 5.9% has fastest HER kinetics.Among some representative HER catalysts reported, the NiS2-Vs 5.9% with present state-of-the-art alkaline HER catalysts (Fig.3f and Table S2) [31–42].Furthermore, to assess the kinetic barriers involved in HER, we studied the effect of temperature on the performance of NiS2NSs in alkaline media (Figs.3g and S4–S8).Meanwhile, we found theEappvalue which calculated from the Arrhenius equation will reach its maximum around the respective catalytic OER onset potential, the NiS2-Vs 5.9% demonstrates the low apparent barrier value of 23.9 kJ mol-1at a lower onset potential compared to other catalysts, suggests has the good OER catalyst activity.Additionally, the stability is one of the important criteria to measure the performance of catalyst.From Fig.3h, NiS2-Vs 5.9% performs perfect stability at current densities 10 mA cm-2for 100 h in alkaline media with a negligible overpotential change.At the same time, we used the drainage method recorded the H2production rate; from Fig.3i, the hydrogen evolution rate could reach 0.9 mL min-1at current densities 100 mA cm-2.

Fig.3 a Schematic diagram of hydrogen evolution of the NiS2 NSs with S vacancies concentrations.b IR-corrected LSV curves, c Tafel plots and d EIS curves of the NiS2 nanosheets with a series of S vacancies concentrations; e Bode phase plots of NiS2-Vs 5.9%; f Comparison of merit with respect to both kinetics (Tafel slope) and activity; g LSV curves of NiS2-Vs 5.9% NSs for HER at different temperatures.The inset in g shows Arrhenius plot of the kinetic current; h Chronoamperometric response of NiS2-Vs 5.9% NSs for HER at 10 mA cm-2; i Experimentally and theoretical measured H2 amounts based on NiS2-Vs 5.9% NSs
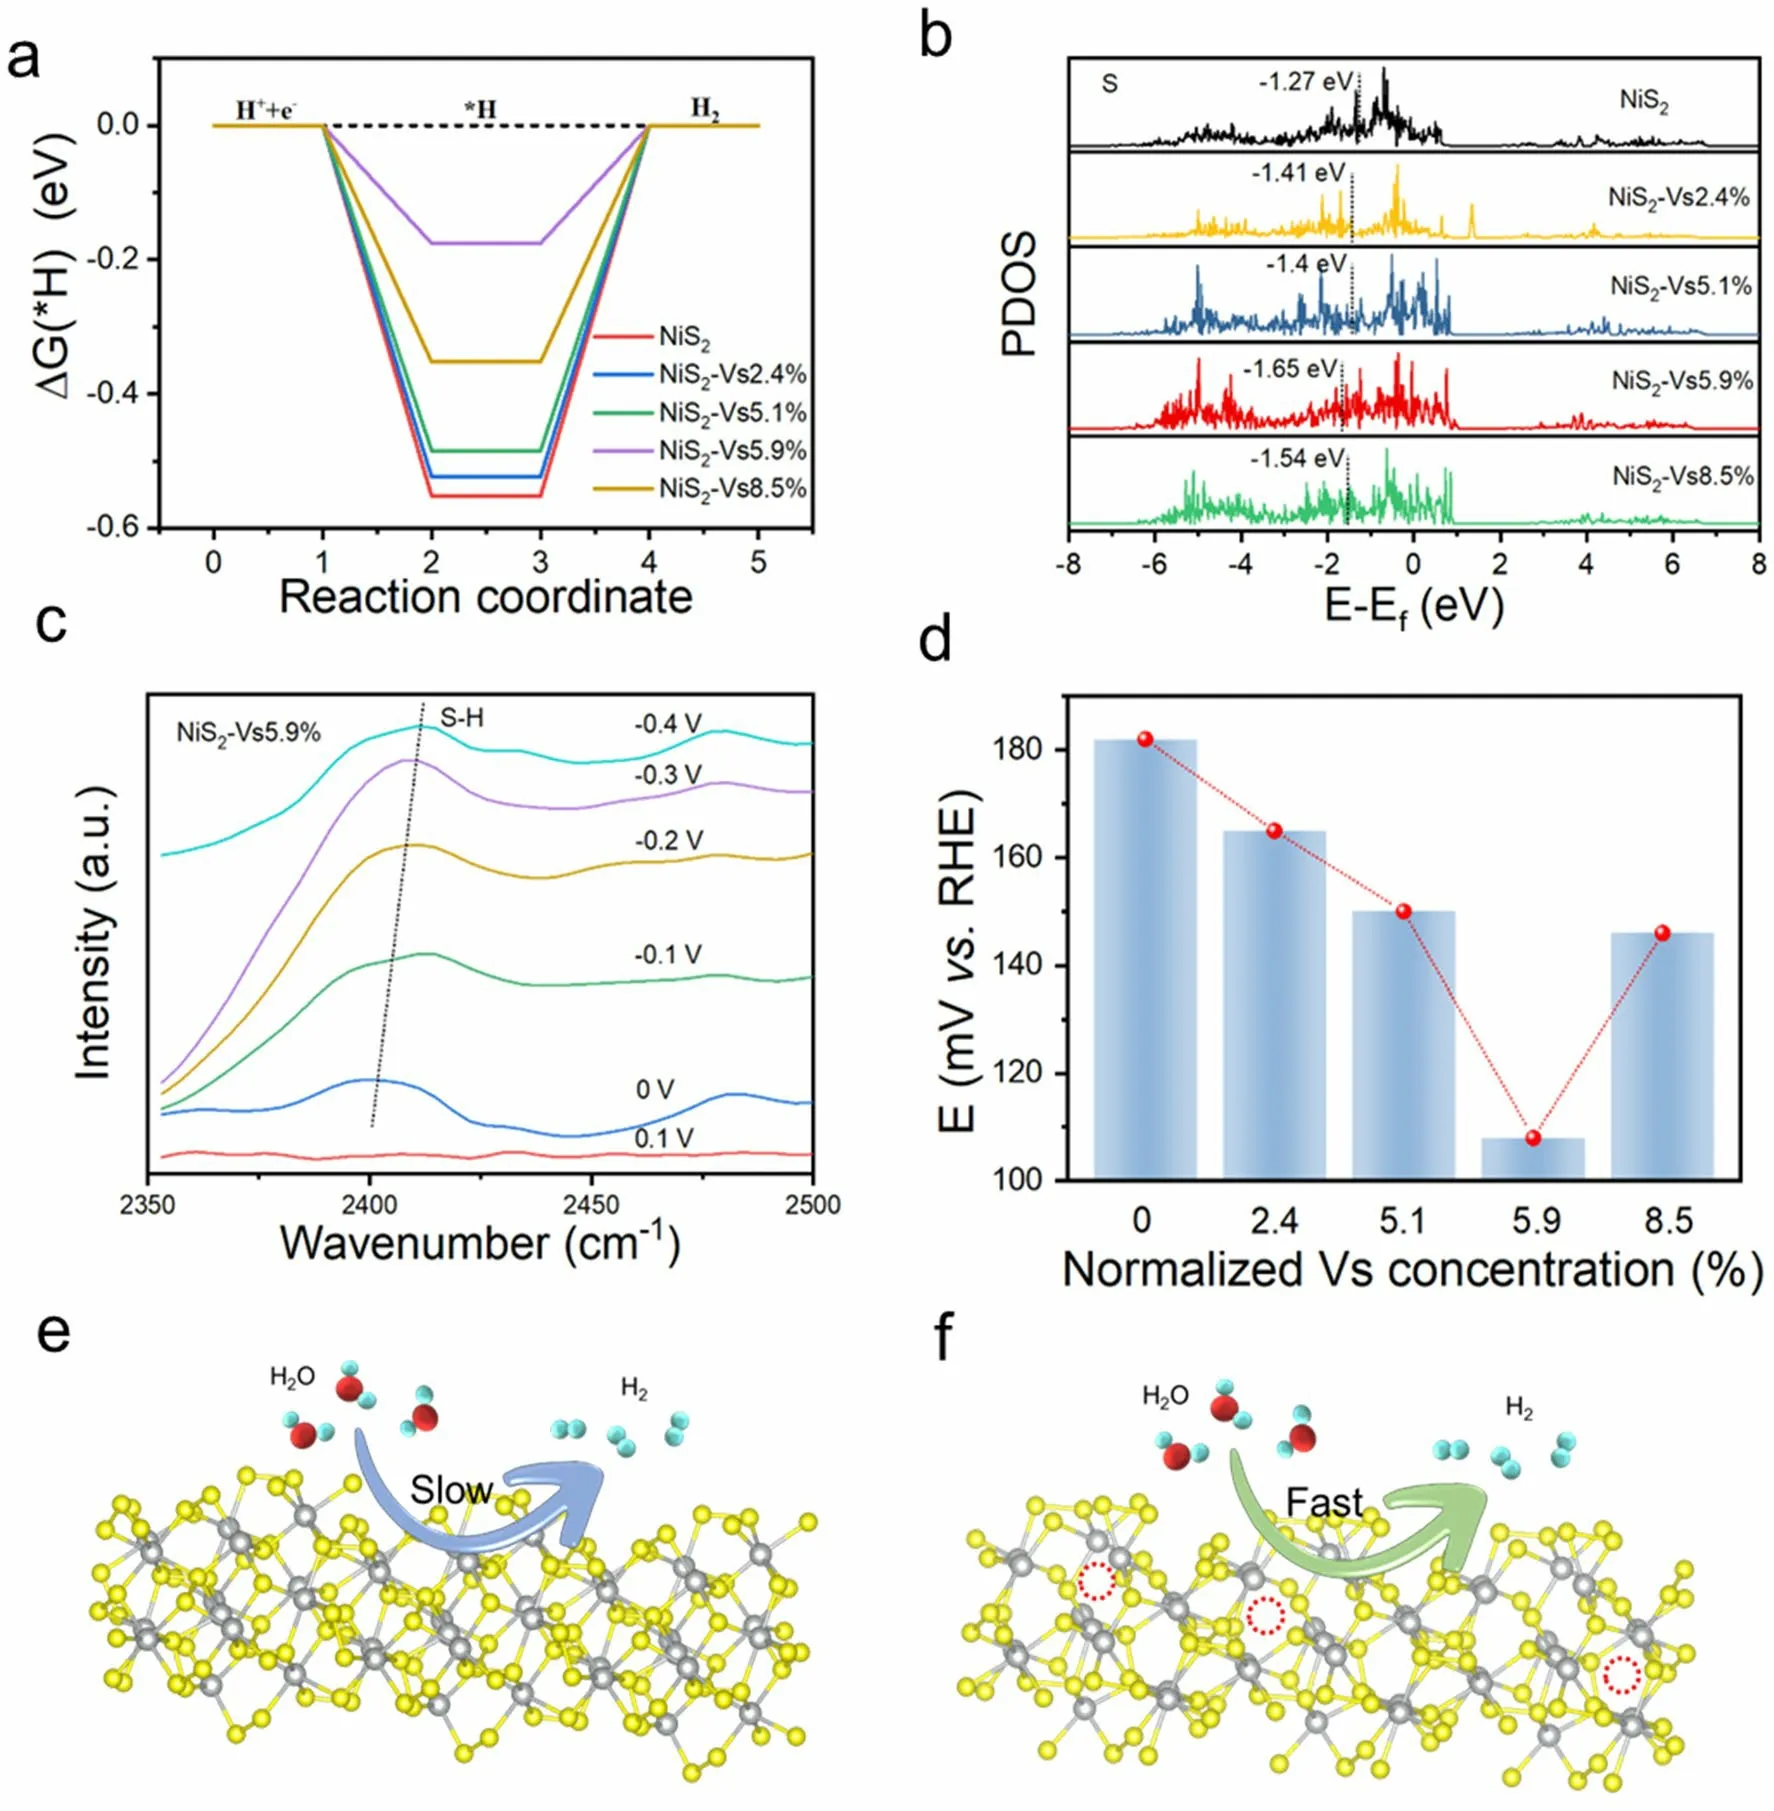
Fig.4 a, b PDOS and ΔGH* of the NiS2 nanosheets with a series of S vacancies concentrations; c *H bands recorded on S sites in NiS2-Vs 5.9%; d Catalytic activity of different S vacancies concentrations; e, f Scheme of NiS2 nanosheets catalyst under the HER process
3.3 Mechanism Analysis of the Enhanced Catalytic Performance
To explore the synergistic effect of the S-vacancy concentration and distribution on the HER properties, we systematically performed DFT calculations of ΔGH*, which is a well-known descriptor for theoretically predicting catalytic activity.As shown in Figs.4a, b and S9, the ΔGH*of NiS2-Vs 5.9% is closest to 0, and we all know the free energy of H* close to zero is considered to show high activity, this result is also consistent with previous experiments.And the density of states is further calculated to understand the intrinsic activity.Apart from that, we utilize the in situ spectroscopy to further reveal the origin of the activity of H atom adsorption on the active site.As shown in Figs.4c and S10, the in situ ATR-FTIRS measurements were conducted to monitor the possible adsorption site and changes of binding energies of the reaction intermediates, the S–H peak appears at a low voltage, which indicate the introduced sulfur vacancies optimizes the H* adsorption on S sites, also resulting in the extremely enhanced HER activity for NiS2-Vs 5.9% NSs.In addition, the relationship of catalytic activity and S vacancies concentrations as shown in Fig.4d.All in all, these results as shown in the schematic diagram (Fig.4e, f), the catalyst which is treated by Ar plasma etching will introduced S vacanies and conducive to boost HER.
3.4 Dynamic Phase Reconstruction
After the HER catalytic test, we re-examined the crystal structure of NiS2-Vs 5.9%.According to the ex-XPS test, we studied the dynamic reconstruction of nickel sulfides surface during the HER process.As shown in Fig.5a, we found that when the applied reduction potentials gradually increased, the corresponding characteristic peaks of Ni3S2could be identified.And from the in situ Raman spectrum, we could observed the characteristic peak of Ni3S2, further prove have formed Ni3S2structure in the HER process (Fig.S11).At the same time, combined with the HRTEM images (Fig.5b, c), the NiS2-Vs 5.9% NSs occur surface reconstruction and form the (111) plane of Ni3S2after 30 min operation under the - 1 V and - 1.1 V condition, respectively.In general, just as the schematic diagram (Fig.5d), the NiS2structure will occur surface reconstruction into the Ni3S2layer during the HER process.For NiS2nanocrystal, the phase evolution and valence evolution in the whole HER process were revealed through a series of spectroscopy and microscope techniques, which can directly observe the reconstruction process and establish the dynamic structure activity correlation of its life.
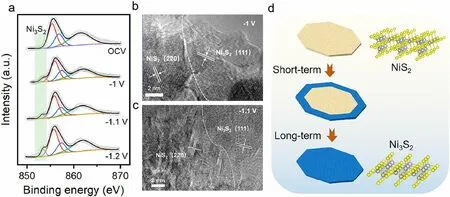
Fig.5 a Ni 2p XPS spectrum of NiS2-Vs 5.9% NSs under the HER process; b, c HRTEM images of NiS2-Vs 5.9% NSs at - 1 V and - 1.1 V, respectively; d Schematic illustration of the dynamic reconstruction of NiS2 NSs during HER process
4 Conclusions
In conclusion, we have successfully developed an Ar plasma etching strategy to precise control the different concentrations of S vacancies in NiS2NSs, and the catalyst NiS2-Vs 5.9% has perfected HER activity which has ultra-low overpotentials and good stability and can maintain 100 h in alkaline solution.The experimental and theoretical results confirm that the introduced S vacancies tuned the chemical environment and electronic structure of NiS2and thus successfully optimized the adsorption energy of proton H.And further study indicated the phase evolution of NiS2structure convert to the Ni3S2structrue under HER process.This work will facilitate the development of novel high-performance electrocatalysts by vacancies strategy and provide insights into how to manipulate the electronic structure and chemical environment of metal sulfide catalysts to enhance the activity in a broad range of applications including HER.
Acknowledgements This work was funded by the National Natural Science Foundation of China (NSFC) (Nos.22221001, 22201115, 21931001, and 21922105), the Special Fund Project of Guiding Scientific and Technological Innovation Development of Gansu Province (2019ZX–04), and the 111 Project (B20027), as well as by the Fundamental Research Funds for the Central Universities (lzujbky-2023-eyt03).J.Y.acknowledges the support Natural Science Foundation of Gansu Providence (22JR5RA540) and Gansu Province Youth Science and Technology Talent Promotion Project (GXH202220530-02).The computational resource was supported by National Supercomputing Center in Lanzhou University and the VASP copyright reserved by Yu Long, Lanzhou University.
Data Availability The data that support the findings of this study are available from the corresponding author upon request.
Declarations
Conflict of interest All authors declare no conflicts of interest.They have no known competing financial interests or personal relationships that could have appeared to influence the work reported in this paper.
Open Access This article is licensed under a Creative Commons Attribution 4.0 International License, which permits use, sharing, adaptation, distribution and reproduction in any medium or format, as long as you give appropriate credit to the original author(s) and the source, provide a link to the Creative Commons licence, and indicate if changes were made.The images or other third party material in this article are included in the article’s Creative Commons licence, unless indicated otherwise in a credit line to the material.If material is not included in the article’s Creative Commons licence and your intended use is not permitted by statutory regulation or exceeds the permitted use, you will need to obtain permission directly from the copyright holder.To view a copy of this licence, visit http:// creat iveco mmons.org/ licen ses/ by/4.0/.
杂志排行

Nano-Micro Letters的其它文章
- A Review on Engineering Design for Enhancing Interfacial Contact in Solid-State Lithium–Sulfur Batteries
- Hierarchically Structured Nb2O5 Microflowers with Enhanced Capacity and Fast-Charging Capability for Flexible Planar Sodium Ion Micro-Supercapacitors
- Superhydrophobic Surface-Assisted Preparation of Microspheres and Supraparticles and Their Applications
- Proof of Aerobically Autoxidized Self-Charge Concept Based on Single Catechol-Enriched Carbon Cathode Material
- Bioinspired Multifunctional Self-Sensing Actuated Gradient Hydrogel for Soft-Hard Robot Remote Interaction
- Decade Milestone Advancement of Defect-Engineered g-C3N4 for Solar Catalytic Applications