Development of multi-group Monte-Carlo transport and depletion coupling calculation method and verification with metal-fueled fast reactor
2024-01-15HuiGuoYiWeiWuQuFeiSongYuYangShenHanYangGu
Hui Guo · Yi-Wei Wu · Qu-Fei Song · Yu-Yang Shen · Han-Yang Gu
Abstract The accurate modeling of depletion, intricately tied to the solution of the neutron transport equation, is crucial for the design,analysis, and licensing of nuclear reactors and their fuel cycles.This paper introduces a novel multi-group Monte-Carlo depletion calculation approach.Multi-group cross-sections (MGXS) are derived from both 3D whole-core model and 2D fuel subassembly model using the continuous-energy Monte-Carlo method.Core calculations employ the multi-group Monte-Carlo method, accommodating both homogeneous and specific local heterogeneous geometries.The proposed method has been validated against the MET-1000 metal-fueled fast reactors, using both the OECD/NEA benchmark and a new refueling benchmark introduced in this paper.Our findings suggest that microscopic MGXS, produced via the Monte-Carlo method,are viable for fast reactor depletion analyses.Furthermore, the locally heterogeneous model with angular-dependent MGXS offers robust predictions for core reactivity, control rod value, sodium void value, Doppler constants, power distribution,and concentration levels.
Keywords Monte-Carlo · Multi-group cross-section generation · Depletion · Fast reactors · Metallic fuel
1 Introduction
Depletion, also known as burnup or transmutation, is a time-dependent process in which nuclides transform due to nuclear reactions and spontaneous radioactive decay[1].Modeling depletion is crucial for the design, analysis,and licensing of nuclear reactors and their fuel cycles, as it is intimately tied to the solution of the neutron transport equation.The Monte-Carlo (MC) method offers a versatile approach to tackle neutron transport challenges.It accommodates both continuous-energy (CE) and multi-group cross-sections (MGXS) and allows for modeling using either constructive solid geometry (CSG) or computer-aided design(CAD) representations.This flexibility ensures accurate and high-fidelity modeling of nuclear reactors and related systems.
The depletion capabilities have been implemented in many Monte-Carlo codes by coupling with their CE transport calculation including MCNP6 [2], MC21 [3], Serpent[4], JMCT [5], RMC [6], and OpenMC [1], etc.The CE depletion calculation scheme determines reaction rates for all nuclides within depletable zones.These rates subsequently assist in solving the Bateman equations.Despite the detailed physics modeling, which grants the CE scheme enhanced simulation precision, it demands repeated CE transport calculations.This repetition leads to high computational costs, especially given the numerous reaction rate tallies required for the discretization of depletable zones and nuclides [7].Any modifications to core parameters necessitate a complete recalculation of depletion demanding substantial computational resources, especially during the general design phase of a nuclear reactor.
Conversely, the multi-group Monte-Carlo (MGMC)transport calculation, homogenizes the space and utilizes MGXS.This method is adopted by platforms such as MVP/GMVP II [8], Shift [9], MC3 [10], RMC [6], and OpenMC [11].It offers the advantage of reduced computational costs while retaining flexibility in geometric modeling.One key focus in multiphysics analysis is the local heterogeneity at the core calculation level [12].This research examines the locally heterogeneous modeling of absorbers in contrast to the conventional homogeneous modeling of all assemblies in multi-group core solutions.
The effectiveness of MG calculations largely hinges on the generation of MGXS.While MGXS is foundational for many deterministic neutron transport codes and MGMC calculations, its generation via CEMC tallies has gained traction.Platforms such as SERPENT [13], MCNP6 [2],McCARD [14], RMC [6], and OpenMC [15] have incorporated this method.It integrates resonance self-shielding and multi-level lattice calculations, providing an alternative to deterministic approaches.Given the intricate geometries and mixed spectra in contemporary nuclear system designs,there is increasing interest in this method.Although past research [16—19] has often employed 2D assemblies/clusters or 3D assemblies to generate macroscopic cross-sections,this study delves into 3D whole-core modeling for generating microscopic MGXS.This approach becomes even more pertinent for smaller reactors, emphasizing the significance of neutron leakage and spatial effects.
In our previous work, we verified the generation of MGXS using OpenMC [20] and its integration with a MGMC transport solver and a diffusion solver.This verification was performed on a sodium fast reactor (SFR) for static analyses without burnup [17].The present work's objective is to develop and verify a transport depletion coupling calculation method.This method utilizes MGXS generated in 3D whole-core models using the CE MC technique and core calculations executed with the MGMC method that incorporates locally heterogeneous models.Additionally, this research will explore the impact of angle-dependent and burnup-dependent MGXS.
The remaining paper is organized as follows: Section 2 elaborates on the calculation scheme adopted in this study,encompassing the strategies for cross-section generation,core calculation, and depletion resolution.Section 3 presents the numerical benchmarks for the proposed scheme.Section 4 concludes the paper, summarizing key findings, discussing potential limitations, and hinting at future research directions.
2 Multi-group Monte-Carlo depletion scheme
Figure 1 provides a comprehensive overview of the MG depletion scheme proposed herein.This scheme encapsulates effective cross-section generation, core calculation, and depletion resolution.These critical phases will be elucidated in the subsequent sections.It is noteworthy that the MG model’s design, which includes its geometry, materials, and cross-sections, is facilitated by OpenMC's Python API.This not only streamlines model construction but also offers flexibility in toggling between the CE and MG schemes.
2.1 Cross-section generation stage
2.1.1 Single-group microscopic cross-sections for depletion
The 1-group cross-sections, essential for depletion calculations, are derived from OpenMC's modeling of the 2D fuel subassembly (SA) as depicted in Fig.2.This is achieved using flux-volume homogenization techniques.During this phase, 1-group (n,f), (n,γ), (n,α), (n,p), (n, 2n), (n, 2n), (n,3n), and (n, 4n) microscopic cross-sections for all nuclides listed in the ENDF/B-VII.1 library are generated.These cross-sections align with those utilized in the CE depletion scheme.The rationale behind employing this 2D geometry is to ensure representative flux characteristics, pivotal for generating cross-sections for depletion.Such supercell geometries are prevalently employed in deterministic processes for generating multi-group cross-sections for transport calculations [21].
2.1.2 Multi-group microscopic cross-sections for whole-core transport and depletion
These cross-sections are produced from OpenMC's modeling of a 3D heterogeneous core, as visualized in Fig.3a.This comprehensive core model is adept at conducting intricate depletion calculations and generating MGXS for every burnup step.The impact of burnup on the microscopic MGXS of metal-fueled SFRs is delved into in Sect.3.1.2.While generating burnup-dependent MGXS would elevate the computational demands, this study leverages burnupindependent MGXS unless stated otherwise.In a fresh core,there is an absence of fission products and certain heavy nuclides.For depletable materials, material composition is anticipated using the 1-group cross-sections from the preceding phase.The flux level is discerned from the 2D fuel subassembly, reflecting the core's average power density.The irradiation duration equates to half of the core's total residence time.Depletion calculations, employing the predictor method, are executed using OpenMC's inbuilt solver.Both the chain and time step mirror the core's comprehensive calculations.Consequently, the composition closely mirrors an average burnup state, leading to the generation of MGXS in a core state with an average fuel burnup.

Fig.3 (Color online) Symbolic illustrations of 3D core model for cross-section generation and multi-group core calculation.(a) Heterogeneous model; (b) Homogenous model; (c) Locally heterogeneous model
Microscopic cross-sections are generated using fluxvolume homogenization techniques by simulating the heterogeneous core with predicted compositions through CE calculations.This procedure simultaneously produces the microscopic cross-sections of heavy nuclides, structural nuclides, and key fission products from all core materials.For the core transport calculation in Stage 2, 33-group total(σt), absorption (σa), fission production (νσf), scattering multiplicity (σs), and fission emission spectrum (χ) microscopic cross-sections are employed.The scattering multiplicity equips OpenMC’s multi-group mode with the requisite data for accurate treatment of scattering multiplication(specifically, (n,xn) reactions).This data also elucidates how this multiplication varies based on both incoming and outgoing neutron energies.
In OpenMC [15], the angle-independent macroscopic cross-section Σx,i,k,gfor a nuclideiin spatial regionkand energy domain [Eg—1,Eg], is determined by the ratio of group-wise reaction rates 〈Σx,i,ψ〉k,gto fluxes 〈ψ〉k,gas measured by the track-length estimators.
Scattering data is represented through a Legendre expansion.For consistency, the scattering matrix is derived as the product of the scattering cross-sections Σs,i,k,g, which are determined by the track-length estimator, and the group-togroup probabilitiesPs↕,i,k,g′→g:
where the scattering probability matrix is computed from analog tallies:
This consistent formulation of higher-order scattering ensures that exact preservation of the reaction rate balance,as other cross-sections are determined using a track-length estimator.Additionally, the formulation takes into account the scattering multiplicity effect, capturing the effect of neutron multiplication stemming from (n,xn) reactions.
The fission spectrum is obtained by using:
Traditionally, both the rate and flux are tallied across the entire angular space, leading to MGXS that are independent of the incident neutron angles.This approach is commonly referred to as the flux separability approximation (FSA)[22].However, when there is correlation between angle- and energy-dependence of the neutron flux, the FSA can potentially introduce significant errors [22].OpenMC offers a more rigorous approach by generating angle-dependent MGXS data,essentially providing MGXS data that explicitly relaxes the constraints of the FSA.For a given angle bin ω, the MGXS are defined as:
Utilizing angle-dependent MGXS data to relax the constraints of the FSA has been shown to enhance accuracy, especially in 1-D and 2D symbolic problems [22].In this paper,we will probe the effects of FSA on MC transport within a 3D realistic fast reactor core.Herein, the term 1-angle scheme denotes that MGXS is generated under the FSA.In contrast,the 32-angle scheme signifies MGXS generation that relaxes FSA, achieved by evenly dividing the angle into 8 azimuthal and 4 polar angles.
Given this setup, the nuclide-specific microscopic crosssection is formulated as:
Under this definition, parameters such asσt,σa,νσf,σs,and χ of all nuclides are computed.Additionally, we account for the radioactive captureσcandκσfof all heavy nuclides throughout the core.For the remaining reactions and nuclides,1-group microscopic cross-sections are utilized during the depletion calculation in Stage 3.
Gamma heating constitutes a significant portion of the core's power.Gamma-heating values are derived from gamma KERMA values and gamma production cross-sections, as generated by the multi-group cross-section generation code[23, 24].In the multi-group transport calculation detailed in Sect.2.2 , only kappa-fission (Hkappa) fors flux normalization.The normalization factor (fMG) is determined as:
WhileHkapparepresents the recoverable energy from fissions, energy contributions from neutron heating and secondary photons are also vital.Within OpenMC's CE depletion scheme, normalization relies on localized heating(Hlocal), which accounts for indirect energy, such as neutron heating and energy from secondary photons, are taken into account.In CE calculation, the normalization factor (fCE)is obtained by diving the core power (P) by the observed heating rate (Hlocal):
TheHkappais typically less thanHlocal, its normalization can introduce errors.Consequently, we tally bothHlocalandHkappafor the entire core.Their ratio serves as a heating correction factor (HC) during the core calculation stage.
The amended normalization factor in the MG stage becomes:
Other tallies, for instance, the flux, undergo multiplication by the normalization factor to render values in conventional units.Therefore, a flux acquired without HC is greater than one with HC.Our heating corrector method is a “global”correction approach, contrasting with gamma-heating calculations rooted in gamma data generation and distribution.The implications of heating correction are discussed further in Sects.3.1.2 and 3.1.6.
2.2 Core calculation stage
The MGMC core transport calculations rely on macroscopic cross-sections, which are formulated using multi-group microscopic cross-sections and concentrations determined during the depletion resolution phase.
The geometry for the MGMC core calculation is constructed using the CSG method.The core calculation employs both homogeneous (Homo, as depicted in Fig.3b)and locally heterogeneous (LHete, as shown in Fig.3c)modeling.In the homogeneous approach, each subassembly sector is unified into a single macroscopic zone.Despite its distinct methodology, the MG scheme retains a similar degree of geometric description freedom as the CE scheme.With the locally heterogeneous modeling, specifics such as particular fuel rods, unique experimental structures, absorbers, burnable poisons, and more are precisely defined, while other regions undergo homogenization.In this study, absorber pellets within control rods are maintained in the locally heterogeneous model.While previous research explored this modeling with deterministic codes,it necessitated finer local meshes and considerably more computational resources [21].However, the multi-group MC solver proficiently models local heterogeneity using the CSG method with only marginally increased computational demand.
Parameters such as the effective multiplication factor(keff), power distribution, and 33-group flux distribution are derived from the MG core calculations.It is assumed that the power's relative distribution mirrors the kappa-fission distribution.The flux undergoes normalization using the total kappa-fission of the entire core and the heating correction factor from the preceding phase.
2.3 Depletion solving stage
The fission and capture reaction rates for heavy nuclides are ascertained by combining the 33-group microscopic cross-sections from the MGXS generation phase with the 33-group flux from the core transport calculation phase.For other nuclides, the reaction rates are determined by merging the 1-group microscopic cross-sections with the sum of the 33-group flux.These reaction rates, in conjunction with the depletion chain, facilitate the construction of the burnup matrix necessary for solving the Bateman equation.Following this, nuclide concentrations for each depletable material are updated.
OpenMC's built-in depletion solver evaluates matrix exponentials using the Chebyshev rational approximation method [1], a technique proposed in papers by Pusa [25, 26]and later integrated into OpenMC by Romano [1].OpenMC encompasses multiple integration methods and depletion chains.This research employs the predictor method, which assumes a consistent burnup matrix over a burnup time step,across both the CE and MG schemes.The depletion chain encompasses transmutation patterns, decay data, and fission product (FP) yields, serving as crucial data for precise depletion calculations.This study utilizes two depletion chains available in OpenMC:
• Thefullchain, comprising 3820 nuclides, is sourced from the ENDF-format library.
• TheCASLchain, encompassing 228 nuclides, is derived using the VERA depletion benchmark specification and adjusted decay branching ratios for select nuclides to maintain accurate nuclide production rates.
The primary distinction between these chains lies in their FP treatment.Most FPs with shorter half-lives are excluded in theCASLchain and are assimilated into their descendant nuclides.As per [27], the computation time for the CE scheme with thefullchain is approximately double that of theCASLchain, with minimal reactivity variance.Thefullchain becomes particularly relevant when precise FP computations are requisite.
3 Results and discussions
This study emphasizes the numerical verification of the MET-1000 core, a 1000 MWth mid-sized metal-fueled SFR core, as derived from the benchmark by the OECD/NEA Working Party on Scientific Issues of Reactor Systems (WPRS) [28].This benchmark was selected due to its diverse contributions from numerous international organizations, each employing different neutronic data libraries and transport codes.This diversity ensures a comprehensive feedback derived from a broad spectrum of neutronic simulations.
Section 3.1 presents the results from the OECD/NEA benchmark.Since the OECD/NEA benchmark encompasses only one cycle, an additional verification that examines multiple cycles with a batch-wise fuel refueling scenario is detailed in Sect.3.2.
3.1 MET-1000 OECD/NEA benchmark
3.1.1 Description of benchmark
The detailed specifications for the MET-1000 can be found in Ref.[28].This model is rooted in the advanced burner reactor (ABR) core concept, which utilizes a ternary U—Pu—Zr metallic fuel.The layout of the MET-1000 core is presented in Fig.4, which encompasses 72 inner driver fuel,102 outer driver fuel SAs, 114 radial reflector SAs, 66 radial shielding SAs, and 19 control SAs.This core is grounded in current fast reactor technological know-how.Anticipated outcomes include core multiplication factors, sodium void worth, Doppler constant, effective delayed neutron fraction,average nuclide mass, and power distribution at both the beginning of cycle (BOC) and end of cycle (EOC).Excluding the effective delayed neutron fraction, subsequent discussions will explore other results from both the CE and MG schemes.The CE scheme results serve as a reference for the MG scheme, as they stem from the same modeling and nuclear data libraries, which encompass the ENDF/B-VII.1 cross-sections andfulldepletion chain.
The reference CE model of MET-1000 using OpenMC is shown in Fig.4.This representation ensures all benchmarkspecified structures are modeled without any oversimplifications.This exact model is also employed for the generation of MGXS across all zones simultaneously.The MG core simulation is undertaken with both Homo and LHete modeling, as illustrated in Fig.5.The sole distinguishing factor between the Homo and LHete models is the LHete's explicit depiction of control rods within the 19 control SAs.For bothCE and MG schemes, the cycle duration, set at 328.5 days,is evenly split into five steps.The fuel region undergoes a radial division into SA-by-SA and an axial division into 10 zones for each SA.

Fig.5 (Color online) Layout of homogenous (a) and locally heterogeneous (b) model for multi-group Monte-Carlo core calculation
3.1.2 Reactivity
For the MET-1000 OECD/NEA benchmark, data from eight institutions yielded 20 distinct results.The core multiplication factor (keff) and the burnup reactivity swing (ΔρBU)derived from the OpenMC CE and MG modes are juxtaposed with the OECD/NEA outcomes in Table 1.The ΔρBUis defined as:
The OECD/NEA benchmark results exhibit an approximate deviation of 750 pcm in the multiplication factor and 422 pcm in the burnup reactivity swing.These discrepancies can be attributed to variations in simulation methodologies,model descriptions, and nuclear data libraries.All MG mode results from OpenMC align with the OECD/NEA findings within a single standard deviation.However, thekeffof the CE scheme at EOC extends beyond the deviation range specified in the OECD/NEA report.This divergence might arise from updates in nuclear data libraries and nuances in modeling details.In this study, by contrasting the MG scheme with the CE scheme, we mitigate the effects of modeling precision and nuclear data library variations.This approach provides a more fitting validation for the MG scheme proposed herein.
As illustrated in Fig.6, employing the MG scheme with FSA results in an overestimation of core reactivity by approximately 1125 pcm at the BOC.By utilizing the 32-angle MGXS data, this overestimation reduces to 425 pcm.Notably, the angle-dependent MGXS data enhances the multiplication accuracy by approximately 700 pcm for the MET-1000 core.
By the EOC, there is a further rise in the overestimation of core reactivity with burnup: approximately 150 pcm for the 1-angle approach and 80 pcm for the 32-angle approach.This discrepancy in thekeffprediction also influences the reactivity swing, leading the MG scheme to underestimate the burnup reactivity loss, as highlighted inTable 1.The underlying causes of this deviation in burnup reactivity prediction will be explored subsequently.

Table 1 Core reactivity in MET-1000 OECD/NEA benchmark

Fig.6 Trend of multiplication factor in MET-1000 OECD/NEA benchmark
It is noteworthy that thekefffrom the Homo scheme is approximately 40 pcm lower than that from the LHete scheme.This difference arises due to the Homo scheme's overestimation of the control rod's absorption capacity(refer to Sect.3.1.3).However, the difference between the Homo and LHete schemes concerning burnup reactivity is minimal.
Table 2 provides a summary of the sensitivity of burnup reactivity swing across various scheme configurations.The designation 1-angle & Homo & woHC represents results obtained without incorporating heating correction.In the context of the MET-1000 core, the normalization factor,when determined by the total kappa-fission, is 1.04 times that of the factor derived from the total heating-local.As a result, the option without heating correction (w/oHC) overestimates burnup by approximately 4%.This translates to a rough effect of approximately |—2492 × 4%|≈100 pcm in the burnup reactivity swing.Although thew/oHC option minimizes the discrepancy in burnup reactivity swing, it is a blend of multiple biases.The impact of thew/oHC option on concentration prediction will be further explored in Sect.3.1.6.
Two primary sources contribute to the variation in the prediction of burnup reactivity swing:
(1) At the BOC, disparities in flux distribution and the spectrum between the MG and CE schemes can result in differences in reaction rates.This, in turn, affects the prediction of concentration distribution at the EOC.To validate this influence, the MG scheme is assessed with the EOC concentration deduced from the CE scheme.As evident from the 1-angle&LHete&CEConc and 32-angle&LHete&CEConc entries in Table 1, the EOC concentration from the CE scheme reduces the discrepancy in burnup reactivity swing by 88 and 53 pcm, respectively.
(2) The assumption in this paper is that cross-sections remain constant with burnup.This approximation can introduce variations in the predicted core reactivity.To verify this, MG core calculations at both BOC and EOC are performed using corresponding BOC and EOC MGXS data.For the 32-angle & LHete case, theBOC MGXS data introduces a reactivity increment of approximately 24 pcm from 1.03366 to 1.03390, amplifying the BOC bias.Employing “variable” MGXS data ameliorates the burnup reactivity prediction by approximately 30 pcm.Although the subsequent discussions utilize burnup-independent MGXS, the influence of burnup on MGXS warrants further examination in different reactor contexts.

Table 2 Sensitivity of core reactivity to scheme options in MET-1000 OECD/NEA benchmark
When these two factors are accurately addressed, the 32-angle&LHete&CEConc&VarXS displays a negligible deviation from the reference value.
3.1.3 Control rod worth
The worth of the control rod, denoted as ΔρCR, is calculated based on the difference in core reactivity when all control rods are fully withdrawn (positionzout, at the top of the fissile zone) versus when they are fully inserted (positionzin,at the bottom of the fissile zone):
Table 3 displays the worth of the control rod at both the BOC and EOC.According to the MET-1000 OECD/NEA benchmark, control rods are treated as non-depletable.The observed increase in control rod worth primarily stems from changes in the power/flux distribution as illustrated in Fig.7.All results from OpenMC, whether derived from the CE or MG modes, align within one standard deviation of the OECD/NEA results.
Comparing schemes, the homogeneous (Homo) model overestimates the control rod worth by approximately 5.3%relative to the CE scheme.Transitioning to the locally heterogeneous (LHete) model reduces this overestimation to 1.4%.These findings bear resemblance to those from MG calculations in the CEFR, a 65 MWth UOX experimental reactor[17] For the increase in control worth, the Homo and LHete schemes overestimate by approximately 85 pcm and 48 pcm,respectively.Relaxing the FSA slightly refines the results for the LHete scheme but seems to have minimal impact on the Homo scheme.

Table 3 Control rod worth in MET-1000 OECD/NEA benchmark (unit: pcm)
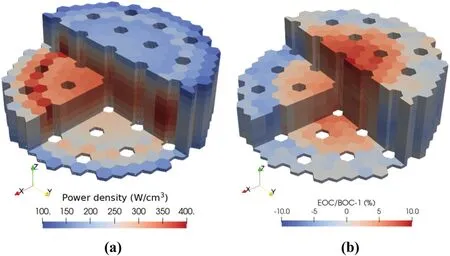
Fig.7 (Color online) 3D power distribution at BOC (a) and power variation at EOC (b)from continuous-energy Monte-Carlo simulations in MET-1000 OECD/NEA benchmark
3.1.4 Sodium void worth and Doppler constant
The sodium void worth is a crucial safety parameter for studying the core physics of fast reactors.Within this benchmark,the sodium void worth is characterized by the difference in reactivity between sodium voided and normal states as follows:
where the subscripts void and normal denote the sodium voided and normal states, respectively.The benchmark defines the sodium voided state by voiding all sodium within the fissile zones.For the MET-1000, the sodium void worth is positive and tends to increase with burnup.
In our approach, the sodium void worth is calculated using the same MGXS microscopic library as the normal state.However, during the macroscopic library homogenization process,23Na is set to zero.All results from OpenMC,in both the CE and MG modes, align within one standard deviation of the OECD/NEA results.The 1-angle scheme exhibits an overestimation of the sodium void worth by approximately 110 pcm, whereas the 32-angle scheme underestimates by approximately 22 pcm.There is a noticeable 132 pcm difference arising from the FSA.The disparity between the LHete and Homo schemes remains minimal(Table 4).
The Doppler constant, vital for understanding reactor behavior under varying temperatures, is defined as follows:
where the subscript high refers to the perturbed core state.As per the OECD/NEA benchmark, the heightened fuel temperature is double the standard, equating to 1614 K.It is essential to note that this temperature might exceed the fuel's melting point [29], thus its use is strictly for numerical benchmarking purposes.
In our methodology, MGXS data for all structural components in perturbed states are regenerated based on the respective elevated temperatures.The Doppler constant comparisons are available in Table 5.Both the CE and MG scheme results comply with the OECD/NEA outcomes within a standard deviation.At the BOC, the MG results are in line with the CE outputs, also within one standard deviation.While the Doppler constant diminishes with burnup according to the CE scheme, only the 32-angle MG scheme accurately predicts this trend.In contrast, the 1-angle scheme tends to underestimate the Doppler constant's variation.

Table 4 Sodium void worth in MET-1000 OECD/NEA benchmark (unit: pcm)

Table 5 Doppler constant in MET-1000 OECD/NEA benchmark (unit: pcm)
3.1.5 Power distribution
The 3D power distribution of the MET-1000 core, as determined by the CE schemes, is depicted in Fig.7.Normalizing using the heating-local method reveals an average volume power density of 272.6 W/cm3in the active zone.At the BOC, the peak and minimal power densities are 397.0 W/cm3and 133.4 W/cm3, respectively.By the EOC, these values change to 385.6 W/cm3and 133.0 W/cm3The highest power density is observed in the outermost ring of the inner fuel zone.
Figure 8 illustrates the power distribution variance between the 32-angles & LHete and CE schemes.Radially, the 32-angles & LHete approach tends to overestimate power density in outer regions and underestimate it in the inner regions.Axially, the upper zones show pronounced overestimation, whereas the lower zones indicate significant underestimation.The underlying reasons for this systematic disparity merit further investigation.

Fig.9 (Color online) Histogram of difference between multi-group and continuous-energy schemes in power density at BOC (a) and EOC (b) in MET-1000 OECD/NEA benchmark
Figure 9 presents histograms of the relative difference between MG and CE schemes.The relative difference lies within a range of ± 6%.The average statistical standard deviation of this difference is approximately 0.5%.Both BOC and EOC show similar patterns.We used the relative root mean square error (RRMSE) to assess the performance of our models, calculated as follows:

Fig.10 Concentration of fission products at EOC in MET-1000 OECD/NEA benchmark.Remark: woHC indicates the results without heating correction
wherepdenotes thepower density in regionias predicted bytheMGsolver,pis the power densityin regioniaccording to the CE solver, andpCEis represents the average power density.The computed RRMSE values for various approaches range between 1.85% and 2.06%.
3.1.6 Concentration
Figure 10 presents the concentration of fission products(FPs) derived from the CE scheme.Over a single cycle, FPs accumulate to approximately 1.23 × 10²¹atoms per cm3in the metallic fuel.When excluding the heating-local correction, the MG scheme overpredicts FPs accumulation by approximately 4.2%, attributable to the overestimation of fuel burnup.Both the control rod geometry and relaxing of FSA have minimal impact on FP accumulation.With the exception of europium (atomic number = 63), the discrepancy between the MG and CE schemes for individual elements remains within ± 0.5% when heating correction is applied.For the top 50 FP nuclides, this nuclide-specific variance is less than or equal to ± 1.0%.
Figure 11 illustrates the relative difference in concentrations of heavy nuclides.Without heating correction, this difference spans from —1.7% to 7.7%.Applying heating correction significantly refines these differences, bringing them to a range of —0.3% to 3.1% for the 1-angle scheme.Key nuclides such as235U,238U,237Np,238~242Pu,241Am,242mAm, and243Am exhibit discrepancies of less than 1%.However, there is a 2% to 3% overestimation for243Pu,244Pu,242Am,244Am, and curium.The 32-angles schememarginally corrects this overestimation, but the cause of the overestimation warrants further exploration.

Fig.11 Concentration of heavy nuclides at EOC in MET-1000 OECD/NEA benchmark.Remark: woHC indicates the results without heating correction

Fig.12 (Color online) Difference in concentration SA-by-SA of 238U (a) and 239Pu (b) at EOC in MET-1000 OECD/NEA benchmark (MG/CE-1 in unit %)
Figure 12 depicts the differences in the SA-by-SA distribution of concentrations for238U and239Pu.The variation in238U concentration lies between —0.1% and 0.06%.For239Pu, the range spans from —0.15% to 0.10%.There is an overestimation of concentration in the inner regions and underestimation in the outer regions.This discrepancy corresponds to the power bias illustrated in Fig.8.Due to reduced power in the inner region, there is less consumption of238U and239Pu throughout the cycle.
3.2 MET-1000 refueling benchmark
3.2.1 Description of benchmark
Fuel management in fast reactors offers several choices.Batch loading involves replacing a portion of irradiated fuel with new fuel at regular intervals.After several refuelings,the reactor can achieve an equilibrium fuel cycle with core characteristics similar to the previous cycle.While batch loading is crucial for fast reactor designs such as integral fast reactors, its accurate modeling is challenging due to the strong space and time dependencies.This scenario requires intricate 3D whole-core neutronics [30] calculations The simulation of refueling is required for several cycles, and thus a mass of neutron transport and depletion calculations are required.Accurate prediction of reactivity, feedback coefficients, compositions, and power distribution in the refueling process is key to evaluating reactor performance.While the OECD/NEA benchmark divides the fuel into simple inner and outer zones with five axial subzones, refueling benchmarks scatter fuels with varying burnups.Thus, in addition to the one-cycle benchmark, this work introduces a multiple-cycle batch loading refueling benchmark.

Table 6 Fresh fuel composition in MET-1000 refueling benchmark (unit: atoms/cm3)

Fig.13 (Color online) Fuel batch map in MET-1000 refueling benchmark
This benchmark adopts the MET-1000 OECD/NEA core's geometry and structure.The initial cycle uses fresh fuel (composition in Table 6), with each cycle lasting 328.5 EFPD.About a fifth of the fuel is replaced with fresh fuel in each cycle, as depicted in Fig.13.The refueling map of Fig.13, designed for this work, ensures there is no local power peak from adjacent fuel SAs from the same batch.Due to computational demands, this benchmark uses theCASLchain with one step per cycle for depletion calculations.This choice has minimal impact on the discussed results, but its influence on other metrics, such as decay heat or radioactivity, requires further study.Expected results and definitions align with the OECD/NEA MET-1000 benchmarks.
In practical scenarios, it is imperative that the fuel composition and structural arrangement are meticulously designed.This ensures that the core maintains its criticality throughout each cycle, requiring minimal excess reactivity.Between the shutdown for refueling and subsequent startup, there is a cooling period during which nuclides persistently decay.Transitioning a new core to its equilibrium cycle is intricate.The multi-cycle reloading study presented here serves as a representative model, emphasizing the pronounced spatial and temporal dependencies in neutronics modeling.
3.2.2 Reactivity
Figure 14 presents the variation of reactivity based on the CE calculation alongside the discrepancies between the MG and CE schemes.As fuel undergoes burnup, the core reactivity diminishes, experiencing surges with each refueling.After five cycles, each fuel SA within the core undergoes refueling at least once, leading to the establishment of an equilibrium state.As the transition to this state occurs, the overestimation of the MG schemes in core reactivity amplifies.This is attributed to accumulating differences in concentration (discussed in Sect.3.2.6) and the compounded effects of the constant XS assumption.In an equilibrium cycle, the 1-angle MG scheme overestimates core reactivity by approximately 1204 pcm and the burnup reactivity loss by approximately 85 pcm; utilizing the 32-angle scheme reduces these overestimations to 494 pcm and approximately 59 pcm, respectively.
3.2.3 Control rod worth
Figure 15 illustrates the variation in control rod worth based on the CE scheme, as well as the differences between the MG and CE schemes.As we transition to the equilibrium cycle,the control rod worth escalates from 16,356 pcm to approximately 17,202 pcm.This increase is attributed to fluctuationsin burnup distribution and, consequently, flux distribution.The 1-angle&Homo scheme consistently overestimates reactivity, with values ranging between 851 and 972 pcm across 15 cycles.However, using the 1-angle&LHete scheme narrows this overestimation to between 179 and 280 pcm.Further refinement using the 32-angle&LHete scheme minimizes the overestimation even more, bringing it down to a range of 117 to 227 pcm.

Fig.14 Trend of core reactivity in MET-1000 refueling benchmark

Fig.15 Trend of control rod worth in MET-1000 refueling benchmark

Fig.16 Trend of sodium void worth in MET-1000 refueling benchmark
3.2.4 Sodium void worth and Doppler constant
Figure 16 delineates the variation in sodium void worth based on the CE scheme and contrasts it with the differences observed between the MG and CE schemes.Starting from 2,251 pcm in a pristine core state, the sodium void worth ascends to approximately 2,485 pcm upon reaching an equilibrium state.The 1-angle&Homo scheme tends to overestimate the sodium void worth, with deviations ranging from 6 to 48 pcm.Notably, the LHete has a minimal impact on predicting the sodium void worth, given that the control rods in this study are in an 'out-of-core'configuration.A more in-depth exploration is needed to understand the influence of control rod geometric heterogeneity on feedback coefficients during insertion depths.The 32-angle schemes, on the other hand, tend to underestimate the sodium void worth, with deviations ranging from —56 to —108 pcm.The discrepancy between the 32-angle and 1-angle schemes fluctuates between 98 and 148 pcm, a pattern that aligns closely with the findingsfrom the OECD/NEA MET-1000 benchmark (as discussed in Sect.3.1.4).
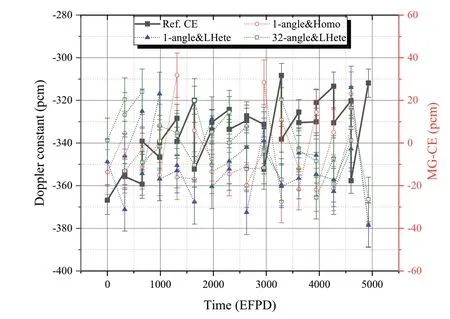
Fig.17 Trend of Doppler constant in MET-1000 refueling benchmark
Figure 17 contrasts the variation of the Doppler constant as determined by the CE calculation with the differences observed between the MG and CE schemes.The Doppler constant exhibits a statistical deviation of approximately 7 pcm, while the difference has a deviation of approximately 10 pcm.The Doppler constant ranges from—308 to —367 pcm, and the difference fluctuates between—38 and 31 pcm.However, the statistical uncertainty is significant, rendering it challenging to make direct comparisons between the MG schemes.
3.2.5 Power distribution
Figure 18 illustrates the variation of the form factor in relation to refueling.Defined as the ratio of the maximum power density to the average power density, the form factor's resolution for maximum power is determined SA-by-SA radially and segmented into 10 axial subzones.From its initial value of 1.51 in a fresh core state, the form factor ascends to approximately 1.60 when the core reaches its equilibrium state.Notably, within each equilibrium cycle, the form factor experiences an increase from the BOC to the EOC.The discrepancy between the MG and CE schemes ranges from—2.5% to 4.0%, with a RRMSE in power density distribution of approximately 2.2%.

Fig.18 Trend of form factor in MET-1000 refueling benchmark

Fig.19 (Color online) Power distribution at BOC of 15th cycle (a) and the relative difference between 32-angles&LHete and continuous-energy scheme(b) in MET-1000 refueling benchmark
Figure 19 depicts the power distribution at the BOC for the 15thcycle.In the equilibrium state, fuels at various burnup levels are distributed sporadically.A notable highpower density can be observed at the core center and at the interface between the inner and outer core.The peak power is most pronounced in the fresh outer fuel (as illustrated in Batch #5 in Fig.13) situated near the outermost control rods.The disparity between the MG and CE schemes mirrors the patterns observed in the OECD/NEA benchmark,as indicated in Fig.8.However, this pronounced variation from the center to the periphery is disrupted by the uneven distribution of fuel burnup.
3.2.6 Concentration
Figure 20 presents the variations in FPs and key actinide elements as they relate to refueling.As discussed in Sect.3.1.6,the LHete and FSA have a negligible impact on concentration predictions.Hence, only the results corresponding to the 1-angle&LHete configuration are illustrated in Fig.20.As the system transitions to the equilibrium cycle, discrepancies between the MG and CE accumulate with burnup.In equilibrium cycles, these discrepancies fluctuate, becoming more pronounced at the EOC compared to the BOC.The largest concentration differences for U, Pu, and Am remain below 0.5%.However, Np exhibits the most significant discrepancy, with a difference reaching —2.31%.
Table 6 highlights that the primary isotope of uranium is238U and with its variations and discrepancies furtherdetailed in Fig.20.Figure 21 provides a nuanced breakdown of the differences in transuranium nuclide concentrations.The MG scheme tends to underestimate the concentration of237Np by approximately -2.6% throughout the equilibrium cycle.Except for241Pu, the discrepancies for the main plutonium nuclides stay below 0.5%.The242Am discrepancy, at approximately 2.4%, emerges after the 1st cycle of irradiation and remains relatively stable thereafter.Given its short half-life and considerable absorption cross-section,242Am reaches a saturation concentration under irradiation.The continuous irradiation refueling scheme adopted in this study results in a stable discrepancy in the242Am concentration.Apart from242Am, concentration discrepancies for other americium isotopes stay under 0.6%.

Fig.21 Trend of transuranium nuclides in MET-1000 refueling benchmark.Remark: The solid line indicates concentration,while the dotted line indicates MG/CE-1

Table 7 Computational time for refueling benchmark (unit:CPU·hour)
3.2.7 Computational time
Table 7 lists the computation time required for a single refueling simulation in its standard state.The process involves 30 transport calculations and 15 depletion calculations.Each transport calculation is configured with 100 inactive batches, 400 active batches, and 50,000 particles per batch.The time consumption between the homogenous and locally heterogeneous models is almost identical.Using the CASL chain, the computation time is reduced to 66% compared to thefullchain.If the CASL chain is utilized, the 1-angle MG scheme reduces computation time by 86% when compared to the CE scheme.The angular-dependent MG scheme demands more computation time primarily due to core calculations.
The flux-moment homogenization techniques, as discussed in [31], can effectively calculate the impact of angle dependence while maintaining the 1-angle MGXS data format in the multi-group core calculation.Most of the computation time during core calculation is allocated to macroscopic cross-section preparation and particle transport simulation.Nonetheless, the macroscopic cross-section preparation module can be further optimized using parallel computing techniques.
It should be noted that the MG scheme will save more computation time if there are more core calculation cases,such as the optimization of fuel batch strategies, the insertion of control rods at different levels, the perturbation in certain nuclide concentrations, coupling with multiphysics analysis, and so on.In comparison to the Homo models predominantly utilized in the deterministic method, the LHte scheme would improve the depletion calculation of structures with complex or dramatic changes in flux level and spectrum, such as moderators [32], control rods, transmutation targets [33], and burnable poisons [34], which warrant further investigation.
4 Conclusion
This paper presents the development and verification of a MG depletion calculation scheme using OpenMC.The MGXS for core transport calculation derive from a 3D whole-core CE analysis.Depletion calculation cross-sections are synthesized from 3D core MGXS and 2D subassembly single-group cross-sections.Using this framework,we delved into locally heterogeneous core modeling and FSA.The MG scheme's validity was ascertained using a 1000 MWth metal-fueled fast reactor from the OECD/NEA benchmark and a refueling benchmark introduced in this paper.Metrics such as core reactivity, burnup reactivity swing, control rod worth, sodium void worth, Doppler constant, power distribution, and nuclide concentrations were compared against the CE depletion scheme.
In equilibrium cycles, the MG scheme, incorporating FSA, overestimates core reactivity by approximately 1150 pcm.Introducing a 32-angle relaxation diminishes this overestimation to approximately 450 pcm.The MG scheme with FSA presents a 150 pcm discrepancy in burnup reactivity swing due to biases in power distribution and microscopic cross-sections' burnup variation.The 32-angle relaxation reduces this discrepancy to 50 pcm.
For control rod worth, the MG scheme with homogeneous core modeling overestimates by approximately 5.3%.However, adopting a locally heterogeneous model reduces this to 1.4%.In the OECD/NEA benchmark, the FSA's impact on sodium void worth prediction is negligible, showing only a minor 20 pcm discrepancy.On the contrary, FSA overestimates sodium void reactivity by approximately 120 pcm compared to the relaxed spectrum adjustment.Differences in the Doppler constant remain minimal, oscillating between -40 and + 30 pcm over 15 cycles in the refueling benchmark.
The relative disparity in power distribution stays within a ± 6% range.Differences between the MG and CE schemes in peak power density range from —2.5% to 4.0% during the refueling benchmark’s 15 cycles.Concentration discrepancies remain within ± 0.5% for most elements in the OECD/NEA benchmark, with europium being a notable exception.For the top 50 FP nuclides, the disparity between MG and CE methods remains within ± 1.0%, a precision that persists in the refueling benchmark.
Broadly, the MG scheme employed in this research performs commendably for the MET-1000 metal-fueled fast reactor.It showcases versatility in modeling locally heterogeneous structures, maintaining consistency with the CE scheme.The locally heterogeneous approach holds promise for accurately addressing areas with stark neutron flux and spectrum changes.Future endeavors will explore innovative homogenization techniques to enhance FSA accuracy.We also preliminarily validate OpenMC's capability for MGXS generation from whole-core modeling.Its integration with deterministic core transport calculation codes warrants further scrutiny.While our verification focuses on a mediumsized metal-fueled fast reactor, the scheme's precision in other reactor types, given their distinct burnup characteristics [35—37], necessitates additional validation.
Acknowledgements The computations in this paper were run on the π 2.0 cluster supported by the Center for High-Performance Computing at Shanghai Jiao Tong University.
Author contributions All authors contributed to the study conception and design.Material preparation, data collection and analysis were performed by Hui Guo, Yi-Wei Wu, Qu-Fei Song, Yu-Yang Shen, Han-Yang Gu.The first draft of the manuscript was written by Hui Guo and all authors commented on previous versions of the manuscript.All authors read and approved the final manuscript.
Data availability The data that support the findings of this study are openly available in Science Data Bank at https:// www.doi.org/ 10.57760/ scien cedb.j00186.00229 and https:// cstr.cn/ 31253.11.scien cedb.j00186.00229.
Declarations
Conflict of interest The authors declare that they have no competing interests.
杂志排行
Nuclear Science and Techniques的其它文章
- Effective extraction of photoneutron cross-section distribution using gamma activation and reaction yield ratio method
- Gravitational wave echoes from strange quark stars in the equation of state with density-dependent quark masses
- Pseudo-rapidity distributions of charged particles in asymmetric collisions using Tsallis thermodynamics
- Pairing effects on the fragment mass distribution of Th, U, Pu, and Cm isotopes
- Dynamic evaluation of a scaled-down heat pipe-cooled system during start-up/shut-down processes using a hardware-in-the-loop test approach
- A method for correcting characteristic X-ray net peak count from drifted shadow peak