Study on damage-stress loss coupling model of rock and prestressed anchor cable in dry-wet environment
2024-01-07YuZhoHusuWngJingBiZhijunWuCholinWngJio
Yu Zho ,Husu Wng ,Jing Bi, *,Zhijun Wu ,Cholin Wng ,Jio M
a College of Civil Engineering,Guizhou University,Guiyang 550025,China
b School of Civil Engineering,Wuhan University,Wuhan 430072,China
Keywords:
ABSTRACT The loss of anchoring force is one of the problems to be solved urgently.The anchorage loss is a key factor causing the failure of anchoring engineering,so it is crucial to study the time-dependent variation of anchoring force.Alternating dry and wet (D-W) conditions have a significant effect on deformation of rock.The anchoring system is composed of anchoring components and rock mass,and thus rock deformation has a significant impact on the loss of anchoring force.Quantifying rock deformation under the effects of D-W cycles is a prerequisite to understanding the factors that influence loss of anchoring force in anchor bolts.In this study,we designed an anchoring device that enabled real-time monitoring of the variation in strain during D-W periods and rock testing.Nuclear magnetic resonance (NMR) measurements showed that under D-W conditions,the increment in porosity was smaller for prestressed rock than unstressed rock.The trends of prestress loss and strain variation are consistent,which can be divided into three characteristic intervals: rapid attenuation stage,slow attenuation stage and relatively stable stage.At the same stress level,the rate of stress loss and strain for the soaking specimen was the highest,while that of the dried specimen was the lowest.In the same D-W cycling conditions,the greater the prestress,the smaller the strain loss rate of the rock,especially under soaking conditions.The characteristics of pore structure and physical mechanical parameters indicated that prestress could effectively suppress damage caused by erosion related to D-W cycles.The study reveals the fluctuation behavior of rock strain and prestress loss under D-W conditions,providing a reference for effectively controlling anchoring loss and ideas for inventing new anchoring components.
1.Introduction
Prestressed anchor cables play an important role in controlling the deformation and improving the stress state of rock and soil masses in slope engineering,tunnel engineering,and foundation pit engineering projects.The anchoring force is a factor that directly determines the effect and safety of engineering reinforcement.The loss of anchoring force increases with time,and this is affected not only by anchor cable materials,construction and rock-soil properties but also geological environment,climate and human factors [1,2].Careful tracking of the positions of rock bolts is extremely significant,as it assists in monitoring anchor rod deformation and rock mass stability and has applications in predictive maintenance practices [3,4].Therefore,it is essential to study the mechanism of the interaction between anchor cables and rocksoil masses to control and solve problems related to loss of anchor force.
Many projects have demonstrated that the loss of anchoring force of anchor cables is the direct cause of the instability of anchor structures.Some scholars have established a model to predict the shift in anchoring force in anchoring structures based on variations in data during long-term monitoring by intelligent sensors [5,6].Damage of anchor cables and prestress loss were analyzed according to monitoring data from construction to operation of actual projects.The actual fundamentals of these models were derived mostly from data and experience,and thus the structure of the rock mass,geological conditions and regional climate of the projects increased errors in these predictive models,which were empirical equations.However,some scholars have developed coupled creep models to predict the long-term variability of anchoring forces by applying mechanical theory to analyze in detail the strong relationship between the anchoring system and rock creep.To describe the long-term variation of the anchoring force,simple basic elements (elastic elements,plastic elements,and viscous elements)were used to model the behavior of the rock mass.Models for the prediction of the anchor force for different media were obtained by combining these basic elements in different ways.A new model of prestress loss of anchor cable was established by Shi et al.[1],and it considered the interaction between anchor cable,frame beam and rock mass.The accuracy and applicability of the new model were verified by comparing data monitored in the field with the results of calculations using the available models.Li et al.[7] constructed a relaxation equation for the coupled model;it was composed of elastic elements (anchor cable) and Bingham bodies (soil) that represented the prestress loss of the anchor cable due to different water contents.Based on the improved Nishihara rheological model of rock creep,Feng et al.[8] combined the relaxation response equation of steel strands and Hooke’s law to obtain a method to calculate the three factors related to loss of anchoring force.The validation of this calculation method showed that the theoretical values mainly coincided with the measured values.The model of prestress loss developed by Dong et al.[9] simultaneously considered the interplay between the free section and the anchor section of the anchor cable and the rock soil mass.In this model,Hooke’s body and generalized Kelvin models were used to simulate the anchor cable and the rock soil mass,respectively.Compared with the empirical equation,the coupled model adequately considered the interaction between the reinforced rock mass and the anchor cable,and the model validation demonstrated the reliability and generality of the coupled model [10,11].
A Hooke’s body is commonly used in coupled models of anchor force loss to represent the characteristics of an anchor cable.Because the factors of rock sample creep are more complex,the models representing rock samples are diversified.Considering the influence of rheological deformations of rocks in different environments,there were significant differences between many test results.
Anchor cable damage and prestress loss were analyzed according to the monitoring data from the actual project from construction to operation.The cyclic actions of wetting-drying and freezing-thawing have been regarded as causing fatigue damage to rock,which makes the long-term strength and reduction factor of rock creep decrease as the number of cycles increases [12].Under different water content conditions,the creep elastic modulus of the rock decreased with increasing water content,and other parameters were altered [13].As the water content increases,it promotes the initiation and propagation of cracks,increases damage,and accelerates creep failure in rock[14].In a chemical corrosion environment,the degree of damage is significantly greater for anchor cable (metal material) than rock.This commonly causes degradation of the strength of the interface between anchor cable and mortar,which reduces the anchoring force and weakens the transmission of anchoring force[15].Corrosion in a corrosive environment is also considered to be the reason for the decline in anchoring system performance and the loss of anchoring force[16].The effects of temperature typically change the physical and mechanical properties and parameters of rock,causing damage to the rock and accelerating creep deformation until failure [17].
Researchers at home and abroad have made extensive research on prestress loss of an anchor cable.However,many researchers choose to focus on the influence of a single environment on the anchor cable reinforcement effect.Conventional empirical equations do not take into account the deformation factor of the rock mass,and coupled models neglect the complex environment and stress and deformation of the rock mass.Therefore,an intensive study on the anchoring loss behavior considering D-W damage and various stress levels is necessary to obtain a better understanding of the time-varying law of anchoring loss in complex environments.
This study mainly studied the change law of rock anchorage and prestress under the action of D-W cycle.A home-built prestressed device was used to collect deformations of the rock under D-W cycles.The coupling effects of rock deformation and prestress have been investigated based on physical and mechanical experimental data at various pressures.In this basis,the D-W cyclic damage evolution factor was first proposed,followed by the deformation coordination equation,and finally the anchor bar prestress loss was calculated.We have discussed the dynamic behavior of prestress loss in D-W cycles and the effectiveness of rock erosion resistance under different prestress conditions.The research results can lay a good foundation for the further development of new anchoring devices for dynamic prestress loss.
2.Conceptual experimental
2.1.Stress analysis of anchored rock mass
For prestressed anchor bolts,the free section passes through the rock and soil body whose surface is not bonded in the free segment;however,the anchor body is embedded in the rock-soil mass in the anchorage segment.Hence,the effect of the anchorage-force variations on the creep coupling between the anchor bolts and rock-soil mass in the free segment differs from that in the anchorage segment.In terms of stress and deformation,the external forces on rock-soil mass,except for the initial stress,are the same as the prestressed force on the anchor cable.The anchored section undergoes shear sliding of the surrounding rock-soil due to interface frictional resistance under tensile load,which belongs to shear creep deformation (Fig.1a).The rock-soil mass located within the free section is constrained by the anchor cable prestress,and thus the deformation of the free section in the anchor cable is equal to the creep deformation of the rock-soil mass,belonging to compressive creep deformation(Fig.1b).Most of the D-W erosion in nature acts on shallow rock-soil mass.From the analysis of the D-W environment and cable mechanics,it can be concluded that the prestress loss mainly comes from the free section of the anchor cable.
2.2.Permeability variation due to stress
This study focused on the relationships between rock anchorage and prestress during D-W cycles.As shown in Fig.1b,the radial stress (expansive force or lateral prestress) on the surrounding rock is caused by the grouting and pressure of the anchor members.The creep-strain behavior of rocks under stress is closely related to permeability.Under prestressing,rock is compressed by axial prestress along the direction in which pressure is applied.Due to limited experimental conditions,only the axial stress of the rock was considered in the experiments in this study.The D-W cycle soaking condition can be viewed as influencing the effect of percolation on the creep deformations of the prestressed rock.The mechanical properties and permeability behavior of rock during loading are represented in Fig.2 [18].
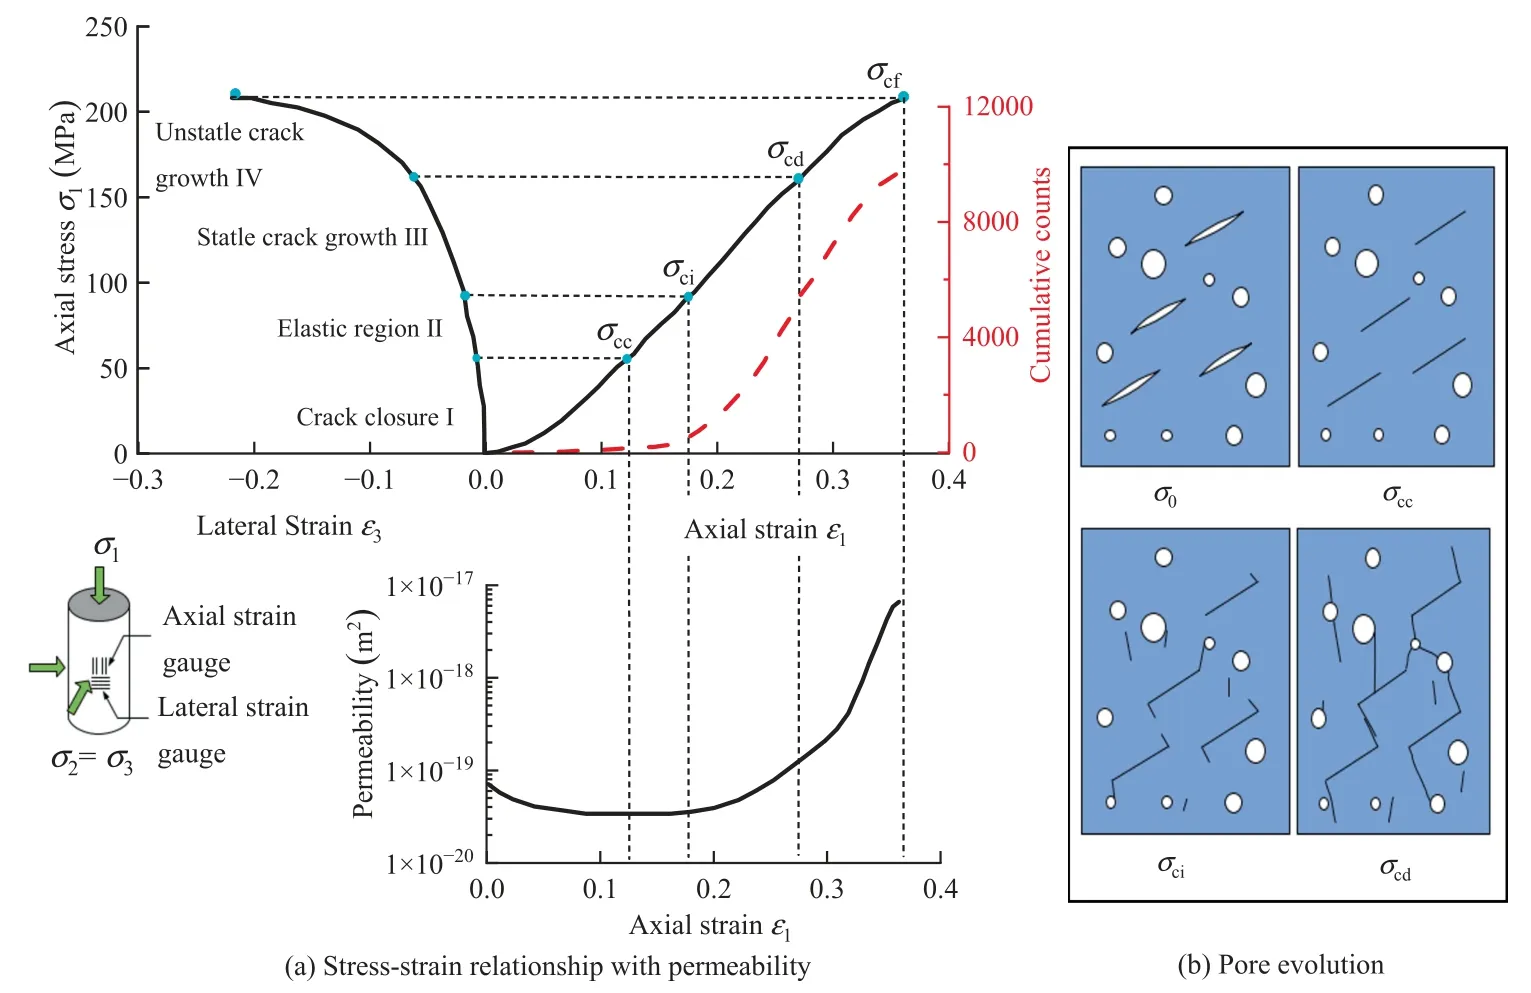
Fig.2.Schematic illustration of the progressive failure and permeability variation of a rock subjected to compressive loading [18].
According to the statistics of the compressive stress-strain curves of rock,the axial deformation is normally divided into four stages (Fig.2): (I) compaction stage,(II) linear elastic stage,(III)yield stage,and(IV)post-peak softening stage.In Fig.2,the critical thresholds for dividing stages I,II and III are σcc,σciand σcd,respectively,and σcfis the peak strength of the rock sample.The complex variation in seepage during loading is considered.In stage I,due to compression cracks and pores (seepage path compression),the permeability of rock samples gradually decreases at a rapid rate.The permeability tends to be stable (not equal to zero) during the linear elastic phase (II),indicating a finite degree of fracture and pore closure.In stage III,with increasing stress,the yield strength is reached,and the initiation and propagation of cracks and pores begin to intensify.The cracks connect,forming macroscopic cracks,expanding the seepage path and gradually increasing the permeability.After post-peak softening (IV,rock failure),macrocracks appear on the rock surface,providing a channel for liquid seepage,which is rapidly enhanced [19].
According to the seepage characteristics during the loading process,prestress is applied in the experiment so that a rock specimen is placed between the first and second stages and the water-rock interaction is reduced.The radial stress of the surrounding rock is caused by the grouting and prestressing of the anchoring members.The rock is compressed(axial prestress)along the prestressed direction under the action of prestress.Due to the limited experimental conditions,only the axial stress of rock was considered in the experiment.This approach is equivalent to studying rock creep characteristics and loss of anchoring force in the presence of limited permeability.
3.Experimental program
3.1.Materials and sample preparation
The rocks used in the experiment were red fine-grained sandstone from Hunan (Fig.3).The main mineral composition of the sandstone was analyzed by X-ray (Fig.3a);the rock was 63.2%quartz,35.5% albite and 1.3% calcite.The sample preparation followed the ISRM (International Society of Rock Mechanics) testing guidelines;the cylindrical samples had a diameter of 50 mm and a height of 100 mm.The experimental rock samples were selected by various means,such as D-W densities,ultrasonic waves,and mass,and samples with similar physical properties were selected.As the structure and physical properties of the test pieces were different,the uncertainty of the test pieces was reduced by screening the samples and selecting some on the basis the density and P-wave of fully saturated samples (Fig.3d).
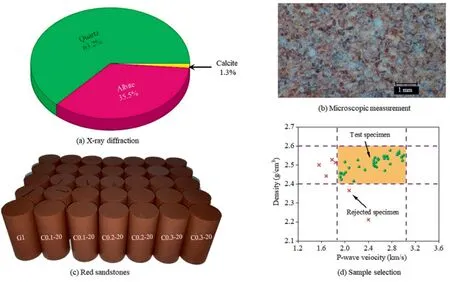
Fig.3.Sample preparation.
3.2.Experimental setup and procedures
Natural pores and microcracks develop in sandstone.After anchoring,the sizes of sandstone pore throats and microcracks alter accordingly.The evolution of pores and microcracks under D-W cycles fatigue leads to prestress loss.This study mainly simulated the damage and prestress loss of anchored rock during D-W cycles.The experimental steps were as follows (Fig.4):
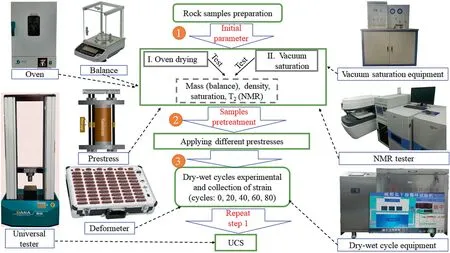
Fig.4.Flow chart of constrained rock dry-wet damage test.
(1) The mass and T2of the samples were tested in dry and saturated states.
(2) The samples were prestressed with loads of 0,0.1σsf,0.2σsfand 0.3σsfMPa.
(3) Samples were soaked in water at 25°C for 6 h and then dried at 70 °C for 6 h,which corresponded to a D-W cycle.After samples completed the set number of D-W cycles (i.e.,0,20,40,60,or 80),they were removed.The first step was repeated,and then the mechanical test was performed(Fig.5).

Fig.5.D-W experiment of prestressed rock.
(4) A certain number of the D-W cycles (i.e.,0,20,40,60,and 80)were implemented on the samples,and part of the samples were then taken out from the D-W equipment to measure their mechanical strength.
3.3.Experimental system
The experimental design was completed through the use of vacuum saturation equipment,a drying oven,an NMR instrument,D-W cycle equipment and a hydraulic servo system (Fig.4).The basic parameters of the experimental system were set as follows:
(1) Drying oven: the specimens dried at 105 °C for 24 h were considered completely dry.
(2) Vacuum saturation equipment: the completely dry specimens were placed under a vacuum for 6 h and then saturated at a hydrostatic pressure of 10 MPa for 24 h.To obtain a perfect saturation state,samples were oven-dried at 105 °C until a constant weight was reached (at least 24 h) before being saturated under vacuum.The specimens were believed to be sufficiently saturated.
(3) NMR tests: The NMR instrument was manufactured by Shanghai Newmark Technology (Shanghai,China).The parameters measured by NMR experiments were as follows:echo spacing,0.2 ms;waiting time,2000 ms;number of scans,16;echo numbers,18000;and experiment temperature,(32±0.02)°C.T2spectra were measured for completely dried and fully saturated specimens with the Carr-Purcell-Meiboom-Gill (CPMG) sequence.
(4) D-W cycle equipment: In one D-W cycle,specimens were dried at 70 °C for 6 h and wetted in 25 °C water for 6 h.A total of 80 cycles were performed,with NMR measurements and physical mechanics tests performed every 20 cycles.
(5) Static strain gauge:Full bridge,1/2 bridge,1/4 bridge(common compensation) and 1/4 bridge (strain gauge selfcompensation is the bridge connection form of strain test)were used.In this study,strain gauges with length of 5 mm,width of 2.5 mm,temperature range from -20 to 80°C,resistance value of(120+0.5)Ω and sensitivity coefficient of 2.0+0.01 were connected by a 1/4 bridge (common compensation;Fig.5) to measure the axial strain of rock.The strain gauge was mainly used to monitor rock deformation during D-W cycles.To ensure the normal operation of the strain gauge,the strain gauge working area was sealed with epoxy to prevent water seepage.
3.4.Prestressed device
The design of a device to apply a prestress and monitor the strain provided an experimental means to study the interaction between the anchoring rock and anchoring components.As shown in Fig.6a,the device was composed of four bolts and rigid splints.The diameters of the bolts were 16 mm,and the thickness of the rigid splint was 18 mm.The strain gauges numbered 1-1,1-2,1-3,and 1-4,were attached at the same height in the middle of the rigid cushion block of the four bolts.Thus,the axial strain gauge of the device was composed of bolts with a quarter-bridge set of strain gauges.

Fig.6.Homemade device and test.
Before using the device,a stiffness test and an error calibration were conducted.First,a rigid cushion block was prepared with a diameter of 50 mm and a height of 100 mm,and a force sensor with a maximum range of 50 kN was placed according to Fig.6a.After that,the stress-strain curve was measured during loading and unloading,and the stiffness of the two processes was obtained.The device should not exceed the elastic deformation range during testing and use.Finally,to accurately measure the stiffness of the device and reduce the error caused by the device and operation,five groups of tests were conducted.
Comparing the stress-strain curves during loading and unloading for device #3 showed that the fitted linear slope for loading was 0.0265(loading stiffness 26.5 GPa),and the fitted linear slope for unloading was 0.02311 (unloading stiffness 23.1 GPa).In both cases,the data points were linearly distributed,and the correlation coefficients were greater than 95%,which indicated small data dispersion,Fig.6b.This proved that the loading and unloading relationships of the four bolts of the device were fundamentally consistent.Fitting device#3 was set to load-unload the data,yielding a correlation coefficient of 94.9% that was greater than 90%(Table 1).Therefore,the loading and unloading stiffnesses were assumed to be the same as 24.4 GPa as the fitted slope was 0.0244.

Table 1 Device test parameters.
The loading and unloading data collected by the four strain gauges and force sensors of the five groups of prestressed devices are illustrated in Fig.6.Most of the data points were distributed linearly with a small amount of scatter.Due to the sensitivity of the strain gauge,there was a certain degree of fluctuation during the test.According to the test results (Fig.7 and Table 1),the regression coefficientR2of the load-strain curve was greater than 90%,and the device met the test accuracy.Stiffness tests showed that the loading and unloading rigidity of the device varied uniformly and linearly,and it can be used to measure rock prestress loss.As a result of fitting the stress-strain data of five groups of equipment,the relationship between the stress and strain of the prestressed device was obtained:

Fig.7.Linear fits of stress-strain data for devices.

Fig.8.Uniaxial stress-strain data of rock in a completely dry state (G-2,G-4) and and an entirely saturated state (0-1,0-2).
where σrand εbrepresent the force on the rock section and the bolt strain,respectively.
Compared with the perfectly dry state,the uniaxial strength(σsf) in the totally saturated rock was smaller and the strain was larger.Fig.5 shows that the strength of totally dry rock decreased by approximately 38%after being completely saturated.Regardless of the confining pressure,if the prestress was too large,then the rock easily became unstable in the water during D-W cycles.Thus,at prestress values of 0,0.1,0.2,and 0.3 times the strength(σdf) of the dry rock,no instabilities occurred under wet conditions.Under these circumstances,we chose 0,0.1,0.2,and 0.3 times the rock strength in the saturated state as the prestress values,i.e.0,0.1σsf,0.2σsfand 0.3σsfMPa.
4.Calculation model
4.1.D-W cycle damage variable
The mechanical characteristics of rock gradually attenuate as the D-W period increases.The evolution of microscopic defects inside rocks during multiple D-W cycles is quite complex,and the macroscopic physical properties of the rock can represent the degree of internal deterioration in the material.Therefore,the macrodamage mechanics method is applied to describe the microscopic damage of rock under D-W conditions.According to the damage theory proposed by Lemaitre [20],considering the elastic modulus before the drying/wetting test as the initial state and the elastic modulus afternD-W cycles as the damaged state,the elastic modulus damage variable (D) can be defined as follows,
whereE0andEnare the initial elastic modulus and elastic modulus afternD-W cycles,respectively.In contrast,the elastic modulus after different numbers of D-W cycles was obtained by Eq.(2).Therefore,Eq.(2) is rewritten as:
The difference in intensity for different microcells is caused by the random distribution of micropores and microcracks in the rock.Generally,statistical damage mechanics is used to quantify the damage of the rock interior with the micro element strength.The elastic modulus combined with the statistical damage model proposed by Krajcinovic reflects the strength (f) evolution [21],and the expression is as follows:
whereEis the elastic modulus;ξ the elastic strain;and the damage variableDthe ratio of the number of already failed microelements(Nf) to the original number of microelements (N) expressed as follows:
With the increase in the number of D-W cycles,the microstructure of rock samples exhibits three phenomena: (1) The cement gradually dissolves and the water channels enlarge;(2) The mineral grains fall off and migrate;(3) Grains are missing,and the numbers of microcracks and pores increase.In view of this behavior,the random damage of rock microelements causes a change in its micro-strain.We establish a damage relationship between the accumulated micro strain of D-W damage (dξ) and the density function of failed microelements(p(ξ)).Then the statistical damage variable can be written as:
The rock deformation of the statistical D-W cycles accumulation follows the Weibull distribution.Based on this distribution,we obtain the two-parameter probability density function of the deformation of the microscopic element.The model is as follows:
wherekand λ are parameters for the shape and size of the distribution curve,respectively.The elastic strain is a linear variable of the D-W period.The strain afternD-W cycles is given by
wheremis the material parameter of material damage evolution characteristics.Combined with Eqs.(6),(7) and (8),the expression for the damage variable obeying the Weibull distribution is obtained as follows:
where the subscriptndenotes the number of cycles andDnimplies the damage variable afternD-W cycles.Moreover,it is known from the analysis of Eqs.(2) and (9) that the ratio of then-periodic broken elastic modulus to the initial elastic modulus is as follows:
The elastic modulus ofn-cycles damage reads:
wherekand λ/mcan be obtained by fitting the experimental data.
4.2.Establishment of anchor cable rock coupled model
In the prestressed region of the anchor bolt,the rock mass undergoes creep due to its discontinuity and anisotropy,which leads to the relaxation of the anchor cable and the attenuation of the anchor force.In contrast,the loss of the anchoring force affects the creep of the rock mass,and the two affect each other[22].Thus,there is a coupling relationship between anchoring force loss and rock creep.
An anchor cable is divided into a free section and an anchor section.The prestress loss of the anchor cable caused by D-W conditions occurs mainly in the free section,which is between the anchor head end and the front section of the anchor section.Except the initial rock stress in the anchored rock mass,there is prestress along the direction of the anchor cable,which acts as a constraint on the rock (Fig.1b).The basic strengthening principle of a prestressed anchor cable is to tightly connect the rock and structure while the cable is prestressed.Therefore,in the free section,the deformation of the anchor cable is equal to the creep deformation of the rock mass,which is creep deformation under compression.In fact,the train of the prestressed anchor cable in the rock mass reaches a definite value at a certain moment,indicating that the evolution of the rock includes three states,i.e.,the instantaneous state,decelerating state,and constant state.Thus,it is assumed that:
(1) The rock deformation modulus is significantly less than the elastic modulus of the anchor cable,demonstrating that the anchor cable remains elastic for a long time during the process of operation,i.e.,prestress loading and unloading.
(2) The prestress loss caused by the construction of anchor cables and anchorages during prestress tensioning and fixation should not be considered.
4.3.Creep model of D-W damage rock
4.3.1.General Kelvin model
A constitutive model for the creep deformation of a constrained rock under D-W conditions was developed.D-W cycles cause rheological damage to rocks that can be divided into creep damage and D-W erosion damage.Based on rheological test curves,cell combinations were determined to model the rheological properties of the rock.Rock masses have complex viscoelasticity and plasticity,with different elastic,plastic,and rheological deformation characteristics under different stress conditions and environments.Typically,the generalized Kelvin model is chosen to adequately reflect the viscoelasticity of rocks.This model can not only reflect elastic deformation,but also describe creep and stress relaxation phenomena.The generalized Kelvin model is composed of Hooke bodies and Kelvin bodies (a spring element and a viscous element connected in parallel)connected in series(Fig.9).The constitutive model is simplified as follows:

Fig.9.Coupled model of the effects of D-W cycling on anchor cable and rock.
where σris the stress acting on the rock;εkthe total strain of generalized Kelvin model;andthe rates of change of stress and strain,respectively;Eethe elastic modulus of a Hoek body;ηkthe viscosity;andEnkthe elastic modulus of a Kelvin body afternD-W cycles.
With the increase in number of D-W cycles,soluble minerals in the rock soften,expand,and dissolve,causing the elastic modulus,friction coefficient,and internal friction angle of the rock to decrease [23].Enkunder D-W conditions is defined as:
whereE0is the elastic modulus of rock without dry/wet-creep test.It is believed that during rock creep,D-W damage has a large influence on the elastic modulus of viscoelastic rocks.The elastic modulusEnreplaces the modulusEnkof the creep constitutive model to indicate the relationship between rock damage and number of DW cycles.Dn(t)is the time-dependent damage variable in the DW creep coupled test.The current damage variable is equal to the damage variable in Eq.(9),andDn(t)is related to the number of D-W cycles.α(n)can be obtained by fitting the data.The damage factor is transformed into a function with time as a variable,and the expression is as follows:
4.3.2.Elastic and visco-elastoplastic model
If plastic deformation occurs when the stable creep reaches the yield state,it is usually represented by a visco-plastic body in the rheological structure model,which is composed of plastic elements and viscous elements in parallel (Fig.8).The model is represented by Eq.(15):
where εcis the compressive strain;σcthe yield stress;the plastic strain rate;and ηsthe viscosity coefficient.When σr≥σc,the viscoplastic constitutive equation (creep model) of rock is obtained by superposition of the viscoelastic model (Eq.(11)) and the plastic model is as follows:
This model not only reflects the creep plastic deformation of rock,but also effectively describes the nonlinear and elastic posteffect properties of the rock.
4.3.3.Rheological coupled model of D-W cycles
The total strain of the rock rheology model is calculated for each element according to the series and parallel connection principles of the combined model.The total strain (ε) is calculated from
The creep constitutive model for rocks subjected to the combined action of axial prestress and D-W conditions is as follows:
The creep model not only adequately simulates the instantaneous,constant speed and accelerated creep stages of rock creep under D-W cyclic loading,but also effectively reflects the elastic deformation and plastic flow of the rock.If the applied stress decreases or drops suddenly,then the deformation properties of the specimen are obtained from the model,especially the elastic aftereffect and nonlinear deformation.
4.4.Coupled model of rock creep and anchoring force loss
The deformation properties of the rock in the free segment under the prestressed anchor cable were described above.The creep properties of the rock in the free section are affected by the combination of the long D-W cycle and the anchor cable prestress,otherwise,the creep deformations of the rock also affect the loss of anchoring force.A coupling effect is present between the rheological behavior of rock and soil and the changes in anchor cable prestress.Moreover,the prestress loss and rock relaxation effect cannot be considered separately due to this coupling effect.Therefore,the coupled model was used to simulate the prestress loss of the anchor cable.The relaxation equation was used to express the property that the stress gradually decreased with time under constant deformation conditions.For the relaxation problem,the strain was taken as a constant (ε=ε0=const).When σr<σc,the viscoelastic constitutive equation was transformed into
The conditions for solving the ordinary differential equation were as follows.The offloading was performed att=0,and the coupled model of the rock and anchor cable underwent an instantaneous elastic recovery deformation σ=ε0(Ee+Es).The conditions for solving the ordinary differential equation were that the offloading was performed at the moment,and the coupled model of the rock and the anchor cable underwent instantaneous elastic resumption deformation.The solution of the relaxation equation was:
whereEsis equivalent elastic modulus of anchor cable body;and ε0the initial unloading stress.It is also assumed that the strain is constant (ε=ε0=const).When σr≥σc,the constitutive equation is stated as follows:
Considering the condition of solving the differential equation,when the unloading of constitutive modelt=0,the elastic deformation of rock was completed and the strain was σ=ε0(Ee+Es).Ift=t1,then the overall deformation of rock isafter the end of elastic aftereffect.That is,t→∞,ε→,and the model still has some permanent deformation after unloading.The constitutive equation is given as:
where
and whereais simplified as.The change in anchor cable stress(σs) with time is calculated as follows:
4.5.Energy change of anchor cable
The creep process of rock is the gradual release process of energy from a prestressed anchor cable.Assuming that the prestressed anchor cable was uniformly distributed over the homogeneous rock mass(effective range),the mechanical analysis showed that the force on the anchor component was the same as the force on the rock mass.The relationship between the two was stated as follows:
whereFis the anchor cable force or the rock creep force;andErthe equivalent elastic modulus of rock mass.AsandArare the actual cross-sectional area of the anchor cable and the rock mass area actually affected by the anchor cable,respectively.The prestress applied to the anchor cable by initial tensioning isF0=EsAsε0,and the elastic strain of rock is ε0.At this time,the work done by the anchoring component to the rock mass is expressed as
whereL0is the length of anchor cable before tensioning;andWthe total work of the anchor cable.The anchoring force of rock is gradually lost due to D-W erosion and creep.The lost anchoring force is
whereF1is the anchoring force at timet,also known as residual anchoring force.The corresponding creep strain of rock mass is ε under the action D-W.β is the stress loss rate.
Simplifying Eq.(24) yields:
According to Eq.(26),the loss rate can be written as β=.Under the influence of D-W erosion and rock creep,the expression for prestress energy release of anchor cable is as follows:
whereL1is the length of the anchor cable after tensioning,which can be written as
5.Results and analyses
5.1.NMR T2 distribution characteristics of prestressed rock after D-W cycle
Sandstone,which is a special type of rock that is softened by water,has characteristics of porous media such as porosity,pore size distribution and pore volume.Based on the pore size,pores in samples can be classified as micropores,mesopores and macropores.The relaxation time in the T2spectrum is proportional to the pore sizes of the sample.It is widely believed that pores with relaxation times of 1-10,10-100,and 100-10000 ms correspond to micropores,mesopores and macropores or microcracks [24],respectively.
Pores are critical places to store water during D-W cycles.Mesopores and macropores are important channels for water diffusion and penetration,and they are important structures that affect damage of rock samples.According to the analysis in Fig.10,the micropores and mesopores of the rock samples without prestress accounted for the majority of the overall pores,while the macropores or microcracks accounted for a relatively minor proportion.When the prestressed rock pores expanded and contracted,compared with the initial state,the pores were in a reduced state as a whole.The compressed pores were primarily concentrated in the microporous and mesoporous ranges,and the expanded pores were distributed in each range.The part greater than zero in Fig.10d indicates the amount of compression,while the part less than zero represents the increment of expansion.With the increasing applied prestress,the microporous compression gradually increased,and the mesoporous compression basically remained at the same level,while the macropores or microcracks expanded and showed an increasing trend.The permeability of rock is affected by the transformation of large-diameter pores to some minor or large pores due to the effect of prestress.Experimental results showed that the value of the pore expansion was smaller than the value of the compression,which meant that the rock permeability decreased and the flow rate decreased as the prestress increased.Therefore,the water-rock interaction was limited during the D-W cycle test,which affected the change in damage due to D-W erosion.
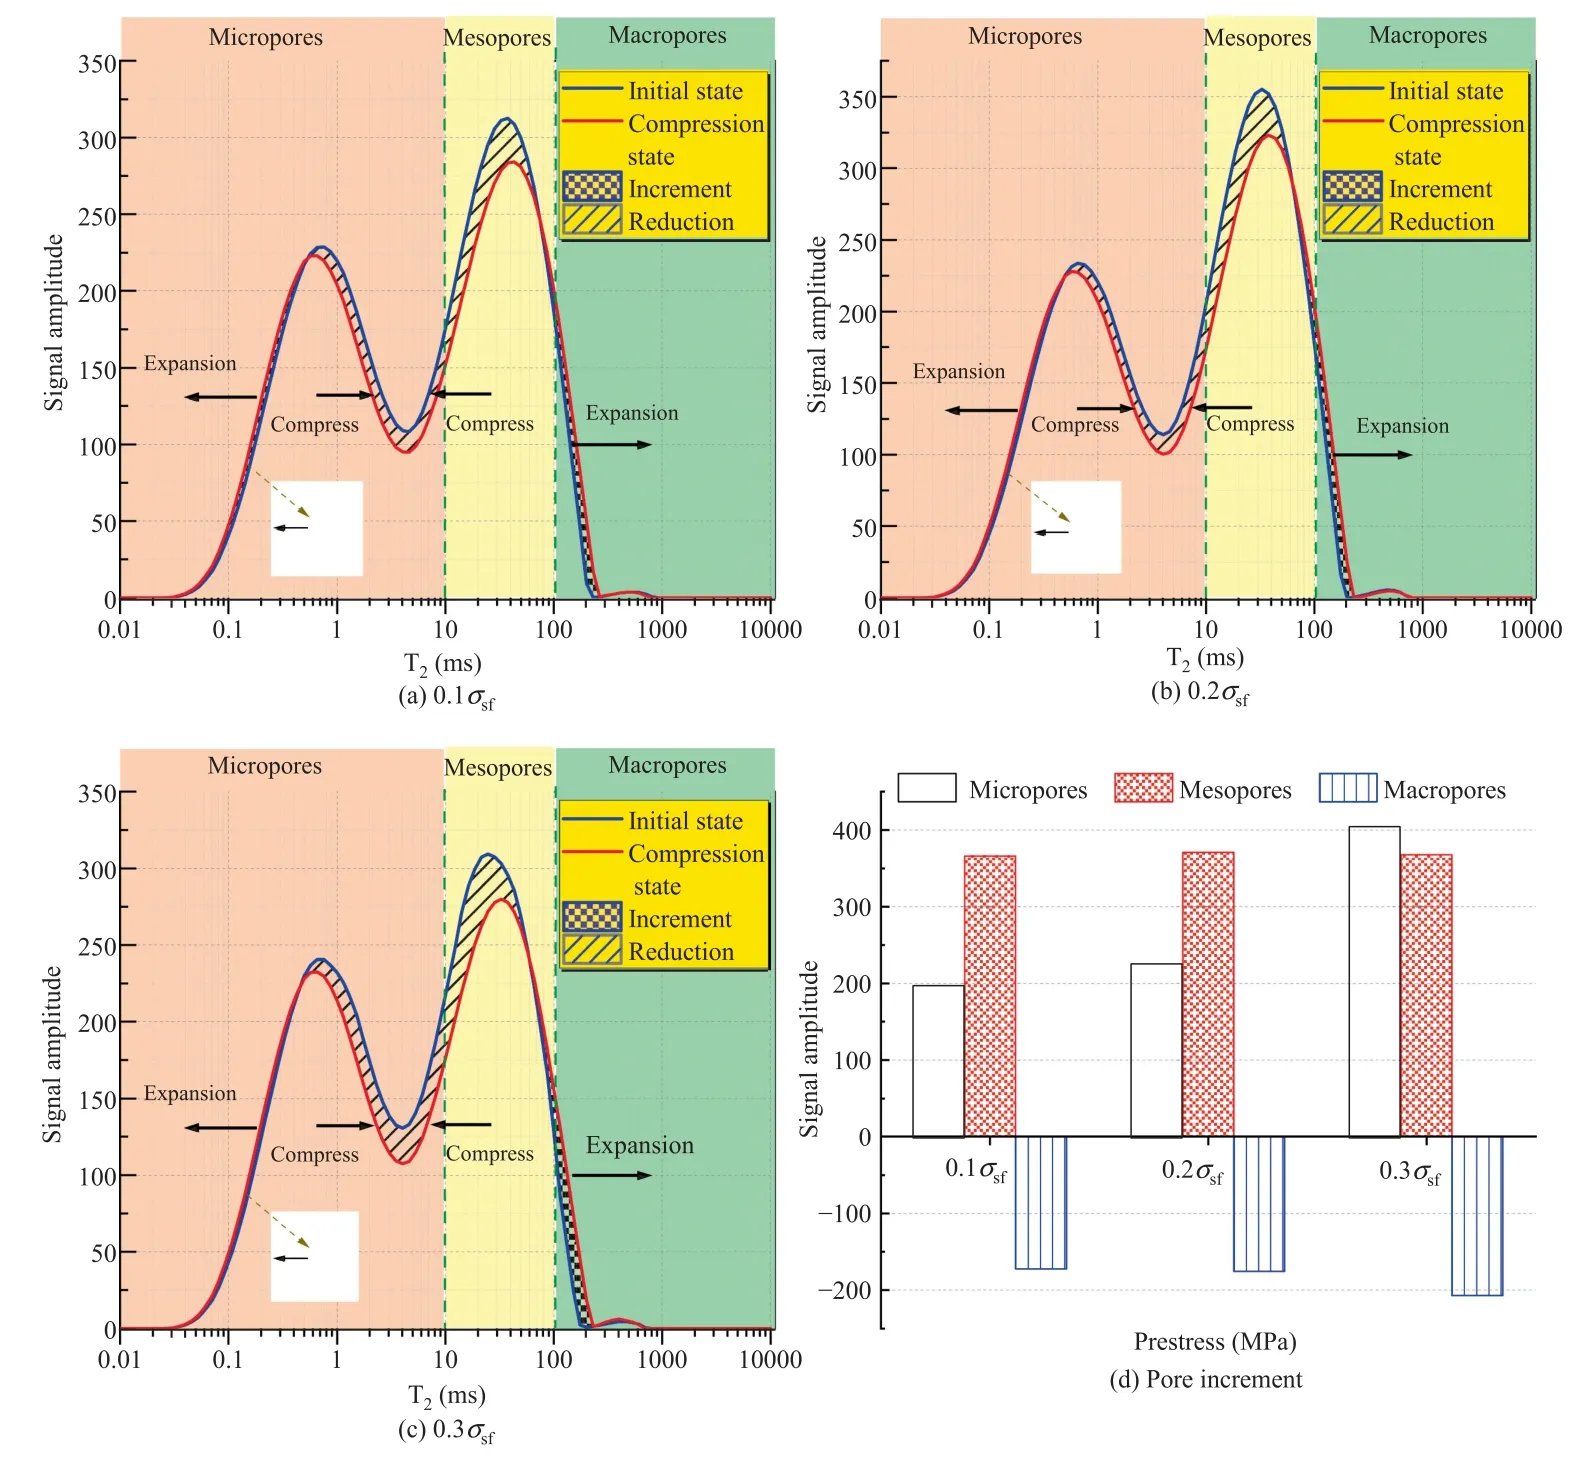
Fig.10.T2 spectra of rock before testing and after prestressing.
In Fig.11,positive values of the T2spectral difference indicated pore expansion,and negative values of the opposite indicated compression.Under D-W conditions,the pores of prestressed rocks were compressed as a whole,especially in micropores.Minor pores and mesopores of the initial specimen were compressed under the anchoring force,while the large pores underwent expansion.Since the degree of pore development in the samples during the D-W alternation varied with the number of cycles,the micropore volume was first released and then expanded;the mesopore volume was first compressed and then released;and the macropore volume was first expanded and then squeezed,and finally expanded.

Fig.11.Compression or dilation distributions (T2 spectral values) of pores in prestressed rocks under D-W cycles conditions.
According to Fig.12,the characteristics of the distributions of pores with increasing number of D-W cycles under different prestresses were analyzed.In the D-W cycles environment,the minor pores under different prestresses were in the state of initiation and expansion.The pore increment was the largest for 0.3σsf,followed by 0.2σsfand 0.1σsf,and finally 0.The rate of pore growth in unprestressed rocks increased gradually with increasing number of D-W cycles,while the rate of pore growth in other prestressed rocks tended to stabilize from rapid to slow.As seen from the observation of the test curve,in D-W cycles conditions,the mesopores without prestress gradually decreased,the prestressed mesopores were compressed before the D-W cycles,and the prestressed mesopores were first compressed and then released after the D-W cycles.The compression and release of the mesopores after the D-W test were largest for 0.2σsf.Compared with small pores and mesopores,macropores appeared to initiate and expand after the application of prestress and were first compressed and then expanded with increasing number of D-W cycles.The volume of macropores without prestress always maintained an increasing trend.When the size of a single pore increased to a certain extent,the fluid fluidity was strong,the NMR could not quickly capture the signal of the hydrogen nuclei,and the test results were small.

Fig.12.Changes in volumes of pores with increasing number of D-W cycles under different prestresses.
5.2.Mechanical behavior of prestressed rock
The general trend shown in Fig.13 was that cyclic D-W tended to decrease the uniaxial strength of different prestressed sandstone specimens,but prestress affected the rock strength fluctuation and changed the attenuation trend.Using an exponential function to fit the data,we obtained the peak intensity/modulus of the elastic force vs.the D-W period for the four conditions.The attenuation trend of elastic modulus was consistent with that predicted by Eq.(11).Due to the different prestresses applied,the decreases in peak strength and elastic modulus were different (Fig.14).The fastest attenuation in strength was at 0 MPa,followed by 0.2σsfand 0.3σsf,and the smallest was at 0.1σsf.The decreasing trend in the elastic modulus was as follows: the largest was for 0 MPa,followed by 0.2σsf,and the smallest is 0.1σsfand 0.3σsf.Under unprestressed and prestressed conditions,the elastic modulus of rock decreased exponentially with increasing number of D-W cycles.From the experimental results,it was obvious that the size and rate of strength reduction were greater for unprestressed rock than prestressed rock,indicating that prestress could prevent D-W erosion and reduce rock damage.

Fig.13.Stress-strain curves of prestressed rock for different numbers of D-W cycles.

Fig.14.Peak strength mechanical parameters of rocks after D-W cycles.
5.3.D-W creep change
Papers published previously in the literature reported that mineral expansion in water was one of the reasons for pore expansion and crack propagation,thus demonstrating that D-W damage was irreversible [24].In this study,the expansion strain of the prestressed sandstone under repeated D-W cycles was monitored,as shown in Fig.15.The figure shows the strain changes of prestressed rock for 11 D-W cycles.The range of rock strain gradually broadened with increasing number of D-W cycles.The results showed that with increasing cycle period,the maximum strain change was 0.1σsf,followed by 0.2σsf,and the minimum was 0.3σsf.The strain changes during the soaking and drying phases were different for different prestress conditions.At the initial immersion stage,the strain of 0.1σsfdecayed rapidly,and the strain decayed slowly with increasing number of cycles,while the strain decay rates for 0.2σsfand 0.3σsfchanged from moderate to rapid.Because the 0.1σsfprestress applied to sandstone was small,only a fraction of the pores were compressed.The pores of the water-softened rock were significantly compressed,and thus the rate of strain decay during the soaking phase changed from rapid to gradual.In contrast,the load on the sandstone was relatively large.Most of the pores were compressed before the D-W test.After many cycles,the rock softened,and the pores continued to be compressed.As a result,the strain shift rates of 0.2σsfand 0.3σsfin the soaking phase were moderate at first and then rapid.The strain shift was relatively stable in the dry state compared to the immersed state.
The mechanical properties in prestressed rocks under the D-W cycle can be thought of as a process of rock creep shift and prestress loss of the anchor cable.Under the long-term effect of D-W erosion,the strain-degree curve can be divided into three stages: rapid attenuation stage,moderate attenuation stage,and relatively stable stage (Fig.16).Rapid attenuation strain at all levels of prestress accounted for more than 50% of the total strain,indicating that most of the rock deformation occurs during the rapid attenuation stage.At the same stress level,the creep strain rate for the soaking specimen was the highest,while that of the dried specimen was the lowest.The creep strain rates at all stress levels of the dry and soaking specimens were shown in Fig.17 to elucidate the stress dependence of the strain rate.Under the same D-W cycling conditions,the greater the prestress,the smaller the strain loss rate of the rock,especially in the soaking conditions.The results indicated that the deformation of 0.1σsf,0.2σsf,and 0.3σsfunder immersion conditions ranged from -5.07×10⁻⁶to -2.28×10⁻⁴,-1.75×10⁻⁵to -1.31×10⁻⁴,and 1.19×10⁻⁵to -9.43×10⁻⁵,respectively.The deformation of 0.1σsf,0.2σsf,and 0.3σsfunder dry conditions ranged from 8.40×10⁻⁵to -4.57×10-5,7.24×10-5to -1.92×10⁻⁵,and 5.12×10⁻⁵to -1.37×10⁻⁵,respectively.

Fig.16.Variation in characteristics of rock strain under D-W conditions.

Fig.17.Strain characteristics of D-W rocks.
5.4.Model parameter identification and verification
According to Fig.18,the prestress loss and reduction speed of the anchor in the dehumidifying process were less than those in the immersion state.The greater the applied anchoring force was prior to the D-W test,the smaller the losses in the dehumidified and immersed environments.During the soaking phase,the rock softened and the anchor prestress decreased rapidly,while during the dehumidification phase,the anchor prestress increased and the pores were compressed,inhibiting water-rock interaction and slowing the release of the prestress.The trends of prestress loss and strain variation are consistent,which can be divided into three characteristic intervals: rapid attenuation stage,slow attenuation stage and relatively stable stage.At the same stress level,the stress loss rate for the soaking specimen was the highest,while that of the dried specimen was the lowest.The larger the deformation fluctuation of the rock,the greater the loss of reinforcement force,especially for samples with a reinforcement force of 0.1σsf.Rock strains in all D-W states showed a negative growth trend.The smaller the anchoring force was,the greater the strain variation.That was,the greater the negative increment of strain,the greater the loss in anchoring force.It was demonstrated that large loads could effectively control internal damage to rocks caused by expansion.The dilatation strain additionally confirmed that the residual damage due to the D-W cycle after drying was minor.As a result,the prestress loss in the drying phase was slight.In the D-W cycle,the rock undergoes water absorption expansion and temperature expansion,and the water absorption expansion coefficient is greater than the temperature expansion.If the expansion deformation (matrix softening) is less than the load compression,then the strain becomes increasingly negative.

Fig.18.Comparison of experimental data and values predicted by the model.
Mathematical optimization analysis software was used to identify the model parameters.The prestress applied in the test did not exceed the elastic stage of the rock,and thus no plastic deformation occurred during the rock deformation.The results show that the cable stiffness,cross section area and rock deformation are known quantities,which are brought into Eq.(26) to obtain lost anchoring force of the cable.Then,the anchor cable loss stress and rock strain are brought into Eq.(22)to determine the unknown parameters of the rock relaxation model in D-W environments,as shown in Table 2.Finally,a relaxation model (Eqs.(20) and (24))varying with D-W periods is obtained,which can be used to predict rock anchorage force loss.In the D-W environments,the model parameters different from those of the prestressed rocks are given in Table 2.The wetting stress of 0.1σsfobtained from the test was negative,which was not consistent with the actual situation and therefore not predicted by the model.Eewas greater for wet than dry conditions.With the increase in applied prestress,the model element parametersEeand ηkwere attenuated.The calculated values of the prestress as a function of the number of cycles in the model were essentially consistent with the measured data.This model can be used as a reference for the calculation of prestress losses in D-W cycles.

Table 2 Model element parameters of D-W cycles.
5.5.Field prototype test verification
The model presented in this article aligns with the outcomes of indoor experiments;however,it is crucial to note that on-site construction varies significantly from controlled laboratory conditions,necessitating empirical validation of the theoretical model through actual engineering practices.Wang et al.[25] conducted anchor force monitoring tests on the deep foundation pit support of the West Railway Station project in Huaiyin District,Jinan City.The foundation pit is situated within a thick alluvial soil layer with a depth of 19.5 m.Among them,soil nailing wall support ranges from 0 to -7.5 m;pile anchor support are used from -7.5 to -19 m,with a pile diameter of 800 mm and a pile length of 23 m.The second layer anchor cable is located at -12 m and uses four 21 m long 7 ϕ15.2 mm low slack steel strands.The 2-1#anchor cable is a standard construction anchor cable with a locking value of 210 kN.After a period of 10 days,there is a decrease in anchoring force by 29.7 kN,resulting in a loss rate of 14.1%.On the other hand,the 2-4# anchor cable is an overstretched construction anchor cable with a locking value of 237 kN and experiences an anchoring force reduction of 32.6 kN after the same duration.Wang et al.[25]provided the parameters of the rock soil coupling model for deep foundation pit support,as shown in Table 3.Eh1,Eh2andEkare the elastic modulus of the elastic elements of the simulated rock-soil mass;η the viscosity coefficient of the viscous element for the simulated rock-soil mass;andEathe viscosity coefficient of simulated cable elastic element.

Table 3 Parameters of geotechnical coupling model for deep foundation pit support [9].
Taking 2-1# and 2-4# anchor cables as exemplars,the parametersEh2=Ee,Ek=Enk,η=ηkand their respective values are incorporated into Eqs.(20) and (24) to derive the temporal curve depicting the evolution of anchor cable force,as illustrated in Fig.19.Owing to the influence of engineering environmental factors,the model parameters do not incorporate considerations for damage (Dn(t)=0) caused by D-W conditions.The model outcomes obtained by Zhu et al.[26],Xiao et al.[27],Dong et al.[9],and this study exhibit a degree of concurrence with the experimental data.The model in this article does not calculate the impact of environmental and long-term rock deformation on anchoring force in this practical project.On the 60th day,the loss rates of 2-1#and 2-4# anchoring force calculated by the model in this paper are 20.9% and 19.9%,respectively,and the corresponding test values are 13.3% and 14.9%,with an error of 5.0%-9.0%,which is in good agreement.

Fig.19.Comparison between measured and theoretical values of anchorage force of anchor cable in deep foundation pit.
6.Discussion
6.1.Weakening mechanisms
We reviewed previous studies and then compared and analyzed possible mechanisms (Fig.20) of rock strength reduction in this test.A brief summary is as follows:
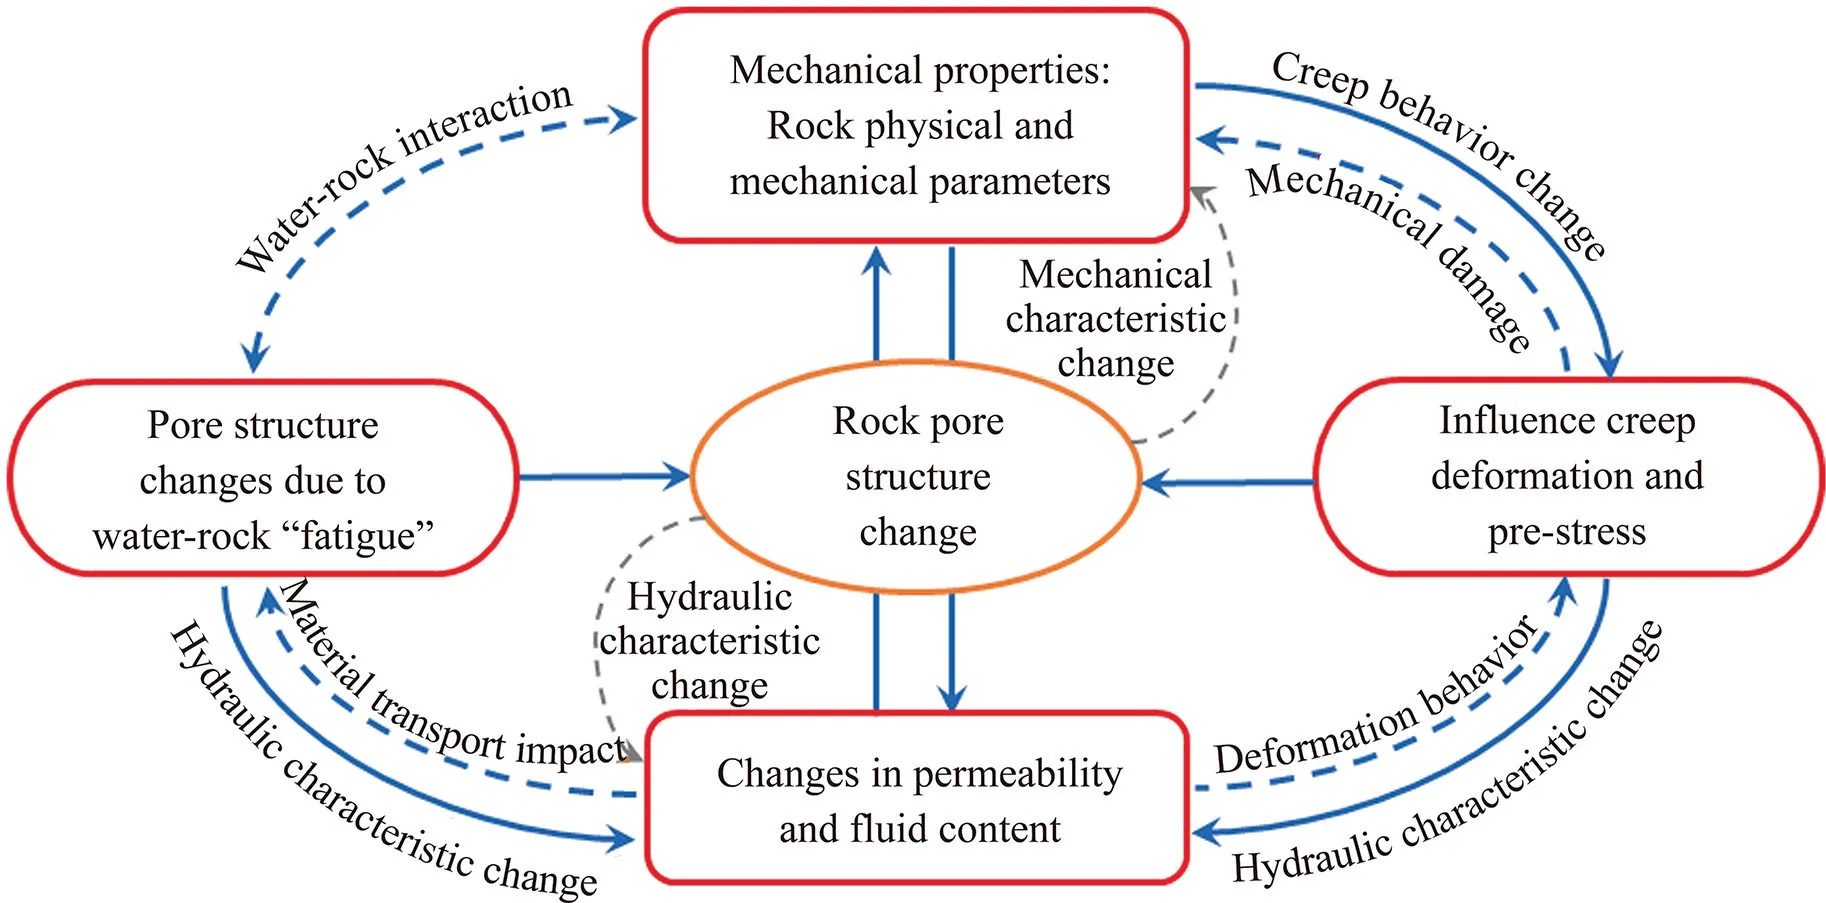
Fig.20.Schematic diagram of the principle of D-W erosion.
(1) Pore structure change: The expansion of pore volume increased the permeability inside rock and broadened the material transmission channel,which was conducive to the the development of damage during D-W cycles.However,NMR testing showed that the mesopores displayed negative growth under D-W fatigue,which was due to prestress compression and transformation from mesopores to macropores.With the change in pore size,the free adsorption rate of water by rock samples was different,and the more capillary pores there were,the greater the water content.It is proved by the nuclear magnetic data that the porosity of prestressed rock increases with the increase of D-W cycle,and the permeability also increases gradually.The immersion state of rock during the D-W alternate test was divided into three stages: rapid water absorption,slow water absorption,and no constant water absorption.For rocks with high loading rates,the reduction in pore volume led to volume compaction and,as a consequence,an increase in pore pressure and a decrease in effective stress,which may eventually give rise to a decrease in rock strength.
(2) Mineral particles: Sandstone is cemented by mineral particles and cements.Under frequent water-rock interactions,rock minerals and cements expand,dissolve,soften,and migrate(fall off),which leads to the initiation and expansion of pores,expansion in transportation channels,full exploitation of erosion effects,and damage inside rocks.Under the condition of water content,the friction coefficient at the particle interface decreases significantly;the higher the water content is,the lower the friction coefficient.Water acts as a lubricant between particles,hindering the development of frictional resistance.
(3) D-W erosion: Rock absorbs water and expands in a wetted state,and the particles are squeezed.When the volume shrinks in a drying state,the particles are subject to tensile force.Frequent water-rock interactions cause damage similar to fatigue,gradually reducing the physical and mechanical properties of rocks.
(4) Prestress and creep:The physical and mechanical properties of rock are affected by changes in pore structure,especially strength,elastic modulus and deformation.The mechanical parameters change with D-W erosion,thus affecting the creep deformation behavior and prestress loss of rock.According to the analysis of Fig.13,the dissolution and detachment of rock minerals by the prolonged D-W action led to the initiation and expansion of the pores,and the softening of the matrix under the action of the prestress caused the compression of the mesopores and macropores.However,some rock minerals expand under the combination of water and prestress,resulting in a small amount of pore closure and slowing the D-W damage.At this point,the prestress was unloaded.As the mineral expansion force counteracted the prestress effect,the forces on the pores were gradually released,and the pores expanded.The creep and prestress loss in the initial stage of the D-W test were relatively large,and the rock gradually entered the stage of stable decline in the later stage.
6.2.Outstanding issues
The test results in this paper indicted that the creep deformation of rocks in contact with water and dry is extremely different to understand,which also indicates that the water-rock interaction is complex.The deformations of soft and tough rocks differ significantly in engineering applications;in particular the physical and mechanical properties of soft rocks change drastically upon encountering water.There is a need for research on deformation during unloading and support of steep slopes of thick soft rock interlaced with hard rock.Rheological tests were performed for various types of rocks,such as claystone,soft rock,salt rock,and soft interlayer rock [28].The test results indicated that under dry and saturated conditions,the long-term strength of saturated rock decreased,while the creep rate and deformation value increased rapidly.The behavior of a single type in soft rock cannot fully explain the loss of anchoring force under D-W cycles.The experimental part of this study should include more types of rock,obtain the prestress loss for different rock samples,estimate the prestress applied on the rock,and investigate how rock can most effectively resist D-W corrosion.The relationship between the variation of axial anchor load and rock mass stress can reflect the deformation and stable state of actual engineering rocks[29,30],providing reasonable warning indicators and reference for optimizing anchor parameters in anchoring engineering [31].
Pore structures and structural planes lead to the ever-changing physical and mechanical properties of rock,such as quantity,size and inclination.The sandstone used in this study can be regarded as homogeneous,continuous and isotropic.In fact,a rock mass is a complex geological body with structural planes,and its properties are significantly different from the mechanical properties of rock samples measured in the laboratory.The main reasons for these differences are heterogeneity,anisotropy [32-35],continuous and discontinuous structures [36],and water content [37].The loss of prestress caused by D-W action in structural planes of rock should be considered to provide additional information for solving the problem of loss of anchoring force.
7.Conclusions
The following conclusions can be drawn from this experimental study:
(1) Real-time monitoring using devices made in this laboratory were applied to obtain the deformation behavior of rocks and prestressed bolts under D-W conditions,and thus the different reinforcement forces of rock deformation during D-W periods were dynamically mastered.Information was obtained in real time,including the rock deformation and the anchor stress states for D-W conditions.The trends of prestress loss and strain variation are consistent,which can be divided into three characteristic intervals: rapid attenuation stage,slow attenuation stage and relatively stable stage.At the same stress level,the rate of stress loss and strain for the soaking specimen was the highest,while that of the dried specimen was the lowest.
(2) By analyzing the uniaxial stress-strain curves,the D-W erosion properties of rocks with different reinforcement forces were revealed.The experimental results showed that the damage of rock without prestress was more significant with increasing number of D-W cycles.Compared with the peak strength,the damage was smallest for 0.1σsf,followed by 0.2σsfand 0.3σsf.This illustrated that prestress could restrain water softening and improve the mechanical properties of rock.D-W damage variables corresponding to different reinforcement forces were proposed based on experimental relationships.
(3) A deformation coupled model between prestressed anchor cables and rocks under D-W conditions was developed.In the D-W environment,rock was the main deformation object,and anchor cables underwent cooperative deformation.Comparing the numerical curves and the experimental curves,we find that they are very consistent.The parameters of the drying model were larger than those of the wetting model at the same prestress level.The larger the prestress on the dried and wetted samples,the smaller the model parameters.
(4) The variation inside rock pore structure with increasing number of D-W cycles was observed using NMR spectroscopy.The prestress effectively suppressed the expansion of rock pores,thereby enhancing the weathering resistance of the rock.The microdamage pattern of each stress level under D-W cycles is basically the same,with micropores showing an increasing trend,mesopores decreasing first and then increasing,and macropores decreasing first and then increasing.
Acknowledgments
This work was supported by National Natural Science Foundation of China (Nos.52164001,52064006 and 52004072),the Science and Technology Support Project of Guizhou (Nos.[2020]4Y044),[2021]N404 and [2021]N511),the Cultivation Program of Guizhou University ([2020] No.1),the Talents of Guizhou University (No.201901),and the Special Research Funds of Guizhou University (Nos.201903,202011 and 202012).
杂志排行

矿业科学技术学报的其它文章
- Extraction and imaging of indicator elements for non-destructive,in-situ,fast identification of adverse geology in tunnels
- Development of an improved three-dimensional rough discrete fracture network model: Method and application
- Mechanical response and microscopic damage mechanism of pre-flawed sandstone subjected to monotonic and multilevel cyclic loading:A laboratory-scale investigation
- Mechanism of gas pressure action during the initial failure of coal containing gas and its application for an outburst inoculation
- Morphological evolution and flow conduction characteristics of fracture channels in fractured sandstone under cyclic loading and unloading
- 3D forward modeling and response characteristics of low-resistivity overburden of the CFS-PML absorbing boundary for ground-well transient electromagnetic method