Three-dimensional computational characterization of grain size and texture effects in magnesium alloys
2023-12-27ShahmeerBawejaShailendraJoshi
Shahmeer Baweja,Shailendra P.Joshi
Department of Mechanical Engineering, University of Houston, Houston, TX 77204-4006, USA
Abstract This work systematically investigates the microstructure-property relationship in Mg alloys.Emphasis is placed on understanding,through high resolution crystal plasticity modeling,how grain size and texture collectively impact material strengthening and hardening,net plastic anisotropy,and tension-compression asymmetry.To achieve this,528 fully three-dimensional finite element calculations are performed,which comprise eleven textures,four grain sizes,six loading orientations,and two uniaxial loading states (tension and compression).The grain size effect follows Hall-Petch relation that depends on both,loading orientation and initial texture.The reduction in extension twinning with grain size refinement is influenced by texture as well.Below a threshold textural strength,grain size refinement leads to an appreciable reduction in the net plastic anisotropy at yield,quantified using Hill anisotropy,and reduced tension-compression asymmetry.Using a micromechanical basis,the effect of grain size and texture on material ductility is predicted to be non-monotonic.The computational predictions serve as synthetic data sets for experimental validation and reduced-order modeling.
Keywords: Mg alloys;Microstructure-property relations;Grain-size effect;Crystal plasticity;Damage micromechanics.
1.Introduction
Mapping microstructure-property relations in magnesium(Mg) alloys is complicated by the sensitivity of these hexagonal close-packed (HCP) materials to processing protocols(e.g.,rolling,extrusion,etc.),which can result in protean microstructures [1,2].Depending on the alloying composition,processing affects grain size distributions,grain morphology,and the distributions of the sizes,shapes,and orientations of second phase particles [3–6].Several efforts have been undertaken to elucidate these effects on the microscale deformation mechanisms and macroscale behaviors in Mg and its alloys[7].An excellent review of the interaction effects from grain size and texture can be found in Ref.[8].For instance,studies indicate that extension twinning tends to be reduced with decreasing grain size [9–19].Experimental studies indicate that grain size refinement can improve the tensile ductility of pure [20] and alloyed Mg [21,22],although may not always be beneficial,for instance under heterogeneous macroscopic loading states [22].This alludes to the fact that a complete three-dimensional characterization of Mg and its alloys is imperative in order to connect microstructural details to properties such as strength and ductility.
A thorough understanding,solely based on experiments,of the roles microstructural factors play in the macroscopic plastic anisotropy,tension-compression asymmetry,and material failure is a thorny challenge [23].Multiscale modeling and simulation can offer important insights into their complex inter-relationships,which can enable designing superior Mg alloys for various applications [24–27].Often,theoretical models offer insights into the role of individual strengthening mechanisms [3,15,28].However,few modeling efforts exist that consider interactions between the different strengthening mechanisms[29].A micromechanics driven approach[30]offers insights into how texture may play a role in damage evolution that controls the ductility under multi-axial tensile loading states.Recent works have adopted high-resolution crystal plasticity modeling and simulation to obtain microstructureproperty relations in synthetic microstructures [31,32].For instance,Ravaji and Joshi [32] performed a preliminary study on the effect of grain size and initial texture on deformation mechanisms and macroscale properties.Earlier,Indurkar et al.[31] considered a broader range of textural variations and analyzed their response for a wider set of loading orientations in both,tension and compression,but did not consider grain size effect.
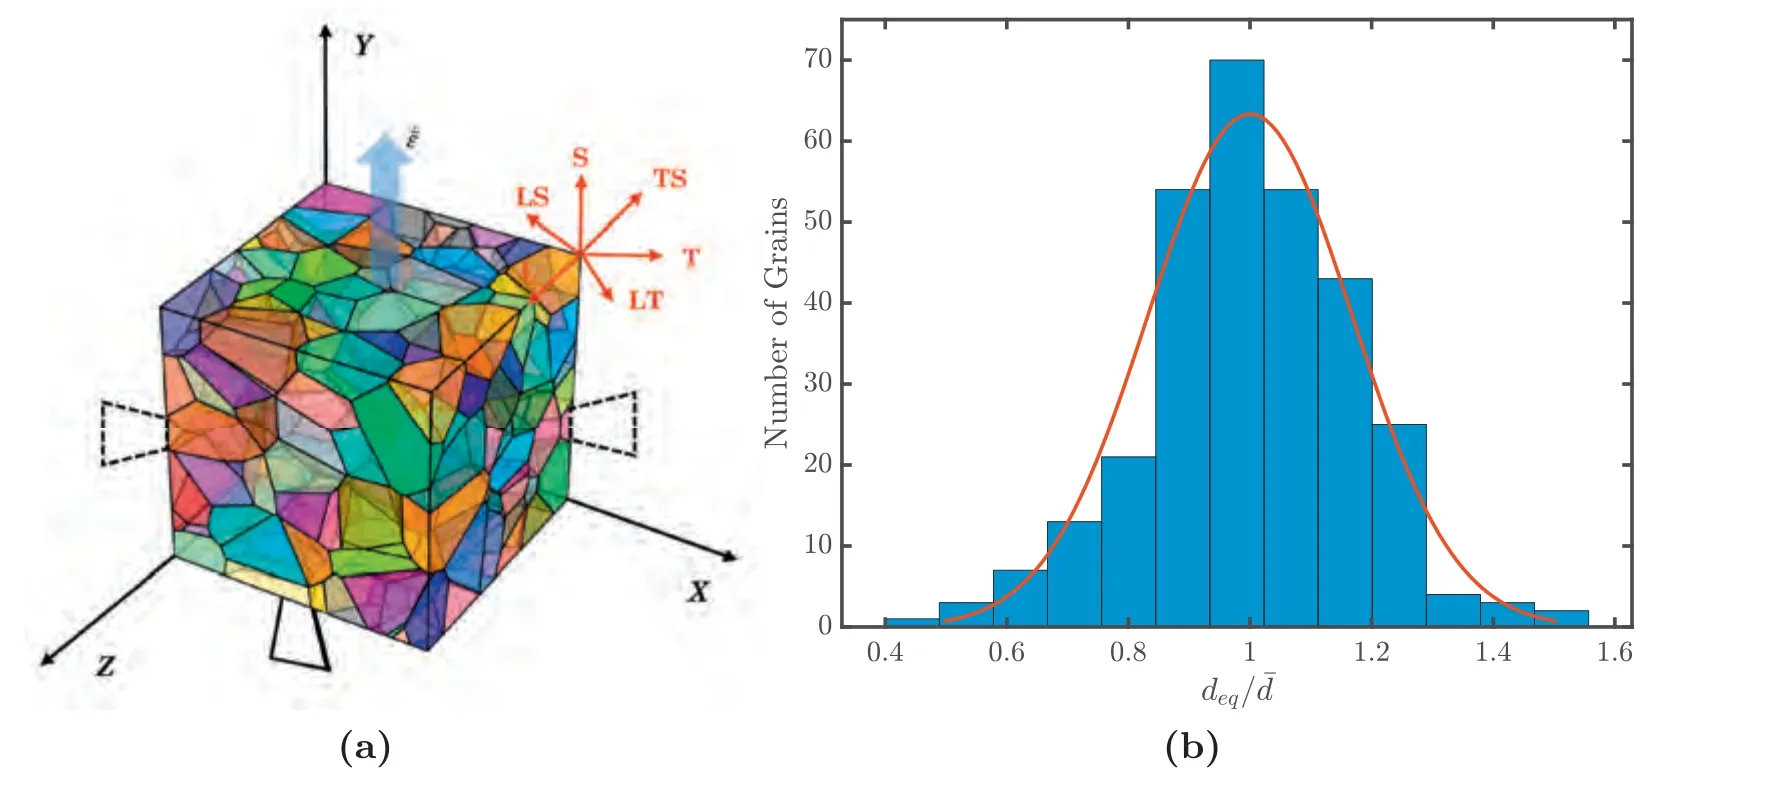
Fig.1.(a) Polycrystal setup with illustrative case of a material principal direction (S) aligned with the loading (y) axis is shown.Panel (b) shows the grain size distribution.

Table 1 Loading cases considered in this work.⊥indicates a direction perpendicular to direction ().
This work focuses on mapping the material texture and grain size effects on the macroscopic behaviors of Mg alloys.Using the recent developments [31,32] as a basis,the aim is to systematically investigate the interaction between the grain size and initial texture on the micro-macro relationship for different tensile and compressive loading orientations.This effort is expected to serve several purposes.It offers via three-dimensional computational basis,a mechanistic understanding about the coupled nature of grain size and textural effects in the overall material strengthening,plastic anisotropy,and tension-compression asymmetry in Mg alloys.The results may also serve assyntheticdata sets to characterize reducedorder models of HCP plasticity [33–35].Moreover,the predictions from the computations can be used to determine improvements in mesoscale modeling efforts by comparing them against carefully designed future experiments.
In what follows,Section 2 describes the computational protocol that uses a size-dependent finite-deformation single crystal plasticity framework with slip and twinning [32] (see Appendix for model description).Detailed results are presented in Section 3.Expanding on our previous work [31,36],in Section 4 we explore potential implications of the coupled texture-grain-size dependent net plastic anisotropy on ductile damage using a micromechanical theory [37].
2.Finite element modeling
Fig.1 a shows the three-dimensional polycrystal microstructure with a normal grain size distribution (Fig.1b)generated using an open-source polycrystal generation and meshing package Neper,[38];deqis the equivalent diameter of a particular grain andthe mean grain diameter.The microstructure comprises 300 grains,and each grain is discretized using a fine mesh (∼280 per grain) of tetrahedral finite elements (C3D4) in ABAQUS®.
A constant nominal strain rateis applied along the global Y-axis.We consider monotonic loading (uniaxial tensile and compressive) along the three principal material axes (L,T,S) and three off-axis (LT, LS, TS) directions, see Table 1.Here, LT refers the direction 45◦to the L-direction in the LT-plane, and so forth.Symmetry boundary conditions are applied on the bottom XZ plane, the left YZ plane, and the XY plane adjacent to the left YZ plane.To prevent rigid body displacement and rigid rotation, the bottom XZ plane is constrained from translating along the Y-direction, the left YZ plane is constrained against displacement along the Xaxis, and the adjacent XY plane is constrained from translating along the Z-direction.Intersection node of the front,left and bottom faces is pinned to constrain translating along the Z-direction.Further, all the three displacements at the origin (X=Y=Z=0) are constrained to ensure no rigid motions.The volume-averaged logarithmic strains are computed as Eij=componentsdV where εijand σijare respectively the components of the local (at each Gauss point)logarithmic strain tensor and the local Cauchy stress tensor in the global frame; V is the current volume of the computational domain.In the present case, only ΣYY/=0.The von Mises equivalent stress and the corresponding equivalent strain are computed as:and Eeq=where Σ′and E′are respectively the volume-averaged deviatoric stresses and deviatoric part of the logarithmic strains.The lateral strain anisotropy is expressed via Lankford ratio as RY=EXX/EZZ, where the lateral normal strains depend on the loading direction, Table 1.For instance, when Y-axis ‖ LT-axis, RLT=ELT⊥/ESas per Table 1.The crystal orientation of each grain is described by three Euler angles (ϕ1,Φ,ϕ2) using the Bunge scheme [39],see Indurkar et al.[31] for details.

Table 2 Material parameters representative of Mg alloy [32].
Fig.2 shows initial pole figures for eleven textures (A-K)with a wide range of textural strengths,plotted using MTEX[40].While these pole figures appear very similar to those in Indurkar et al.[31] and Ravaji and Joshi [32],they are independently obtained (but using the same maximum variations).The similarity between the present textures and those in the preceding works serves as a way to collate the observations and create extended data-sets.Details aside,cases A–D resemble strong textures that are reminiscent of single crystals[41];cases E–H are typical rolled textures [42–44] referred to here as intermediate textures,while cases I–K are weak textures,also sometimes observed in rolled Mg alloys [45–47].
Appendix A briefly describes the rate-dependent single crystal plasticity model used at the grain scale as implemented by Ravaji and Joshi [32].It incorporates rate-dependent slip and twinning whose critical resolved shear stresses (CRSS)are assumed to followmicroHall-Petch relation (Eq.(A.12))analogous to the well-known macroscale Hall-Petch relation.Micro-scale (i.e.,at the scale of slip/twin system within a grain) Hall-Petch relations have been experimentally reported in Mg alloys [48] and are rooted in theory of slip gradients[49].By way of consequence,a grain size dependent aggregate mechanical response emerges.Note that in Eq.(A.12)the strengthening of each slip and twinning system is generally distinct for each grain as we calculate the equivalent diameter(deq) for each grain.
Table 2 consolidates the material parameters representative of an AZ31 Mg alloy.These constitutive parameters are associated with each slip and twin system (Appendix A):the initial size-independent CRSSand saturation stressesslip hardening (h0) and twin hardening(het,hct,het_sl,hct_sl) and are representative of an Mg alloy[32].The micro Hall-Petch parameters, kτare taken from Wang et al.[48] and ksis taken from Ravaji and Joshi [32].Finally,the rate parameters are[50]:=1×10⁻³s-1(slip),=1×10⁻³s-1(extension twinning),=1×10⁻⁴s-1(contraction twinning), and m=mt=1/50.
3.Results
The simulations are performed under an applied strain rate=1×10⁻³s-1up to a nominal strain of 0.25.Three average grain sizes=1 μm,10 μm,and 100 μm are considered in addition to the simulations with no grain size effect(referred to as Base material1For numerical purposes,we choose =104 μm for the Base material.).For all the cases the same microstructure (i.e.,grain topology,grain orientation allocation,and grain size distribution are adopted (Fig.1).In this section,we focus on the main characteristics that emerge from the interaction between grain size and texture.Full stressstrain responses,Lankford ratios,and relative activity plots are shown in Appendix B.
3.1.Hall-Petch trends
Fig.3 collates the role of grain size and texture in the macroscopic yield stress defined asσy≡(Σeq)Eeq=0.2%.The trends (lines) follow Hall-Petch relationσy∼-1/2.For the tensile loading in the L (Fig.3a),T (Fig.3b),and the LT(Fig.3d) orientations,the weaker a texture the weaker the grain size effect.On the other hand,for S (Fig.3c),LS(Fig.3e),and TS (Fig.3f) orientations,the trend is reversed-stronger textures tend to have a weaker grain size strengthening.
Under uniaxial compression,the orientation effect on the grain size-texture coupling is somewhat more complicated.The L (Fig.3g),T (Fig.3h),and LT (Fig.3j) orientations exhibit a weaker Hall-Petch effect in weaker textures (I-K)compared to their stronger counterparts.Interestingly in these loading cases,at∼10 μm the yield stress is nearly independent of the initial texture.In comparison,whereas Scompression (Fig.3i) shows a stronger Hall-Petch effect for stronger textures (similar to the tensile responses in L and T),compressive responses along the TS(Fig.3l)and LS(Fig.3k)orientations tend to exhibit the opposite trend,i.e.,weaker the texture stronger its Hall-Petch slope.
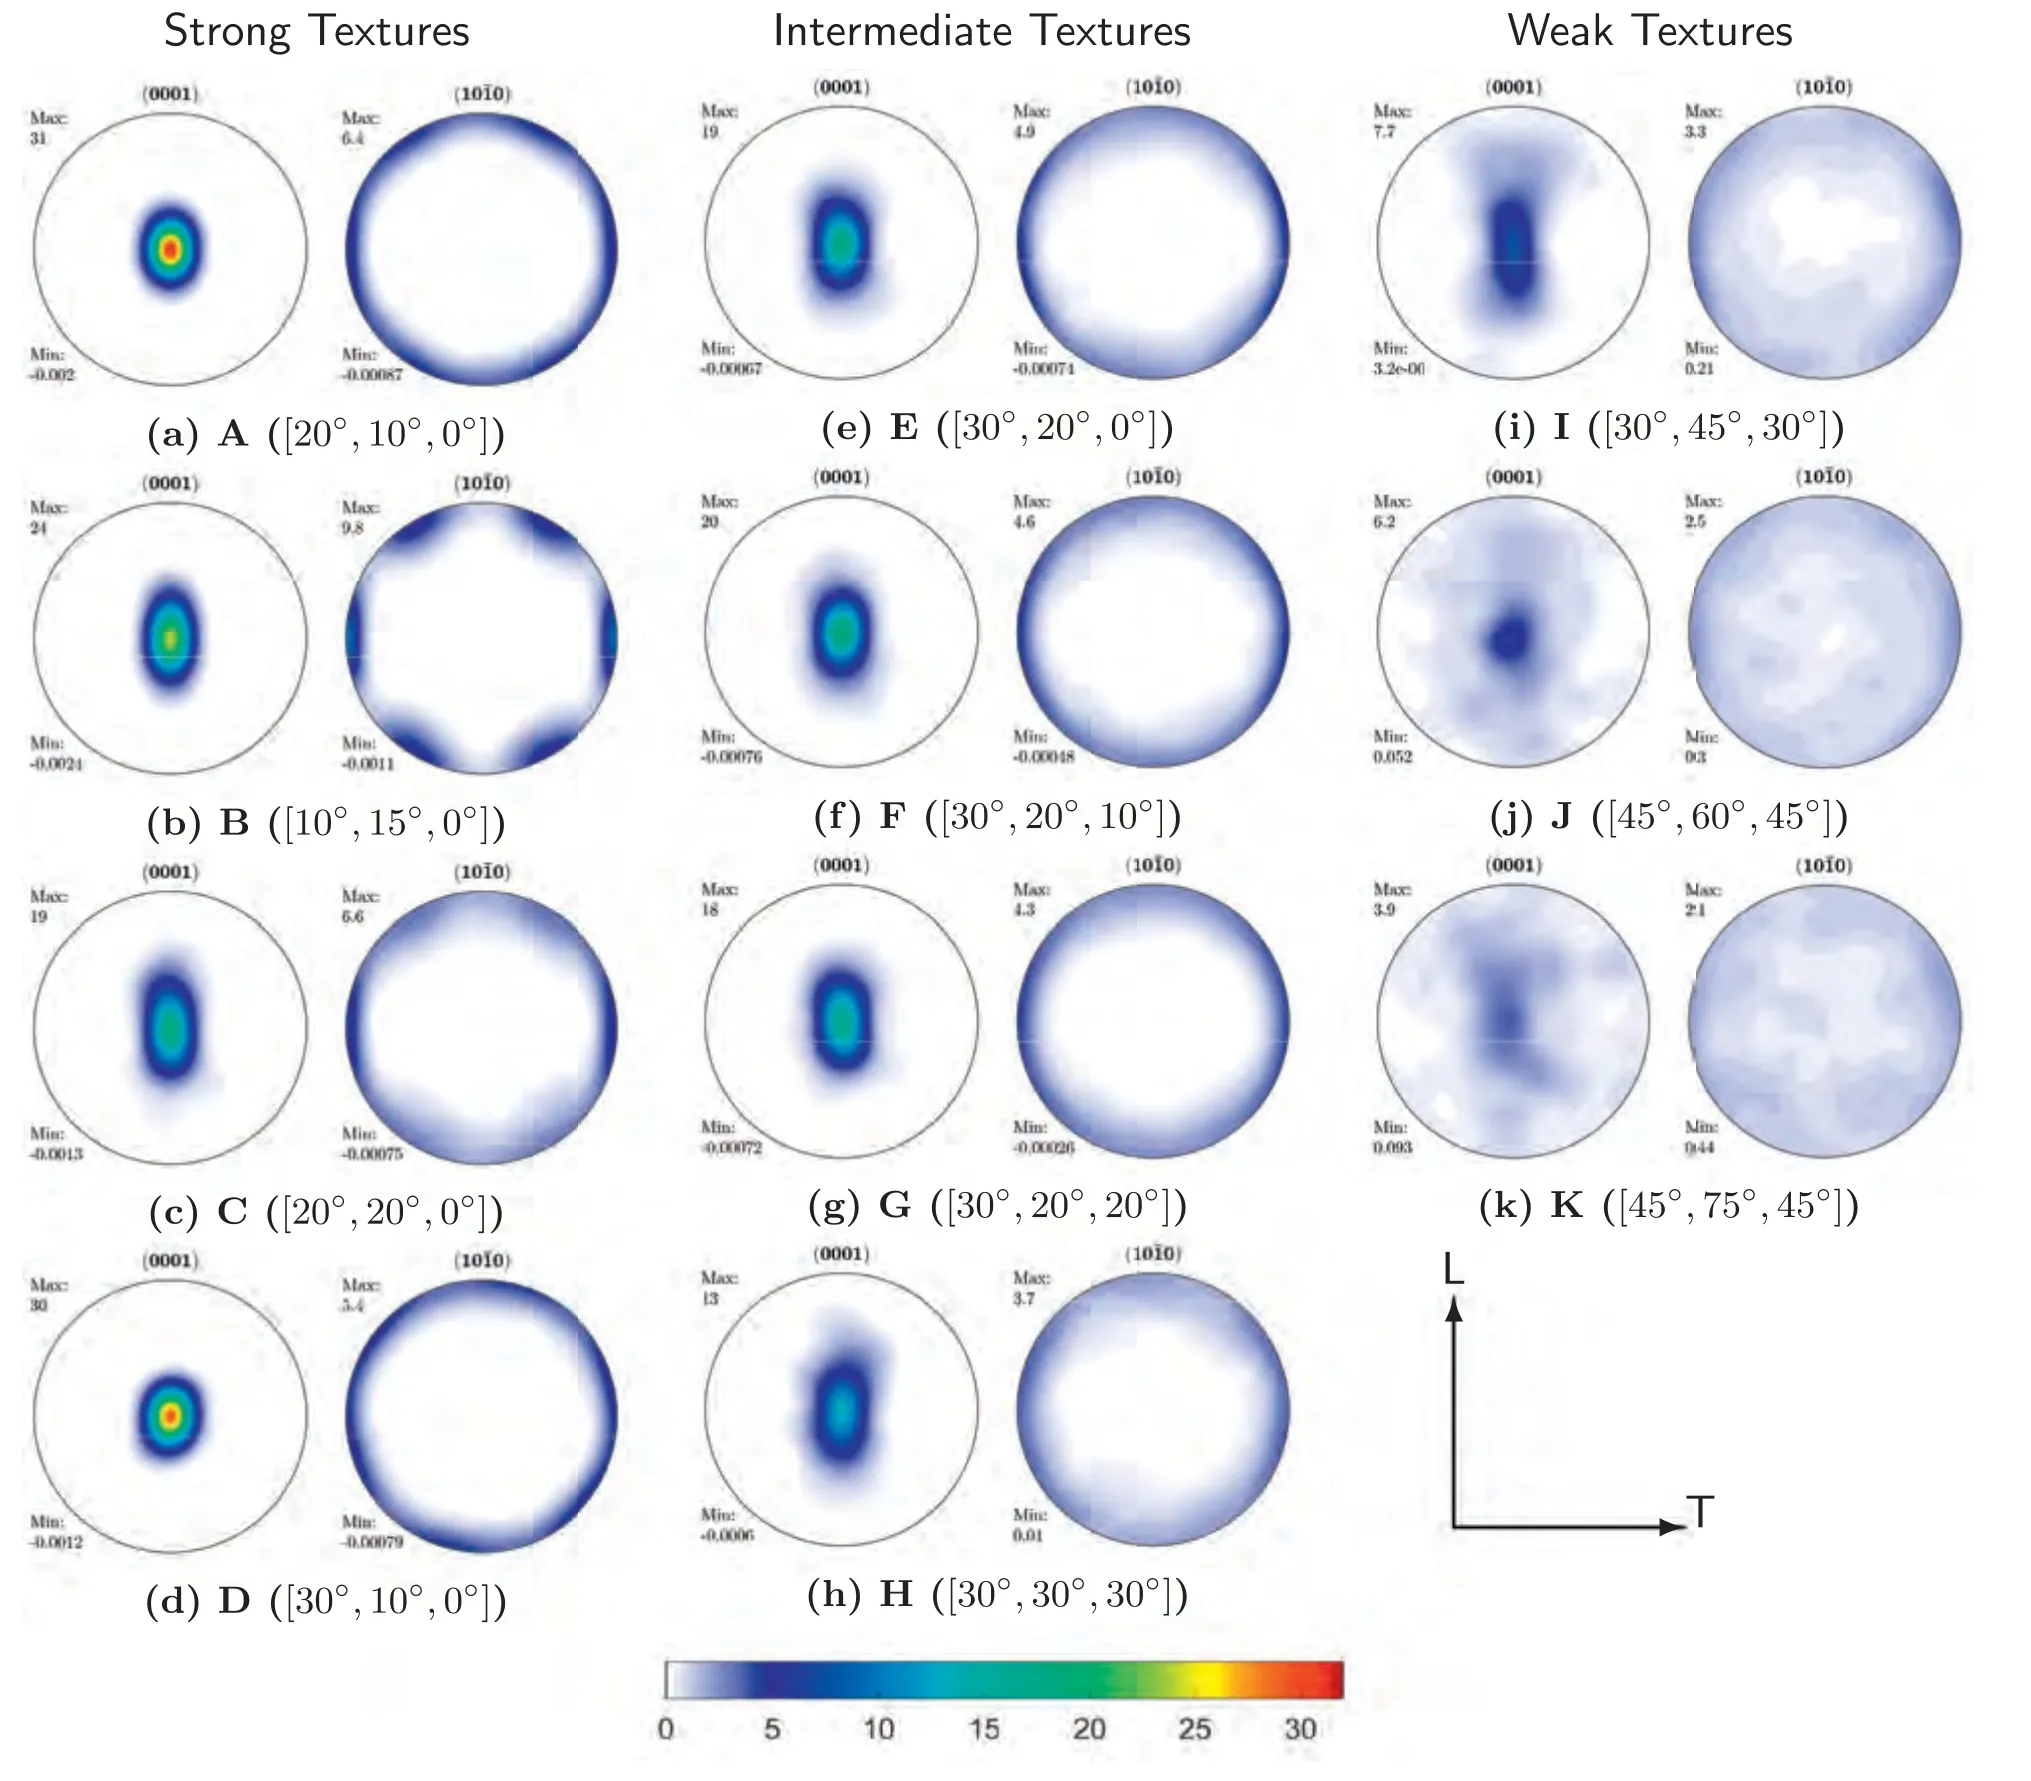
Fig.2.Initial [0001] and [100] pole figures projected on the LT plane for textures A-K.For a particular texture,the angles in the brackets indicate the maximum standard deviations in the Euler angles.
Table 3 Average Hall-Petch Coefficients () and standard deviations for tensile and compressive loading.
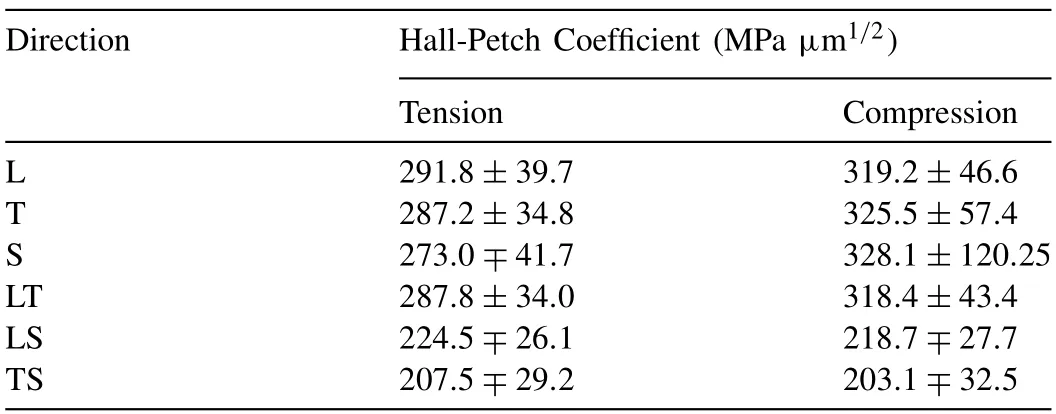
Table 3 Average Hall-Petch Coefficients () and standard deviations for tensile and compressive loading.
Table 3 summarizes the predicted average Hall-Petch coefficients () and standard deviation in tension and compression computed from Fig.3.Several salient points can be deduced.Whilevalues depend on the loading direction,for a given directionin compression is greater than in tension(save for LS and TS,which show similar values in tension and compression).In a review by Yu et al.[8],a similar trend is reported for principal loading directions.In tension and in compression along the L,T,and LT directions,values roughly coincide with each other suggesting the relatively isotropic grain size strengthening in these directions.On the other hand,the loading orientations involving the S-direction(i.e.,S,LS,and TS) exhibit very distinctvalues,in both tension and compression.Interestingly,the LS and TS values are much lower than the corresponding individualvalues in L,T,and S directions;Moreover,the tensile and compressivevalues in LS and TS are closer to their tensile counterparts.In the Table,the standard deviations indicate the role played by initial textures strengths.In all cases except S-compression,the textural effect is around∼10-15%.
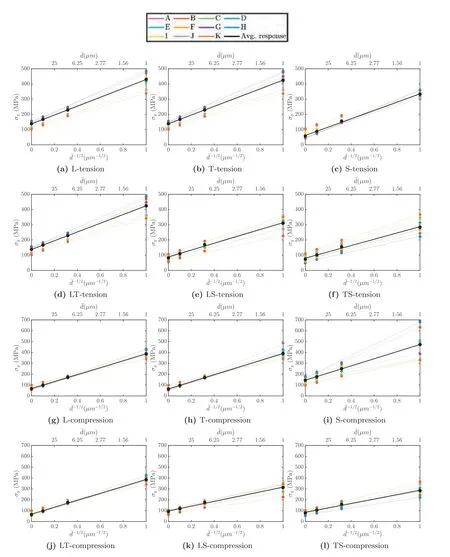
Fig.3.Hall-Petch plots for uniaxial loading in tension (Panels a–f) and compression (Panels g–l).Symbols are crystal plasticity results and lines are Hall-Petch fits.Black solid line indicate the average of the trends for a given loading orientation.
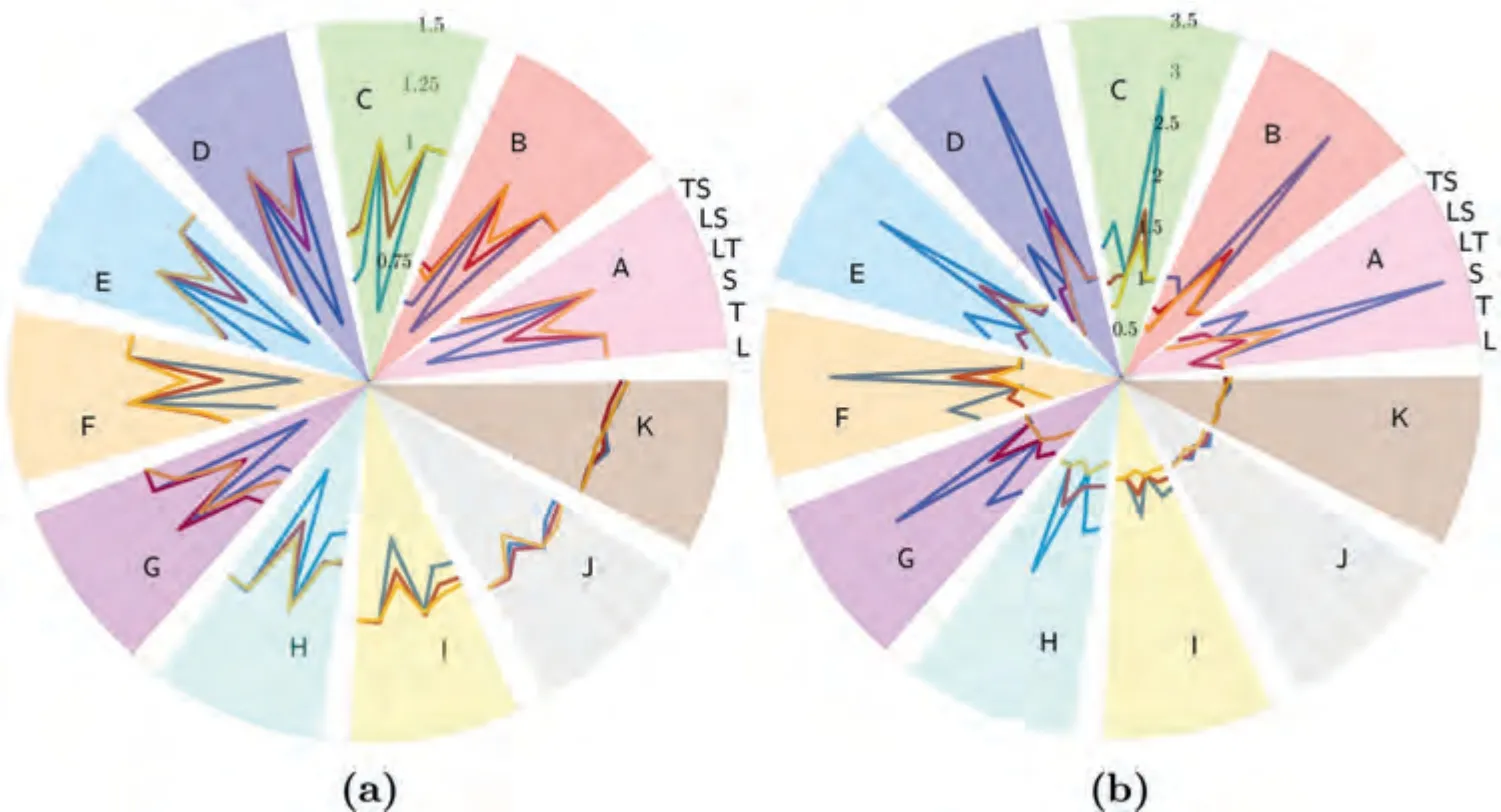
Fig.4.Normalized polar plots of texture and grain-size dependent yield anisotropy for loading in (a) tension and (b) compression.Base material (blue),=10 μm (red),and=1 μm (yellow).(For interpretation of the references to colour in this figure legend,the reader is referred to the web version of this article.)
For S-compression the textural effect is∼36%,much larger than the rest.Overall,such high standard deviations indicate that for a given loading direction the texture-grain size coupling is non-negligible.We note that the bounds predicted by the current simulations for the L,T,and S directions match reasonably with experimental range∼210-350 MPa μm1/2reported for AZ31 Mg alloys [9,51–53],although the underlying material parameters are not fitted to any particular experimental data set.Moreover,the broader correlations of the Hall-Petch coefficient with textural intensity corroborate with those reported by a wide range of experiments [8].
3.2.Macroscopic anisotropy and tension-compression asymmetry
Fig.4 shows the effect of grain size on the anisotropy in the yield stress in tension (Fig.4a) and in compression(Fig.4b) for the different textures (indicated by the different colored sectors).In the figure,for a given loading state (tension or compression),each sector is split into six sub-sectors-each representing a particular loading direction,cf.Table 1.The yield stress for a particular loading direction is normalized with respect to the yield stress for the L-direction.Along with the Base material case,the figure collates the plastic anisotropy trends for=10 μm and=1 μm.
Broadly speaking,for a given texture the yield anisotropy decreases with decreasing grain size.On the other hand,the effect of texture for a given grain size is not that straightforward.In tension (Fig.4a),textures A-G exhibit very similar trends for the yield anisotropy -i.e.,L,T,and LT exhibit similar yield stresses,whereas S,LS,and TS are much lower(governed by extension twinning).For the weakest textures(I-K),the response tends to be increasingly less anisotropic.
In compression (Fig.4b),the S-direction response is significantly stronger than the rest of the loading directions for the stronger textures (A-H),including the LS and TS orientations (unlike the tensile counterpart).With increasingly weakening of the initial texture,the S-compression response becomes less strong relative to the L-compression response.As in the tensile case,the weakest textures (I-K) the response becomes increasingly less anisotropic.
On a broader note,we see that while grain size refinement helps reduce in-plane anisotropy (i.e,L,T,LT),an overall reduction in the yield anisotropy in both,tension and compression,across all directions (L,T,S,LT,LS,TS) seems only plausible with the additional effect of textural weakening.Thus,finer grain size combined with an initial weak texture can significantly decrease the overall yield anisotropy,see for example textures I-K in Fig.4.We make a more quantitative assessment of the texture-grain size interaction on yield anisotropy in Section 4.
Fig.5 shows the grain-size dependent tension-compression asymmetry in the yield stress as a function of texture for each loading direction.Grain size reduction markedly reduces the asymmetry across all textures and all loading orientations.For a given grain size,texture H appears to be the transitional texture,beyond which a further weakening of the initial texture remarkably decreases the yield asymmetry.This is most clearly seen for the Base material.Interestingly,the trends for TS (and to a lesser extent,LS) exhibit a non-monotonic behavior as a function of the initial texture strength,where texture F (or G,in the case of LS-orientation) exhibits the highest asymmetry.
3.3.Effect on extension twinning
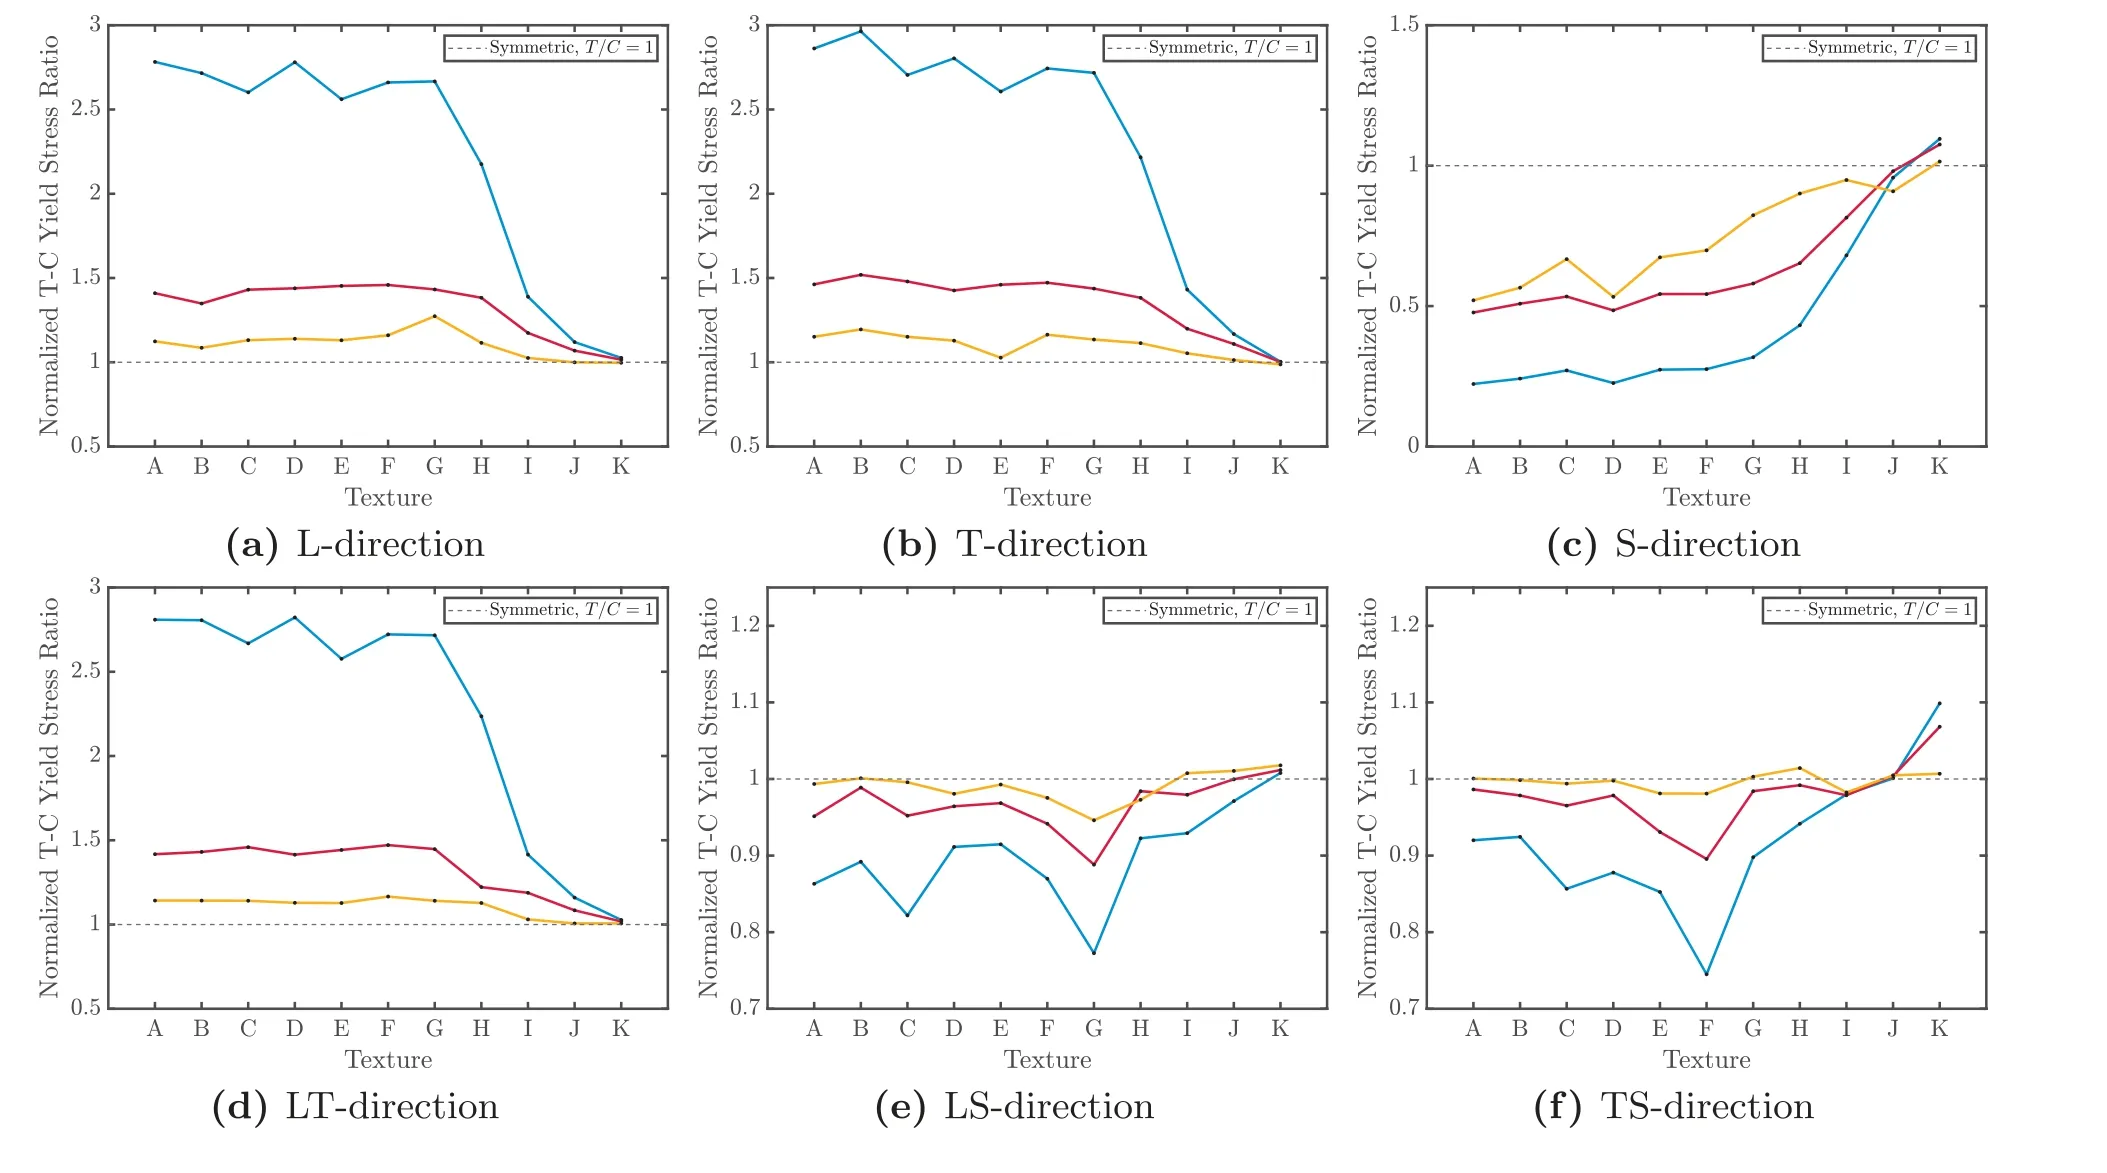
Fig.5.Grain-size effect on the texture-dependent tension-compression yield asymmetry.Base material (blue),=10 μm (red),and=1 μm (yellow).(For interpretation of the references to colour in this figure legend,the reader is referred to the web version of this article.)
4.Possible implications on damage tolerance
In plastically anisotropic materials,ductile damage process through internal porosity evolution can be expressed via [55]:
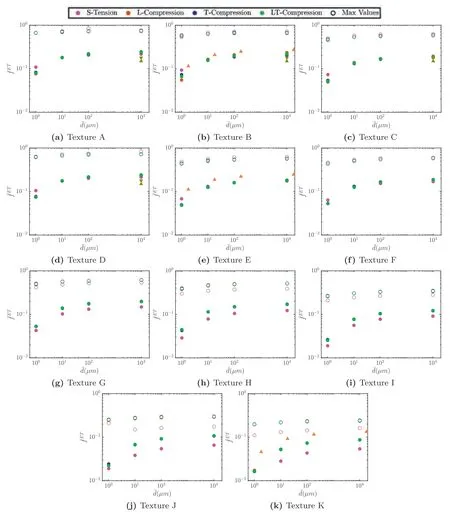
Fig.6.Grain size effect on extension twin volume fraction at Eeq∼0.015 (solid circles) and the corresponding maximum ,open circles).Colors represent the different loading orientations.Triangles are experimental data ([15],,[54]) at Eeq∼0.015 under L-compression and T-compression
where the anisotropy coefficientshL,hT,hSare the coefficients of h along the principal material directions,andhLT,hLS,hTSare those along the off-axis directions.For a plastically isotropic material,h=2;thus,h>2 indicates a material with plastic anisotropy that resists void growth relative to a plastically isotropic material whereash<2 indicates the opposite.Benzerga and colleagues adopted this theory to understand the role of texture induced plastic anisotropy in the ductility of different Mg alloys and validated the outcomes experimentally under different triaxiality conditions using round notched-bar geometries [30,57].More recently,Indurkar et al.[31] and Baweja et al.[36] explored the same idea by calculating the h coefficients using crystal plasticity results.However,those works did not investigate the role of grain size.
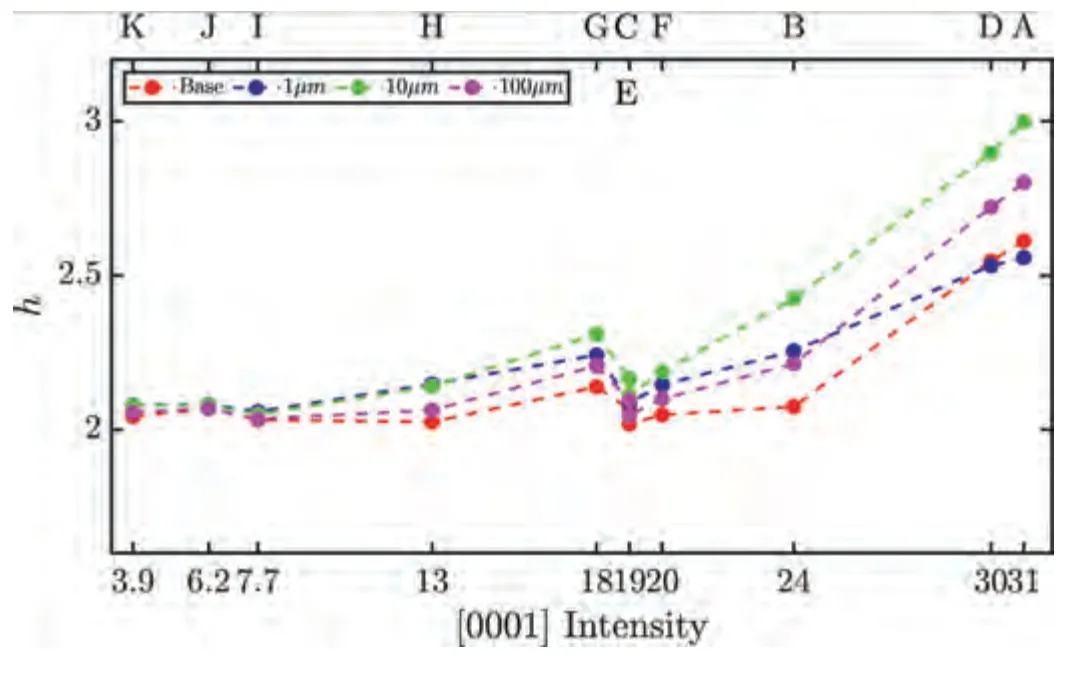
Fig.7.Correlation of h with the maximum[0001]pole intensities for textures A-K.
One limitation of the damage theory based on Eq.(1) is that it does not account for tension-compression asymmetry,which can be important[58].Given the weakening of tensioncompression asymmetry with weaker textures and grain size reduction (cf.Fig.5),we posit that the Hill-anisotropy theory may be somewhat better suited for Mg alloys in such scenarios.Hence,we perform a preliminary analysis of the grain size effect in the texture-dependent damage potency of Mg alloys,solely due to porosity growth.Given the interest in tensile damage,we computehvalues via Eq.(2) using only the tensile data from the preceding section.The reader is referred to Kondori [57] and Indurkar et al.[31] for details on computing the components of h in Eq.(2).
Fig.7 shows the role of texture inhas a function of grain size.The plots show the variation of steady-state values ofh(atEeq∼0.2) against peak [0001] intensity,cf.Fig.2.Thehvalues shows a correlation with the peak [0001] pole intensities;stronger the [0001] texture higher theh;on the other hand,there is no simple correlation ofhwith [100]pole intensities and is not shown here.Notably,the plot provides a more quantitative representation of the trends shown in Fig.4.As seen,for the range of grain sizes studied here,h→2 (plastically isotropic,cf.Eq.(2)) only when the initial textural strength is below a certain threshold.For strong textures (e.g.,A,B) the net plastic anisotropy increases for all the grain sizes.
From the standpoint of damage tolerance,the fact thath≥2 across the texture intensity range indicates that these textures tend to provide a better,or at least similar,resistance to void growth relative to a plastically isotropic material.Weaker [0001] textures (peak intensity ≾10,which are associated with textures I-K,cf.Fig.2) tend to exhibith∼2 and are insensitive to grain size.For reasons that are not currently clear,there is a small drop inhin the [0001] intensity range between∼18-24 before further increase in the initial textural strength leads to increase inh.Another notable result is that=10 μm appears to offer the most beneficial effect onhvia a synergistic interaction between the grain size induced decrease in the net plastic anisotropy and the texture induced enhancement of the net plastic anisotropy.
Using these results, the grain size and texture-dependent measure of porosity growth rate can be computed using Eq.(1).We define for a givenand texture, a relative measure of ductility as D =whereis associated with the Base material at a particular Eeq(taken here to be 0.2).Thus, D =0 indicates no relative change whereas D >0 indicates a relative improvement.Fig.8 collates D for=10 μm and=1 μm for the range of textures at two stress triaxiality levels.The results are plotted against the maximum [0001] pole intensities.For a given, D is not a monotonic function of the initial textural strength.At a fixed T, weaker (peak intensity ≾15, i.e, H-K) textures exhibit similar quantitative trends for the two grain sizes.Further, these textures show D ≈0, which suggests a negligible role of grain size in their ductility improvement relative to the Base material.By way of contrast, intermediate (peak intensity∼10-20, textures C, E-H) and stronger(peak intensity ≿20, A,B,D) textures are sensitive to.Interestingly,=10 μm shows better relative ductility than=1 μm, which suggests a non-monotonic nature of ductility with respect to the grain size.Another interesting feature is that while the trends are the same at the two values of T,the grain size effect on D appears to become more beneficial with increasing T.Moreover, for a given texture whether plastic anisotropy is beneficial or not depends on grain size.
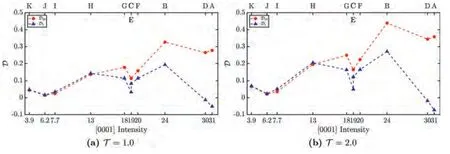
Fig.8.Effect of grain size on the relative measure of ductility (D) as a function of the peak [0001] pole intensity corresponding to textures A-K in Fig.2.Panel (a) T=1.0 and Panel (b) T=2.0.
This is most vividly seen for textures A and D whereDis positive (beneficial) for=10 μm but negative (deleterious)for=1 μm.
5.Concluding remarks
In this work,we performed extensive full-field crystal plasticity simulations to elucidate the interaction between the textural variability and grain size on the orientation-dependent behaviors of Mg alloys.The main results are summarized:
1.The grain size effect follows the Hall-Petch relations across all loading orientations and textures.The aggregate effect of the texture and grain size on the yield strength is non-negligible and depends on the loading orientation.
2.Under tensile loading,orientations dominated by extension twinning tend to show a weaker Hall-Petch effect for initially strong textures.For slip-dominated orientations,the trend is reversed.In comparison,the texture dependence of the Hall-Petch trends under compressive loading are somewhat more complicated.
3.For a given texture,the yield stress anisotropy and tension-compression asymmetry decrease with decreasing grain size.A near-isotropic yield strengthening across all six loading directions seems plausible via a combinatorial effect of grain size refinement and weak initial texture.
4.Extension twinning decreases with decreasing grain size across the range of textures considered here.The amount of reduction depends on the textural strength with weaker textures showing a relatively larger grain size effect compared to stronger textures.
5.Using a micromechanical theory of ductile damage,the effect of grain size on a relative measure of ductility is predicted to be non-monotonic with textural strength.The analysis further indicates that for a given texture,whether or not plastic anisotropy improves the ductility relative to a coarse-grained material is grain sizedependent.
6.The theory-based analysis suggests that Mg alloys may be intrinsically resistant to damage by porosity evolution,which suggests other factors such as shear localization may play a role in determining their failure.
While the results are presented for a particular set of material parameters (representing a particular Mg alloy),they should be of relevance to other Mg alloys showing similar slip and twinning behaviors.
Declaration of competing interest
The authors declare that they have no known competing financial interests or personal relationships that could have appeared to influence the work reported in this paper.
Acknowledgments
SPJ and SB acknowledge support provided by the National Science Foundation under Grant Number CMMI-1932976 and the U.S.Army Research Laboratory under Cooperative Agreement Number W911NF-12-2-0022.The views and conclusions contained in this document are those of the authors and should not be interpreted as representing the official policies,either expressed or implied,of the Army Research Laboratory or the U.S.Government.The U.S.Government is authorized to reproduce and distribute reprints for Government purposes notwithstanding any copyright notation herein.SPJ and SB acknowledge the use of the Carya clusters and the advanced support from the Research Computing Data Core at the University of Houston to carry out the research presented here.
Appendix A.HCP Mg crystal plasticity FEM model
The single crystal plasticity model of Zhang and Joshi[50] was modified to include grain size effect by Ravaji and Joshi [32].We briefly present that model here.
Mathematical preliminariesLet P and Q be second-order tensors,a fourth-order tensor P.Then,P:Q=PijQij,and P:Q=PijklQkl.The inner product PQ=PikQkj,and dyadic product P ⊗Q=PijQkl.Similarly,given vectorspandq,p⊗q=piqj,andp·q=piqi.
KinematicsGiven the deformation gradient F and its material time derivative ˙F,the total velocity gradient (L) in the deformed configuration is:
comprising the elastic(Le)and plastic(Lp)parts.The kinetics of crystal plasticity is expressed using Lpas:
The current resolved shear stress (RSS) on the slip systemαisτα=σ:(mα⊗sα) and the corresponding current slip system resistancegαis given by:
whereh0is the initial slip hardening modulus andτsis the saturation stress.The hardening rates of slip resistances due to interactions with extension and contraction twinning are chosen as:
depicting a saturation hardening for the slip due to rapid evolution of ET with a hardening modulushet-sland a nonsaturation type hardening (hardening modulusHct-sl) of the slip due to thin CTs that act as a barrier to dislocation motion[50]
For twinning,the evolution of twin volume fractionin Eq.(A.3)2is defined as:
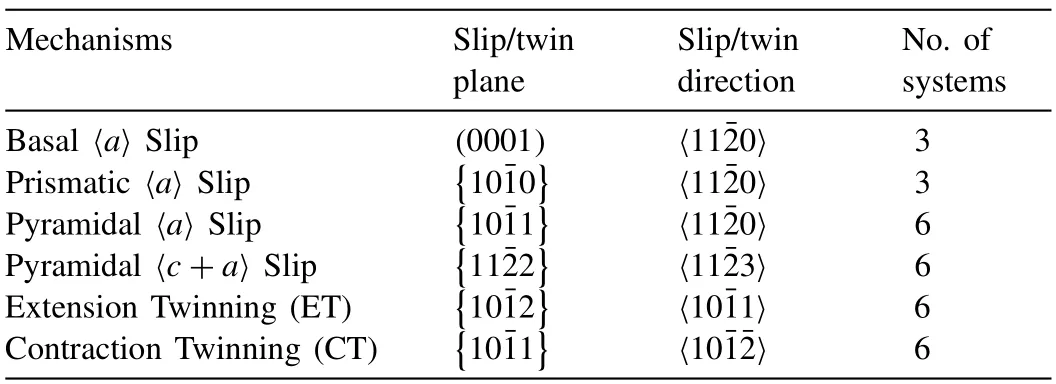
Table A1 Slip and twin systems observed in Mg single crystals.
with the twin-twin interactions for ET (Eq.(A.10)1) and CT(Eq.(A.10)2):
At a given timet,the accumulated extension twin volume fraction at each Gauss pointfET(t) and its volume-averaged representation(t) is:
Computationally,whenfET=fcr(we setfcr=0.9 [50])at a Gauss point the corresponding element volume is reoriented to the twinned orientation of the variantβthat has the largest contribution.Upon reorientation,thefETat the particular Gauss point is reset to zero.Therefore,0 ≤(t)≤1.A twinned region in a grain becomes a new sub-grain that plastically deforms slip and/or twinning (i.e.double twinning is possible).The same approach is adopted for contraction twinning.
For a polycrystalline material with a grain size distribution(Fig.1),an equivalent grain diameterdeqis obtained for each grain.Then,for each grain,the CRSS(cf.Eqs.(A.4) and(A.9)) of a deformation systemi=(α,β) as [9,10]:
The saturation stressesτsfor slip (Eq.(A.6)) and twinning (Eq.(A.10)) are also assumed to be grain-size dependent[60,61].Per Ravaji and Joshi [32],we assume:
Appendix B.Overall responses
B1.Principal material directions
Fig.B.1 shows the grain size-dependent uniaxial tensile stress-strain responses (Fig.B.1a,d,g),Lankford ratios(Fig.B.1b,e,h) and relative activities (Fig.B.1c,f,i) for all eleven textures (A-K) when loaded along the three principal material directions (L,T,and S).In all the plots,the solid lines indicate the responses of Base material for a given texture.
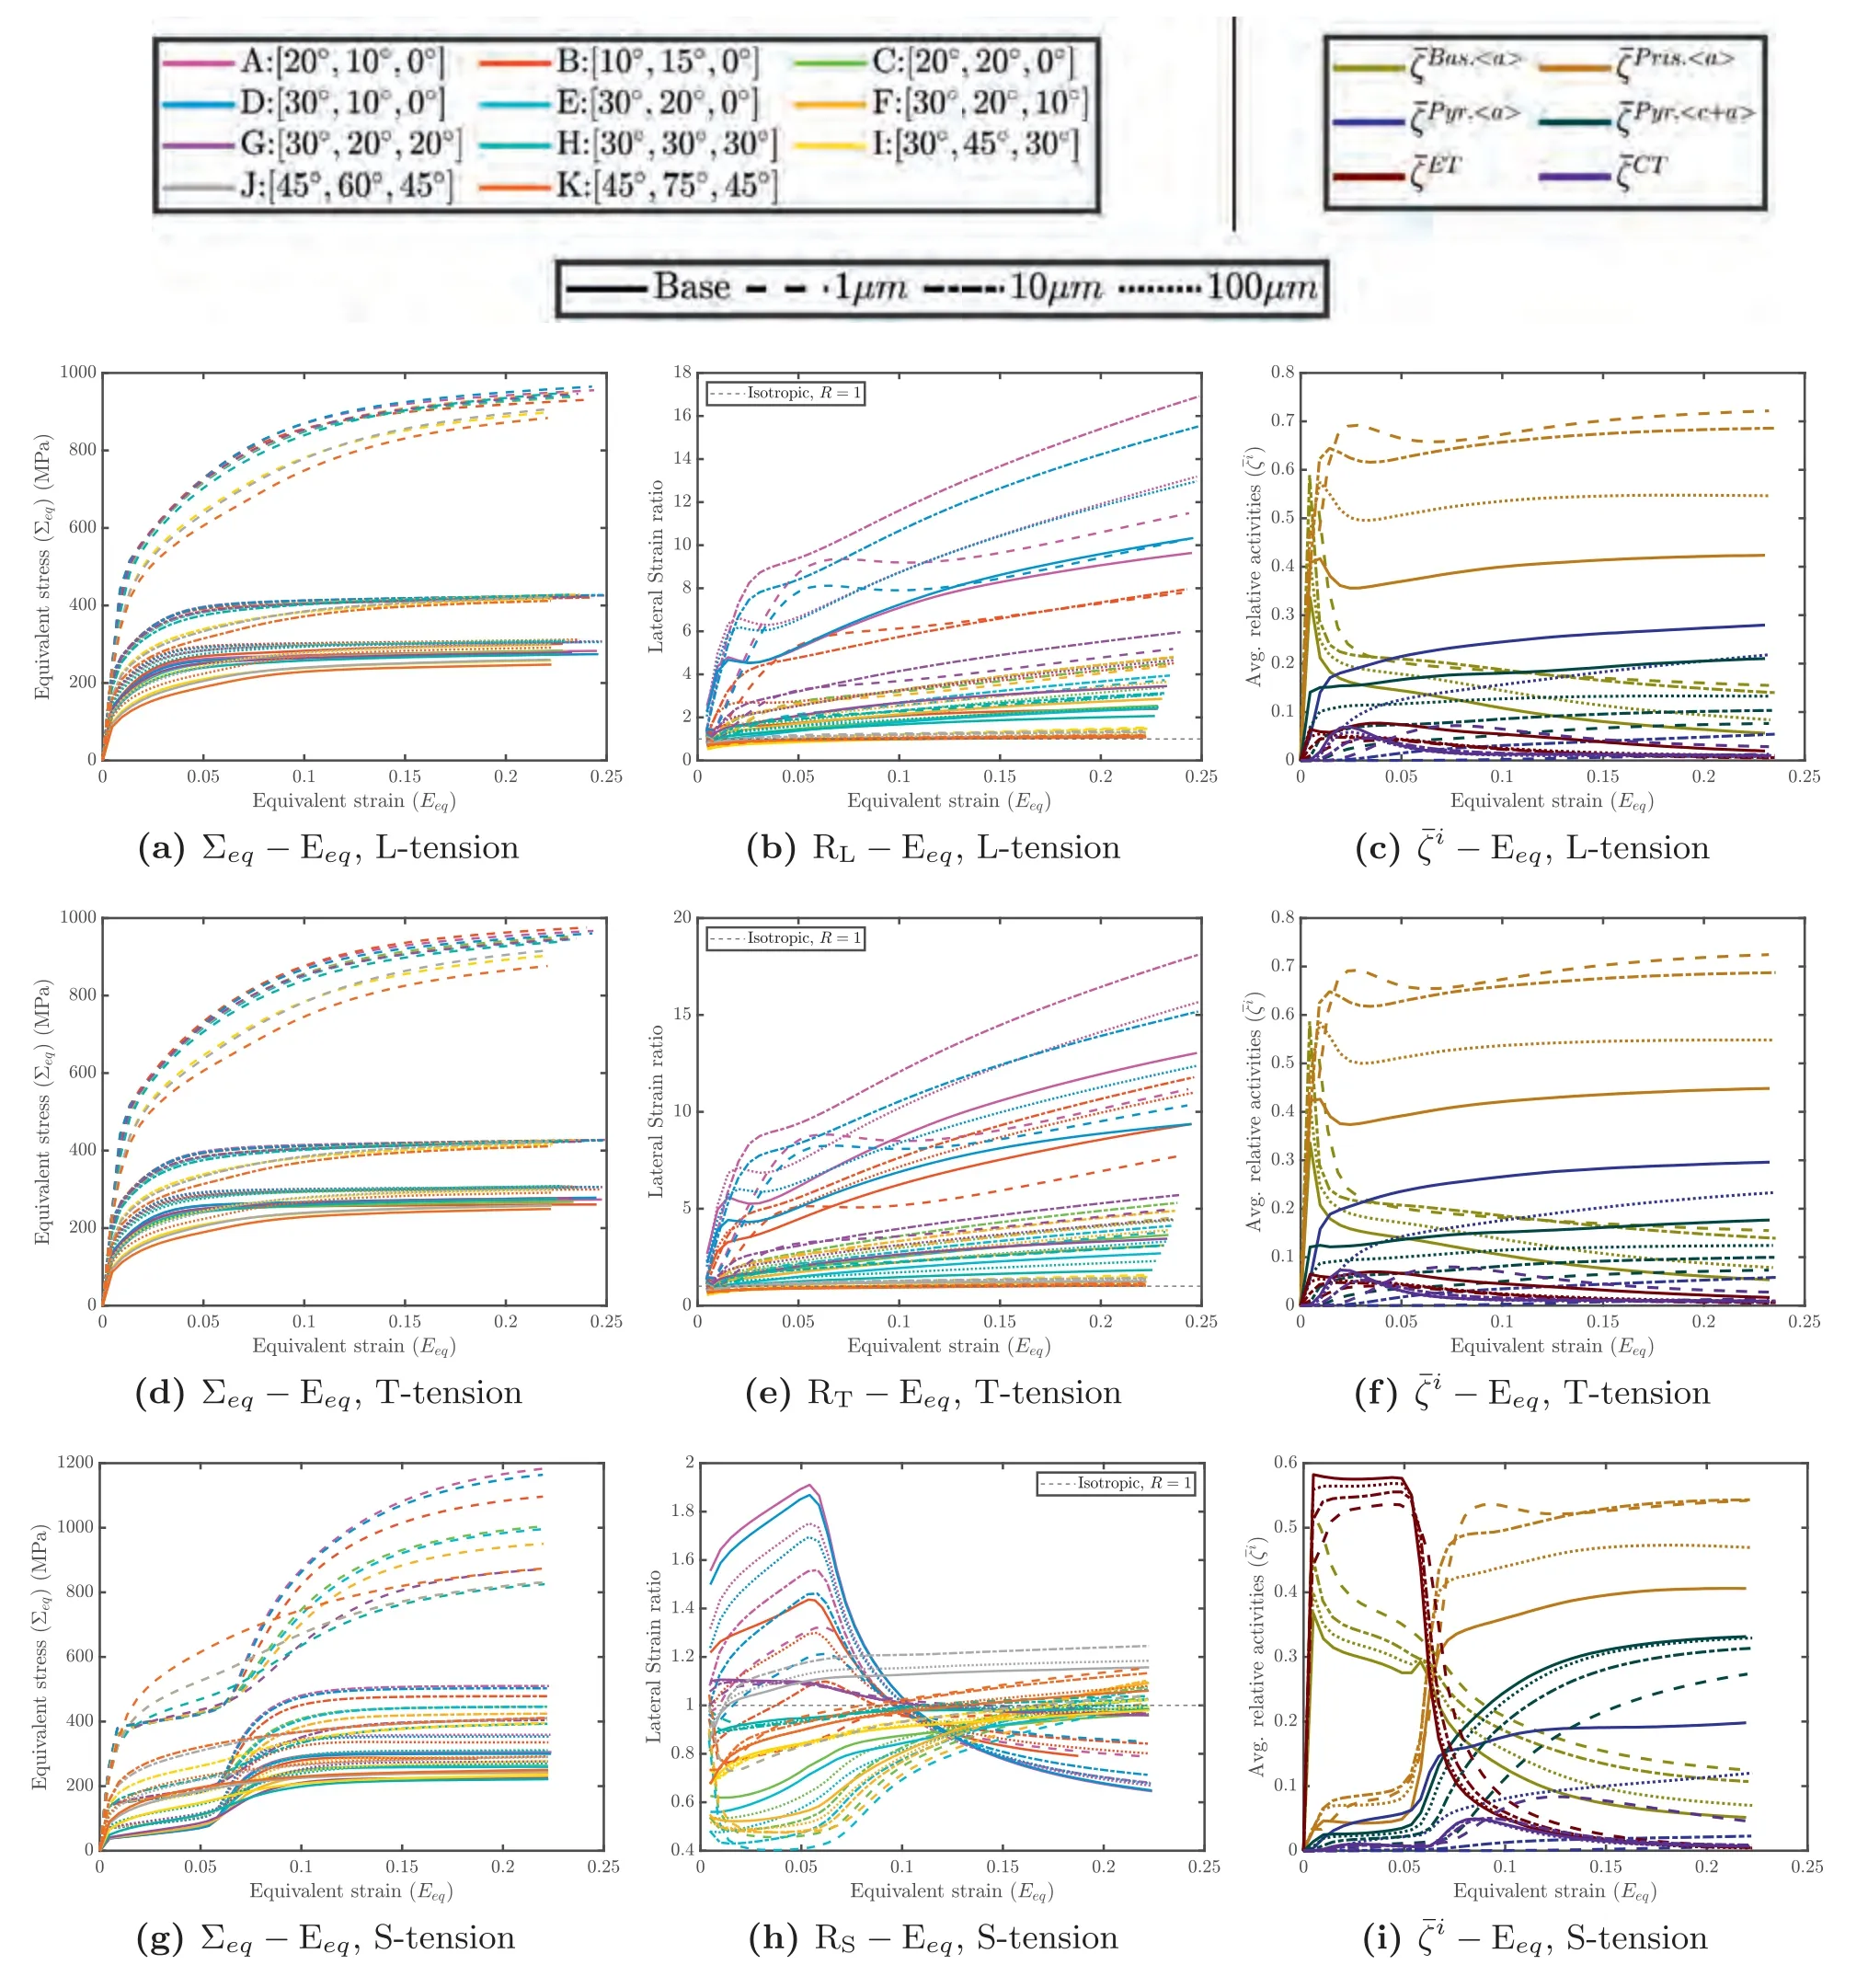
Fig.B1.Uniaxial tension along principal material directions L,T and S.Texture effects on the evolution of (i) equivalent stress-equivalent strain (panels (a,d,g)),(ii) lateral strain ratio (panels (b,e,h)),and (iii) relative activities of deformation mechanisms (panels (c,f,i)).
While the tensile stress-strain responses along the L-(Fig.B.1a) and T-(Fig.B.1d) directions reveal a stronger grain size effect and a relatively small textural effect,the S-tension stress-strain responses (Fig.B.1g) show a much higher sensitivity to textural variation.In fact,at moderate strain levels(Eeq∼0.05)in S-tension,stronger textures(e.g.,A–D) appear to have comparable stress levels at=1 μm and=10 μm.For most textures (except textures J and K),the S-tension responses are sigmoidal,which is indicative of dominant extension twinning.Moreover,these sigmoidal behaviors are relatively insensitive to textural strengths up toEeq∼0.06 beyond which they exhibit a stronger sensitivity to textural variations -the stronger the texture the higher the jump in the stress level beyondEeq∼0.06.
The corresponding results for uniaxial compression are collated in Fig.B.2.Along the L and T directions,the textural effects on the on the yield stress and strain hardening are marginal relative to the grain size effect,similar to that in tension.By way of contrast,in S-compression the texture effect is remarkable,particularly for=1 μm.Up toEeq∼0.05 the stronger textures (e.g.,texture A,B) corresponding to=10 μm achieve very similar stress levels as the weakest textures (e.g.,J,K) with=1 μm.Beyond these moderate strain levels the smaller grain size responses of the weaker textures deviate noticeably (exhibit stronger strain hardening) compared to their the larger grain size responses of the stronger textures.
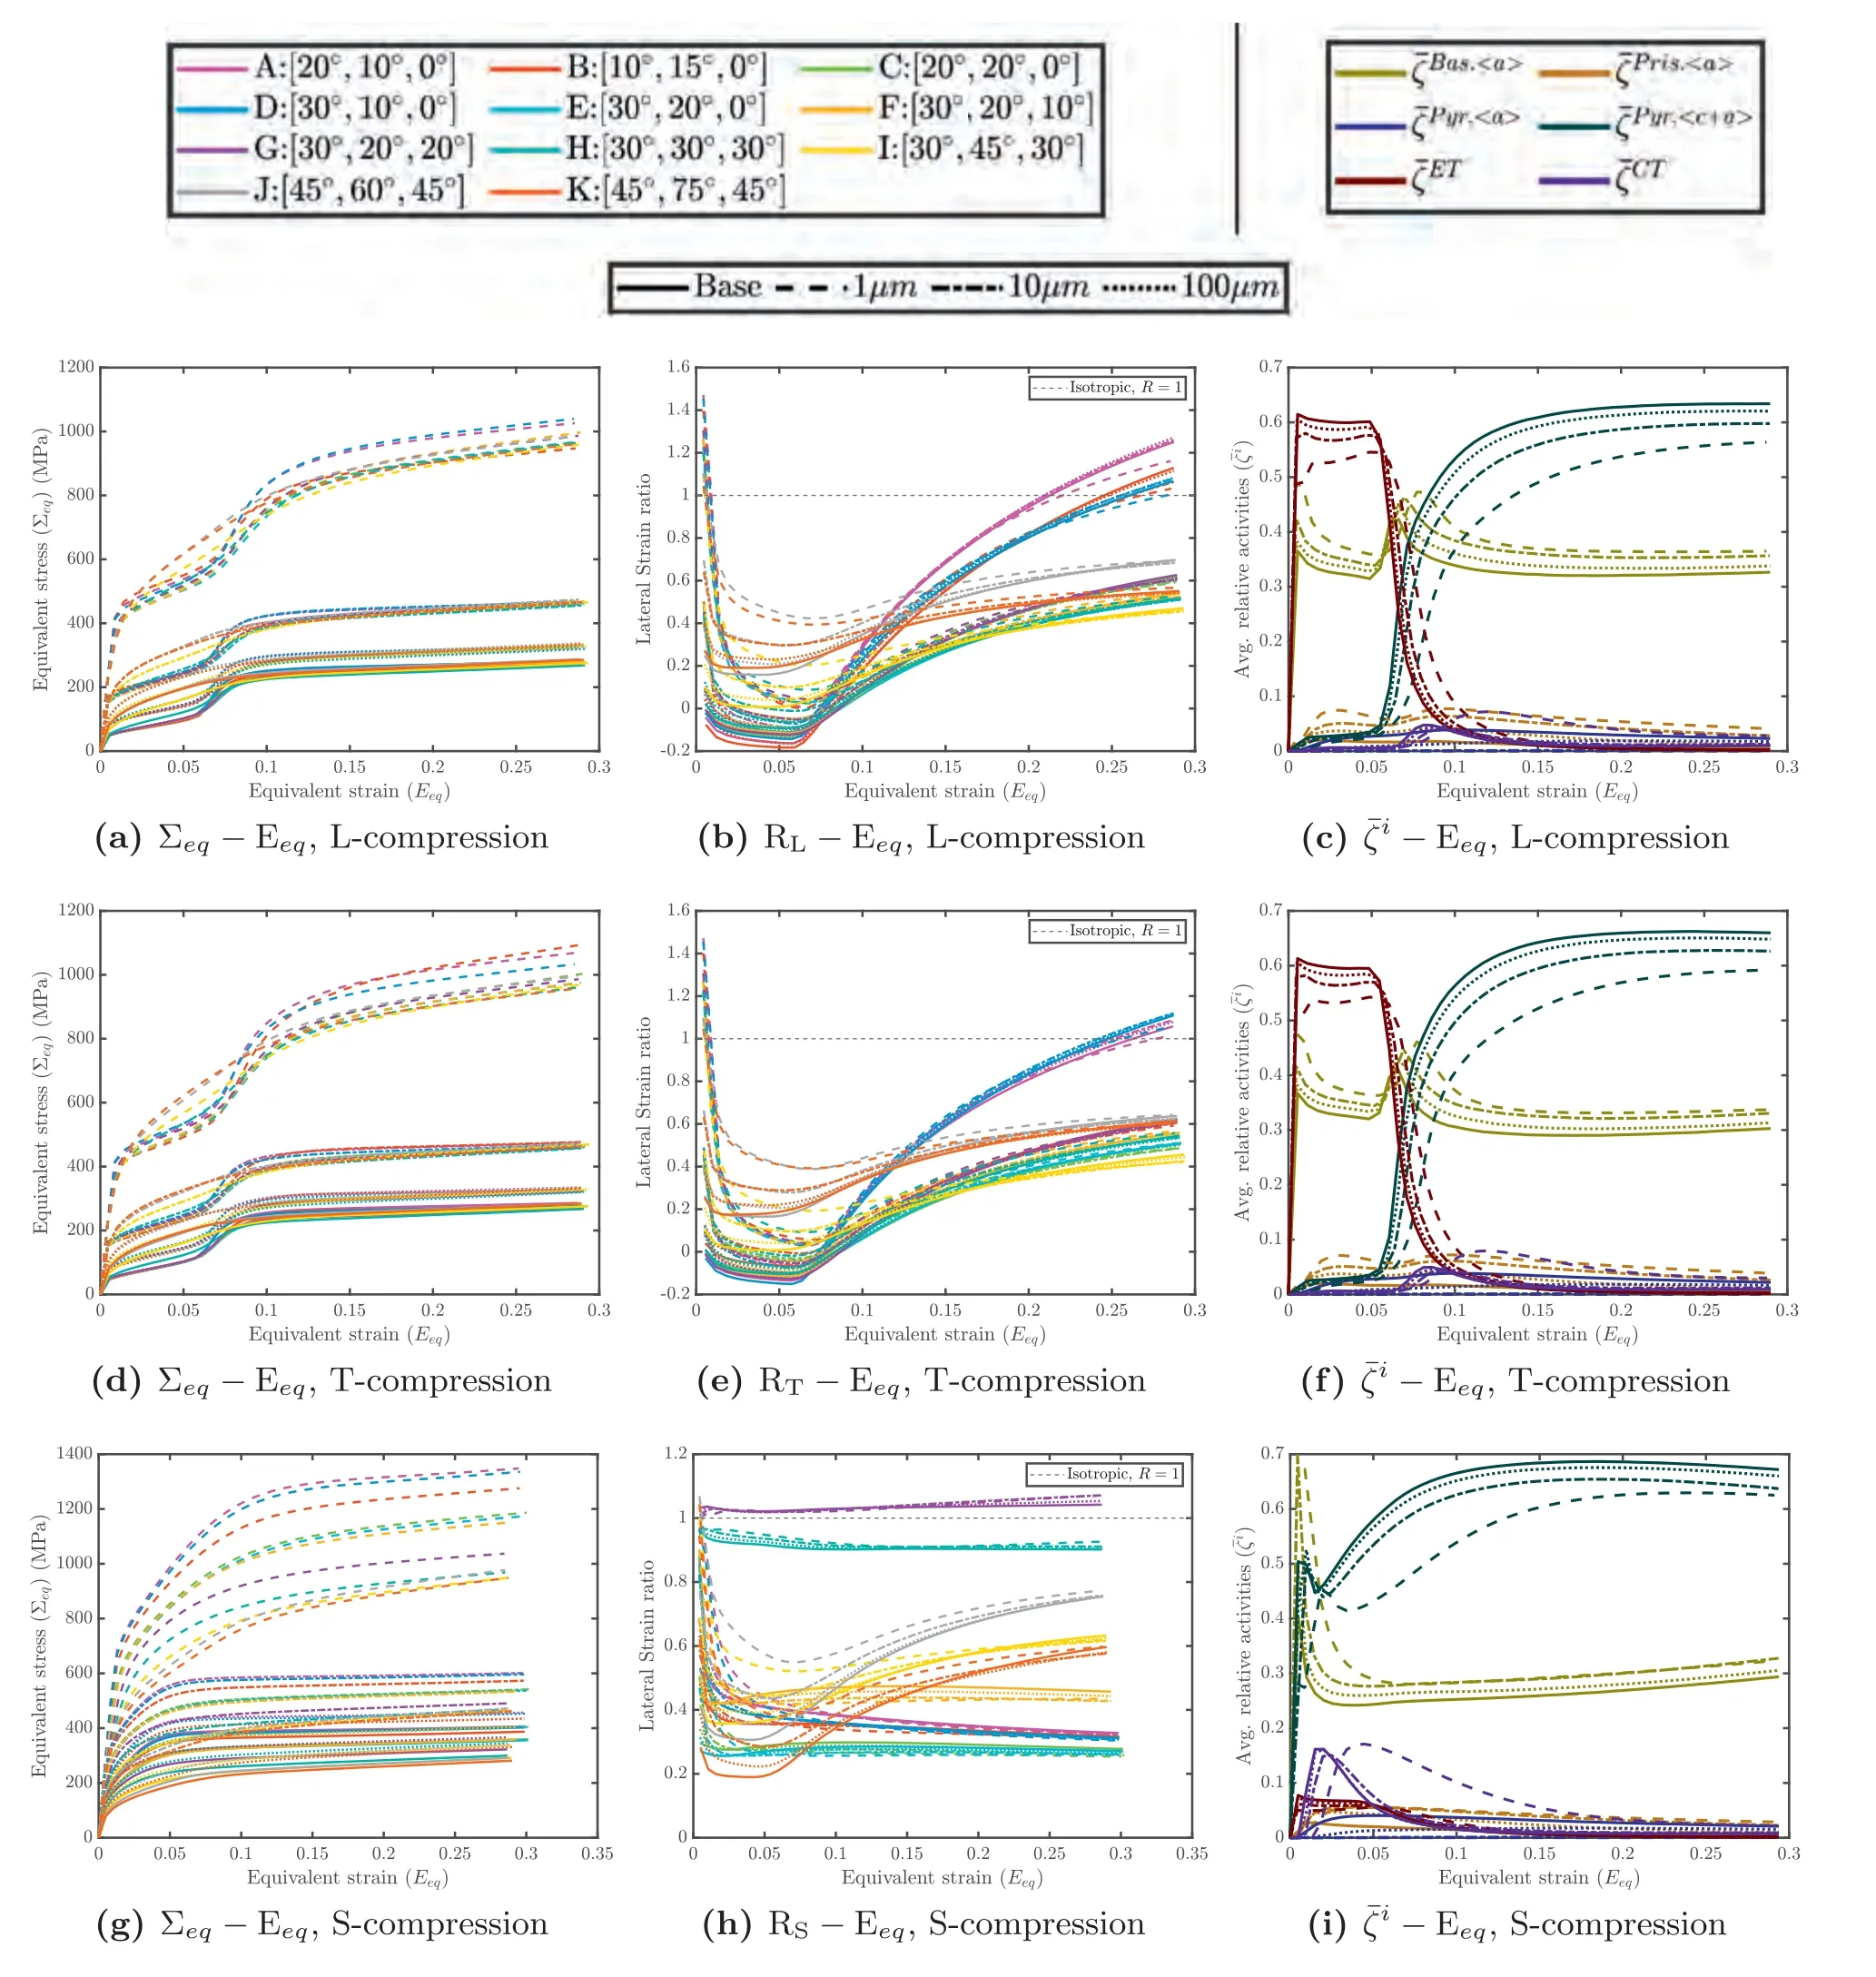
Fig.B2.Uniaxial compression along principal material directions L,T and S.Texture effects on the evolution of (i) equivalent stress-equivalent strain (panels(a,d,g)),(ii) lateral strain ratio (panels (b,e,h)),and (iii) relative activities of deformation mechanisms (panels (c,f,i)).
B2.Off-axis directions

Fig.B3.Uniaxial tension along three off-axes directions (LT,LS and TS).Texture effects on the evolution of (i) equivalent stress-equivalent strain (panels (a,d,g)),(ii) lateral strain ratio (panels (b,e,h)),and (iii) relative activities of deformation mechanisms (panels (c,f,i)).
The tensile and compressive responses along the offaxis directions (LT,LS,and TS) are respectively shown in Figs.B.3 and B.4.Many of the features discussed in the stress-strain responses along principal axis loading are also seen in the off-axis responses and are not repeated for brevity.Instead,some distinctive characteristics are highlighted.Under LS-tension (Fig.B.3d),sigmoidal responses are absent at all grain sizes and for all textures,which indicates low extension twinning;this is corroborated from the relative activity plot,cf.Fig.B.3f.In contrast,LT-compression (Fig.B.4a exhibits sigmoidal responses for all grain sizes and most textures (save for textures I,J,and K),which is consistent with the high extension twinning relative activity,cf.Fig.B.4c.Remarkably,TS-compression responses also lack sigmoidal characteristics due to low twinning.These trends indicate that the effect of loading direction (at least in the off-axis responses) is generally a governing factor in the mechanism activation compared to texture or grain size,which manifests in the macroscopic stress-strain behaviors.Another interesting characteristic pertains to TS-orientation.Both,TStension (Fig.B.3g) and TS-compression (Fig.B.4g) show stronger effects of texture for all grain sizes to the extent that many strong texture-large grain size combinations are virtually indistinguishable from weak texture-small grain size combinations.Moreover,while LT-tension generally shows that a stronger texture with smaller grain size results in a stronger overall stress-strain behavior (Fig.B.3a),in LStension (Fig.B.3d) and in TS-tension (Fig.B.3g),generally a stronger texture tends to produce a weaker response for a given grain size.This effect is most discernible at=1 μm.In other words,for these latter loading orientations,stronger textures oppose the grain size strengthening effect.Similar trends are also observed in LS-compression (Fig.B.4d) and TS-compression (Fig.B.4g).In passing,we note that the LTcompression (Fig.B.4a) responses are rather insensitive to the textural strengths,except their role in extension twinning,compare textures I-K (low extension twinning) against textures A-H (relatively higher extension twinning).
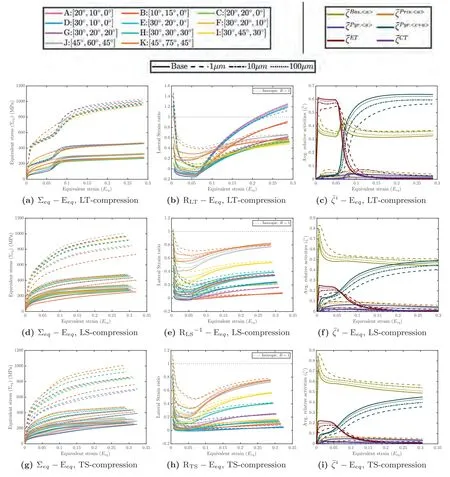
Fig.B4.Uniaxial compression along off-axes directions (LT,LS and TS).Texture effects on the evolution of (i) equivalent stress-equivalent strain (panels (a,d,g)),(ii) lateral strain ratio (panels (b,e,h)),and (iii) relative activities of deformation mechanisms (panels (c,f,i)).
杂志排行
Journal of Magnesium and Alloys的其它文章
- Magnesium and its alloys for better future
——The 10th anniversary of journal of magnesium and alloys - Magnesium alloys in tumor treatment: Current research status,challenges and future prospects
- Twin-solute,twin-dislocation and twin-twin interactions in magnesium
- Recent advances on grain refinement of magnesium rare-earth alloys during the whole casting processes: A review
- Magnesium research in Canada: Highlights of the last two decades
- Structure-function integrated magnesium alloys and their composites
