Enhancing corrosion resistance of ZK60 magnesium alloys via Ca microalloying: The impact of nanoscale precipitates
2023-12-27WeiFuHejieYngTinshuLiJipengSunShengwuGuoDqingFngWeichoQinXingdongDingYiminGoJunSun
Wei Fu ,Hejie Yng,* ,Tinshu Li ,Jipeng Sun ,Shengwu Guo ,Dqing Fng,* ,Weicho Qin,Xingdong Ding,*,Yimin Go,Jun Sun
a State Key Laboratory for Mechanical Behavior of Materials, School of Materials Science and Engineering, Xi’an Jiaotong University, Xi’an 710049, China
b Fontana Corrosion Center, Department of Materials Science and Engineering, The Ohio State University, Columbus, OH 43210, United States
c State Key Laboratory of Metal Extrusion and Forging Equipment Technology, Xi’an, Shaanxi 710018, China
d China National Heavy Machinery Research Institute Co., Ltd, Xi’an, Shaanxi 710018, China
Abstract Enhancing corrosion resistance of Mg-Zn alloys with high strength and low cost was critical for broadening their large-scale practical applications.Here we prepared solutionized,peak-and over-aged ZK60 alloys with and without microalloying Ca (0.26 wt.%) to explore the effects of nanoscale precipitates on their corrosion behavior in detail via experimental analyses and theoretical calculations.The results suggested the peak-aged ZK60 alloy with Ca addition showed improved corrosion resistance in comparison with the alloys without Ca,owing to the contribution of Ca on the refinement of precipitates and increase in their number density.Although the precipitates and Mg matrix formed micro-galvanic couples leading to dissolution,the fine and dense precipitates could generate “in-situ pinning” effect on the corrosion products,forming a spider-web-like structure and improving the corrosion inhibition ability accordingly.The pinning effect was closely related to the size and number density of precipitates.This study provided important insight into the design and development of advanced corrosion resistant Mg alloys.
Keywords: Magnesium;Precipitates;Microalloying;Electrochemical test;Pinning effect;Calculation.
1.Introduction
Magnesium (Mg) alloys are considered one of the most attractive structural and functional materials for aerospace,electronics and biodegradable industries due to their low density,high strength-to-weight ratio,excellent castability and good biocompatibility [1–5].However,the extreme susceptibility to galvanic corrosion is a great limit for their wide applications [6,7].Numerous efforts have been devoted to improving corrosion resistance of Mg alloys via different techniques,such as surface coating technologies [8],corrosion inhibitors[9],and alloying.Addition of alloying elements can simultaneously improve mechanical and corrosion properties of Mg alloys [10].The alloying elements contribute to form intermetallic compounds particles in Mg matrix,which possibly decreases the anodic effect.The intermetallic particles formed in EW75 alloy are reported to be more active than Mg,acting as micro-anodes.This is different from the effects of other intermetallic phases in traditional Mg alloys [11].However,the high content of rare earth(RE)element significantly increases cost,thus considerably limiting practical applications of Mg-RE alloys.A great attention has been focused on developing RE-free Mg alloys with superior corrosion resistance[12–14].RE-free Mg alloys,such as Mg-Al [15],Mg-Zn [16]and Mg-Mn [17]have been investigated extensively.As reported previously,the micro-alloying contributes to form various multiscale second phase particles in different sizes and distributions in the Mg matrix.For example,the addition of 1 wt.%Ca results in the formation of reticular Al2Ca phase,which improves corrosion resistance of AZ91D alloys [18].Microalloying of AZ91 Mg alloys with trace addition of Be leads to significant increase in oxidation resistance at elevated temperatures because Be retards outward diffusion and vaporization of Mg ions [19].
Mg-Zn based alloys are promising high strength Mg alloys due to the precipitation strengthening effects.ZK60 alloy,as structural and biodegradable material,is widely utilized in many engineering and biomedical applications.Zr addition to Mg-Zn alloys is aimed to refine the grain [20],and Zn element in the Mg-Zn-based alloy contributes to form nanoscale rod-shaped precipitates and increase its strength [21].However,galvanic couples can form between the precipitates and matrix.Corrosion intensity highly depends on the size,morphology,fraction and distribution of precipitates [22–26].The disk-shapedβprecipitates in AZ91D Mg alloy serve two roles,as a barrier and as a galvanic cathode,depending on their distribution and volume fraction.If the intergranularβprecipitate has a small volume fraction,it mainly serves as a galvanic cathode.If the volume fraction is high,it mainly acts as an anodic barrier to inhibit the overall corrosion of the alloy [22].In other words,the precipitate size,distribution and volume fraction can affect corrosion behavior of Mg alloys synthetically.
High-strength Mg-Zn alloys micro-alloyed with Ca have been developed recently [27,28].Ca additions in Mg-Zn alloys significantly refine the grain size [27],and improve the formability [29].The Mg-Zn-Ca alloy is considered promising as low-cost and high-strength Mg alloy due to strong aging response [30,31].A considerable number of reports have indicated significant improvements in mechanical behavior of Mg-Zn alloys by refining microstructures via trace Ca addition combined with appropriate heat treatments.Ma et al.[32]have found that microalloying Ca has strong aging strengthening effect on Mg-Zn alloys due to the stability of G.P.zones.Du et al.[28]have reported that trace addition of Ca can effectively improve the strength of the as-extruded Mg-6Zn alloy,which is mainly attributed to the refined dynamic recrystallized grains,densely distributed precipitates,and deformed regions with high-density dislocations and strong basal texture.Du et al.[33]have also revealed that the addition of Ca can improve mechanical properties at elevated temperature,which is caused by the formation of stable compound Ca2Mg6Zn3pinning the grain boundaries.Bettles and Gibson [30]have indicated that the microstructure of the Mg-4 wt.% Zn modified by 0.35 wt.%Ca is more complex and possesses a much refined precipitate structure.A significant improvement in creep resistance is achieved for the stable precipitates at elevated temperatures.
The improved mechanical properties of Mg-Zn alloys with Ca microalloying indicates broad application prospect of this alloy,then corrosion behavior becomes a major concern.Mandal et al.[34]have found corrosion resistance of Mg-2.4Zn alloy with microalloying Ca is improved for the following factors: the fine grain size and homogeneous distribution of the second phase precipitates;the formation of insoluble and adherent corrosion products (CaCO3or complex carbonates) that are more stable than the Mg(OH)2film.Mandal and Mondal [35]have also reported the presence of Ca in ZK60 alloy is conducive to forming an adherent protective layer on the alloy surface after an immersion test,thus improving its corrosion resistance.Lisitsyn et al.[36]have claimed that the addition of Ca to Mg-6Zn-0.5Si-0.5Mn alloy reduces the corrosion rate due to stabilization of the oxide/hydroxide film of Mg caused by modification and formation of the polygonal type of Mg2Si.However,there lack systematical researches on the exhaustive effects of intragranular nanoscale precipitation phases tailored by microalloying Ca and heat treatments on the corrosion behavior of ZK60 alloys,such as the correlation between morphology,size and density of nanoscale precipitates and intensity of galvanic corrosion.
In this study,solutionized,peak-aged,and over-aged ZK60 alloys with and without microalloying Ca have been prepared.The microstructures with different nanoscale precipitation phases are carefully characterized.Corrosion behavior of the ZK60 and ZK60-Ca alloys under different heat treatments are evaluated using electrochemical and immersion tests in 3.5 wt.% NaCl solution.The corrosion mechanisms are explored through detailed analysis of the measurements via scanning electron microscopy (SEM),transmission electron microscope (TEM),X-ray photoelectron spectroscopy (XPS),electron probe microanalysis (EPMA) and X-ray micro-computed tomography (μCT).The investigation of the Mg-Zn-Zr-Ca alloys is of great importance for the development of innovative low-cost corrosion resistant Mg alloys.
2.Experimental procedures
2.1. Materials preparation
The Ca-free base alloy ZK60 is denoted as ZK60 in this study and the Ca-containing alloy is denoted as ZK60-Ca.The as-cast ZK60 and ZK60-Ca alloys were prepared by casting with pure Mg (99.99 wt.%),Zn (99.99 wt.%),Ca(99.99 wt.%) and Mg-30Zr (wt.%) master alloys in the electric resistance furnace under protective Ar atmosphere in the graphite crucible,then cast into a straight mold at 750 °C.Billetes 90 mm in diameter and 100 mm in height were obtained.Chemical composition of the as-cast alloys was analyzed by Inductively Coupled Plasma-Optical Emission Spectroscopy measurements (ICP-OES),see Table 1.The as-cast alloys were embedded in MgO powder,and solutionized at 340 °C for 10 h,and then heated to 400 °C for 8 h at the heating rate of 1 °C min-1,followed by quenching in hot water (80 °C),and subsequently aged at 150 °C for a series of time ranging from 0 to 410 h.The maximum error of all the temperature measurements in the experiments was±1 °C.

Table 1Actual chemical compositions (wt.%) of the two alloys obtained by ICP-OES.
2.2. Mechanical properties tests
The uniaxial tensile tests were carried out on an Instron 5969 tensile testing machine equipped with a video extensometer at a constant strain rate of 1 × 10⁻³s-1at room temperature.The tensile strain was real-time monitored during the tensile test.At least three specimens were used,and consistent tensile properties were obtained.The size of tensile specimens was 17 mm × 3.5 mm × 2 mm.The Vickers’hardness of specimens was measured via applying 1 kg force for 15 s.
2.3. Microstructure and surface analysis
For metallographic observation,the specimens were grounded with SiC abrasive papers from 400-to 3000-grit,and then mechanically polished using 0.5 μm diamond paste.The polished samples were etched in corrosive liquid for 20 s to identify the grain boundaries and distribution of intermetallic phases (IMPs) observed using Scanning Electron Microscope (SEM,FEI VERISO60) with energy dispersive X-ray spectroscope (EDS).The area fraction of the micron-scale IMPs particles was obtained by using a grid counting method.The SEM images at a magnification of 500 times containing 900 points in the Photoshop software were used.The area fraction of the particles was the number of grids taken up by the particles divided by the number of all the girds.Ten random views of each sample were examined and the average value was used for the calculations.More than 500 random particles were measured to obtain accurate size of the particles.Since morphologies of the particles were irregular,a particle diameter,d,was defined asd=,whereζwas the number of the particles,dsanddlwere the smallest and largest dimensions of a particle,respectively.The grain size was calculated according to the linear intercept method in ASTM E112–12 using at least five visual fields.In addition,the local crystallographic orientation was characterized by the electron backscatter diffraction (EBSD,GeminiSEM 500).
The microstructure of Mg-Zn based alloys was investigated by the TEM (JEM-2100 F and JEM-F200) with focus on the identification of nanoscale precipitates.Twin-jet electropolishing using a solution containing 92 vol.% alcohol and 8 vol.%perchloric acid at-30°C was carried out to prepare the TEM foils.The number density of the precipitates was measured by using TEM images at a magnification of 8000 times.The morphology of the precipitates was approximately circle along the direction of <0001>αzone axis.The number density of the precipitates was the ratio of precipitate number to area.In order to obtain the accurate number density of the precipitates,at least five random TEM images were measured per sample.
2.4. Immersion test
For immersion tests,40 mm × 20 mm × 4 mm specimens were prepared and put in 3.5 wt.% NaCl aqueous solution for a series of time at 25 °C.The ratio of surface area of specimens to the corrosive solution volume was kept 50 mL cm-2.The pre-weighted specimens were soaked in the saline solution and taken out after immersion for 24 h.Afterwards,the corrosion products on the samples were obliterated by immersion in the chromate acid of 100 g CrO3,5 g AgNO3and 500 mL deionized water,followed by ultrasonic cleaning of the samples and mass loss measurement.The surface morphologies of the specimens after exposure to the solution with and without corrosion products were observed with the SEM.The chemical composition of the corrosion products formed on the specimens after immersion for 24 h was analyzed by the XPS (Thermo Fisher ESCALAB Xi+) with Mg Kαradiation.The cross-section morphologies of the corroded samples were collected by the EPMA (JXA-8230,JEOL) and the variations of element contents in this region were measured.
The hydrogen evolution test was conducted following the method proposed by Yin et al.[37].During 24 h of immersion,the volumes of evolved hydrogen were recorded every 2 h.To achieve reliable values,the immersion tests were carried out on three different samples.The overall corrosion rate(CR1)was calculated from weight loss,which was represented in mm/year according to ASTM standard G1–03 [34].For the hydrogen evolution test,the total weight loss was determined by the conversion relation (1 mL H2gas=0.001083 g consumed Mg).TheCR1could be expressed by the formula[37]:
whereΔmreferred to the weight loss (g),the value of which could be obtained by the weight loss test and the collected hydrogen,respectively.Aandtwere exposed specimen area in the solution(cm2)and the total immersion time(h),respectively.ρwas the alloy density (g/cm3),which was measured via the Archimedes method at ambient temperature.
2.5. Electrochemical characterization
For electrochemical test,the specimens with size of 10 mm × 10 mm × 6 mm were connected to a copper wire,and then covered with epoxy resin with an exposed working area of 1 cm2.The electrochemical tests were carried out using a jacketed three-electrode cell,which was connected to a temperature-controlled circulator.The specimen acted as the working electrode,and an Ag/AgCl electrode and a platinum foil were used as the reference and counter electrodes,respectively.The measurements were conducted in 125 mL of 3.5 wt.% NaCl solution (comprised of deionized water and analytical grade sodium chloride) at 25±1 °C using a potentiostat (VersaSTAT4,Princeton Applied Research).
Potentiodynamic polarization tests were performed in 3.5 wt.% NaCl solutions and measured from open circuit potential (OCP) to-300 mV vs.OCP as well as from OCP to 300 mV vs.OCP at a scan rate of 1 mV/s after the initial retard of 300 s,separately.In this manuscript,all potentials were displayed with respect to the Ag/AgCl reference electrode if not specified.
Electrochemical impedance spectroscopy(EIS)tests at free corrosion potential were conducted in the frequency range of 100 kHz–0.01 Hz with a perturbation amplitude of 5 mV.The specimens were immersed in 3.5 wt.% NaCl solution for 600 s at OCP prior to the EIS measurements to attain stable OCP values.The electrochemical measurements mentioned above were repeatedly carried out at least three times to validate the obtained results.
3.Results
3.1. Mechanical properties of ZK60 and ZK60-Ca Mg alloys
Mechanical properties of the ZK60 and ZK60-Ca alloys including both hardness and tensile properties have been tested for the determination of peak-and over-aged state.Hardness of ZK60 and ZK60-Ca Mg alloys as a function of isothermal aging time at 150 °C is presented in Fig.1a.In the solutionized state,hardness of the Ca-containing alloy is slightly higher than that of the ZK60 alloy,probably for the solidsolution strengthening effect caused by Ca addition.The hardness is remarkably improved for both alloys in the peak-aged state.The maximum hardness reaches~76 HV at the aging time of 72 h for the ZK60 alloy,which is 3 HV lower than that of the ZK60-Ca alloy.As the aging time further increases,the hardness decreases gradually.The hardness of the over-aged ZK60-Ca specimen is 2 HV higher than that of ZK60 specimen after 410 h aging treatment.
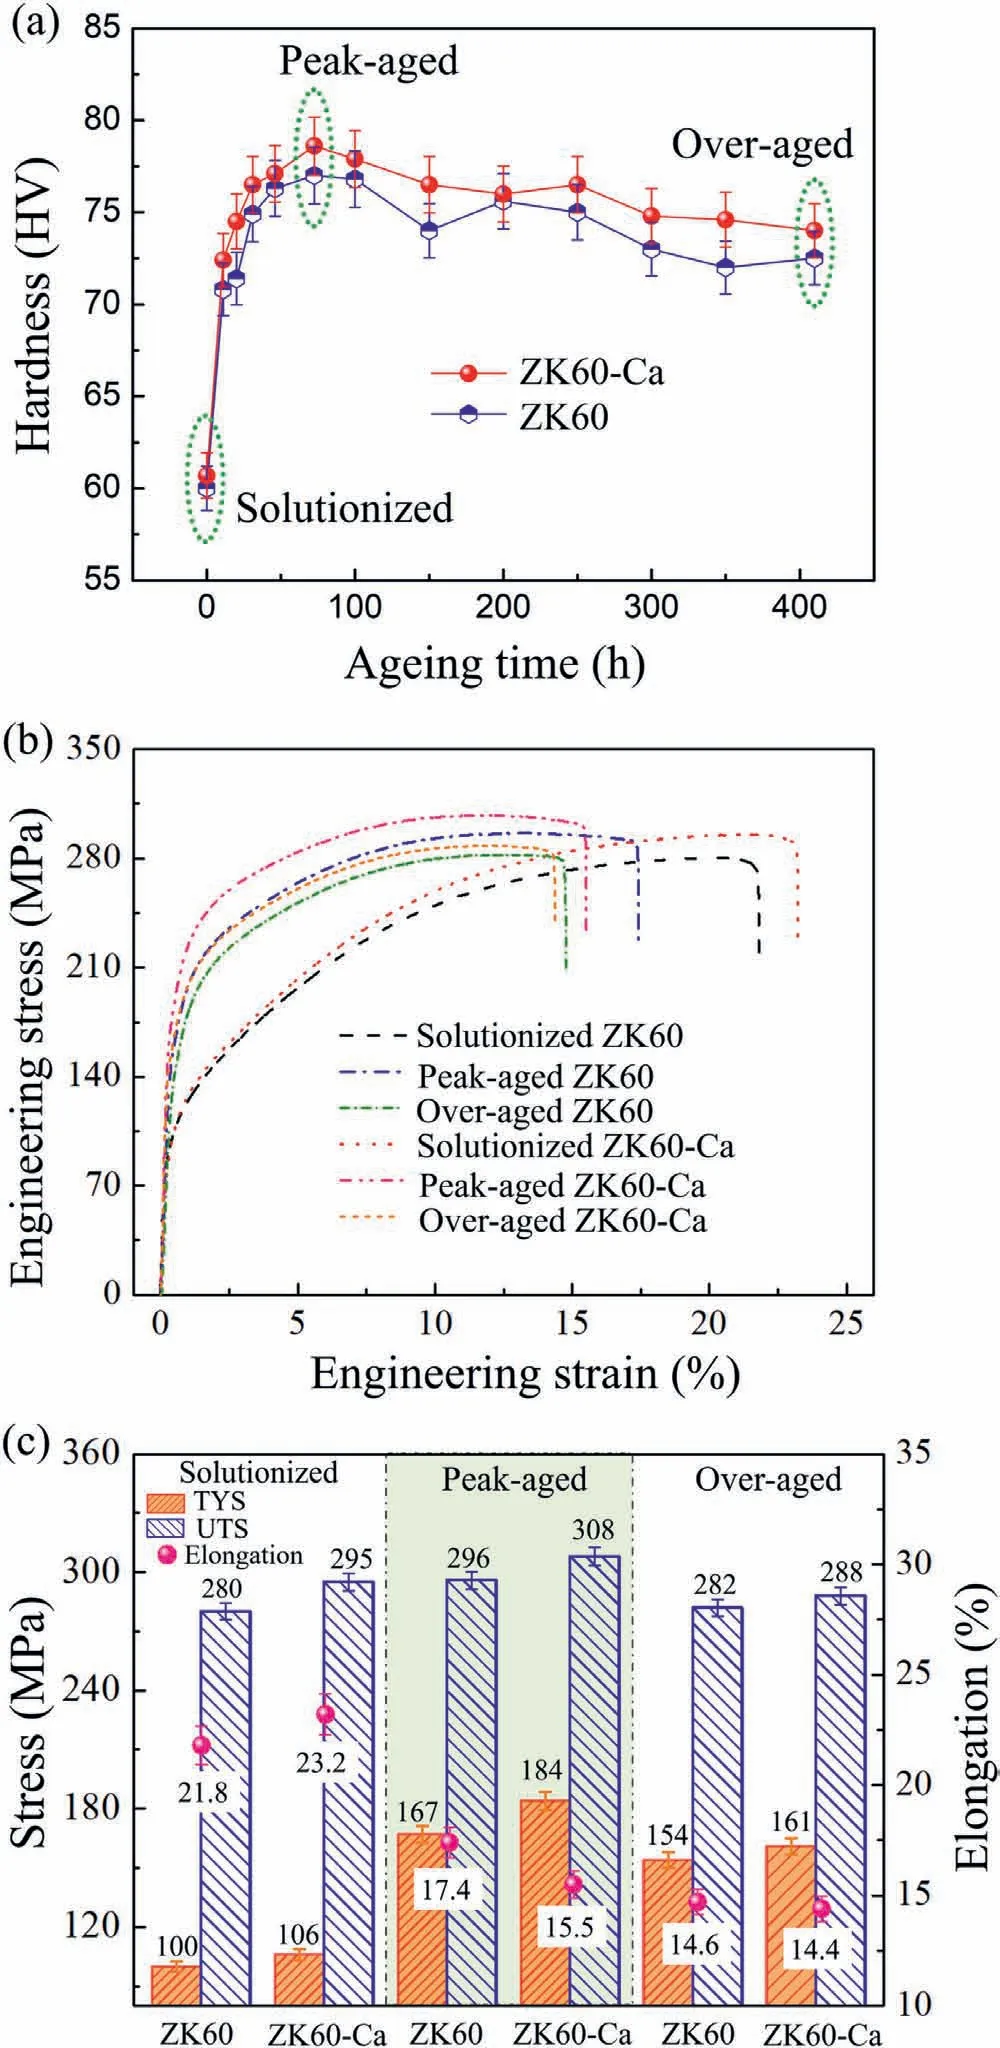
Fig.1.(a) Hardness of ZK60 and ZK60-Ca alloys aged isothermally at 150 °C,(b) typical uniaxial tensile engineering stress-strain curves,and (c)the tensile properties of the ZK60 and ZK60-Ca alloys under the different heat treatment conditions.
The tensile tests of the ZK60 and ZK60-Ca alloys in the solutionized,peak-aged and over-aged state have been conducted.The typical uniaxial tensile engineering stressstrain curves are shown in Fig.1b.The corresponding mechanical properties of the two alloys under the different heat treatment conditions are summarized in Fig.1c.In the soultionized state,the ZK60 alloy has tensile yield strength(TYS)of 100 MPa,ultimate tensile strength (UTS) of 280 MPa and elongation of 21.8%.In comparison,the soultionized ZK60-Ca alloy achieves higher TYS (106 MPa),UTS (295 MPa)and elongation (23.2%).In the peak-aged state,the strength of the alloys is significantly improved.The TYS and UTS of the peak-aged ZK60 and ZK60-Ca alloys are higher than that of the solutionized ZK60 and ZK60-Ca alloys,but the elongation is lower.The TYS and UTS of the peak-aged ZK60-Ca alloy is 184 MPa and 308 MPa,respectively,which are 17 MPa and 12 MPa higher than those of the peak-aged ZK60 counterpart.However,the elongation (15.5%) of the ZK60-Ca alloy is smaller than that of the ZK60 alloy (17.4%).In the over-aged state,the TYS,UTS and elongation decrease compared with the values in the peak-aged state.The TYS and UTS of the over-aged ZK60-Ca alloy are higher than those of the over-aged ZK60 alloy,but the elongation is a little smaller.The above results indicate that the mechanical behavior depends on the aging time and microalloying Ca addition,which has a large impact on the microstructure.Here we characterized the microstructures of the two alloys in details.
3.2. Microstructure of ZK60 and ZK60-Ca Mg alloys
EBSD mapping is employed to characterize the grain size and texture.Fig.2a and e show EBSD inverse pole figure(IPF) maps of the solutionized ZK60 and ZK60-Ca alloys,respectively.Both alloys are composed of equiaxed grains,and have weak texture.The grain sizes are~84 μm and~73 μm in the ZK60 and ZK60-Ca alloys,respectively,see the statistical results in Fig.2b and f.The grain size of the ZK60-Ca alloy is smaller,mainly for the grain refinement effect caused by Ca addition [34].A few micron-scale IMPs are found near the grain boundaries,as indicated by the yellow arrows in Fig.2c and g.Fig.2d and h show statistical results of the particle sizes.The average diameter of particles in the ZK60 alloy is~1.14 μm,smaller than that in the ZK60-Ca alloy(~1.26 μm).The chemical compositions of the micronscale IMPs particles in both ZK60 and ZK60-Ca alloys are shown in Fig.S1.The particle area fractions are~0.66%and~0.64% in the ZK60 and ZK60-Ca alloys,respectively.The size and area fraction of the micron-scale IMPs in both alloys are similar.
Morphologies of the precipitates in both alloys have been further explored by using TEM experiments along the directions of <20>αand <0001>αzone axis.Fig.3 shows the precipitates morphologies and their sizes of peak-aged ZK60 and ZK60-Ca alloys (aged for 72 h).The rod-shapedprecipitates growing along the c-axis are mainly observed in the two alloys,as well as a few plate-shapedprecipitates with the basal habit plane,see Fig.3a and e.Morphologies of the precipitates change little with the Ca addition.The lengths of theprecipitates in the peak-aged ZK60 and ZK60-Ca alloys are 360.4 nm and 130.1 nm,respectively,see Fig.3b and f.It is credible because all the micrographs are taken with the electron beam parallel to the <20>αdirection.Theprecipitates in the ZK60 alloy have the diameters (d1)of 13.1 nm,and 6.8 nm in the ZK60-Ca alloys,see Fig.3d and h.The length and diameter of theprecipitates are smaller in the Ca-containing alloy,while their number density is considerably larger (1912 per square micrometer),about 5.4 times higher than that in the ZK60 alloy (356 per square micrometer).The addition of microalloying Ca can be responsible for the number density difference.Ma et al.[32]have found that the formation energies of Zn G.P.zones with Ca are much lower than that of pure Zn G.P.zones.It indicates Ca contributes to enhance the stability of G.P.zones.This is consistent with the experimental observation that Ca promotes increase of the precipitation density of G.P.zones efficiently in Mg-Zn system alloys.Mendis et al.[21]have found that the co-segregation of Ca and Zn may create the nucleation sites for the rod-shaped MgZn2precipitates.The Ca addition results in significant refinement of MgZn2precipitate and an increase in its number density in the Mg-Zn system alloy.In summary,Ca addition contributes to form clusters in the pre-precipitation stage,co-segregating with Zn,which could provide nucleation sites for formation of theprecipitates.From this,theprecipitates in the present ZK60-Ca alloy is considered to be MgZn2phase with a small amount of Ca dissolving inside.
With increasing aging time at 150 °C,precipitates can be mainly observed inside the grain.Fig.4 presents TEM images of over-aged ZK60 and ZK60-Ca samples (aging for 410 h at 150 °C),recorded parallel to the <20>αand<0001>αzone axis.The rod-shapedprecipitates growing along the c-axis,and a few plate-shapedprecipitates are mainly observed in Fig.4a and e.The precipitate morphology changes little compared that in the peak-aged samples.The lengths (l1andl2) ofprecipitates in the ZK60 and ZK60-Ca alloys become 465.4 nm and 157.8 nm,respectively,as displayed in Fig.4b and f.Especially,in the over-aged state,the length ofprecipitates in the ZK60 alloy is around three times larger than that in the ZK60-Ca alloy,while the diameter is quite similar (13.7 nm and 12.1 nm in the two alloys,respectively).The number density of the rod-shaped precipitates in the ZK60-Ca alloy (809 per square micrometer)is about 2.3 times higher than that in the ZK60 alloy(349 per square micrometer).The differences in the size and number density of precipitates are supposed to have nonnegligible impact on the corrosion behavior.Next,we will analyze and discuss the corrosion behavior of both alloys under different heat treatment states.

Fig.4.TEM images of the over-aged (a and c) ZK60 and (e and g) ZK60-Ca alloys,showing rod-shaped precipitates viewed in the directions of <20>α and <0001>α zone axis.Nanoscale precipitate size distribution histogram of the (b and d) ZK60 and (f and h) ZK60-Ca alloys.
3.3. Immersion test
Fig.5 illustrates the effects of heat treatments and microalloying Ca on the hydrogen release and mean corrosion rates of the alloys in 3.5 wt.% NaCl solutions over 24 h.The straight slope of the alloys represents hydrogen evolution rate during the exposure time.The higher slope demonstrates that the micro-galvanic corrosion is more intense,see Fig.5a.As can be seen in Fig.5b,the corrosion rates calculated from the hydrogen evolution tests are mildly lower than the corrosion rates obtained from weight loss measurements.The relatively higher weight loss rate is probably attributed to excessive removal of corrosion products unconsciously and an underestimation of the hydrogen evolution rate on account of accumulation of hydrogen bubbles at the walls of the funnel and the burette[38]or the replacement of hydrogen with nitrogen and oxygen in the solution [13,39].From Fig.5a,the peak-and over-aged ZK60 alloys exhibit the highest generated hydrogen volume during the 24 h immersion,while the solutionized alloys have the lowest hydrogen volume.The hydrogen gas results from cathodic hydrogen evolution reaction,and consequently the hydrogen evolution can be an indicator of the dissolution rate of Mg alloys [40].For this reason,dissolution rates of the six alloys can be ranked in an increasing sequence as solutionized ZK60 <solutionized ZK60-Ca <peak-aged ZK60-Ca <over-aged ZK60-Ca <over-aged ZK60 <peakaged ZK60.Direct corrosion rates attained from the weight loss tests coincide well with the above-mentioned ranking of dissolution rate determined by hydrogen evolution tests.The immersion test up to 240 h has been further conducted,see Fig.S2.Although the corrosion rate is relatively lower in comparison with the 24 h immersion test,probably due to better protection effects of much thicker corrosion product films formed in a longer time,the corrosion resistance ranking of these alloys agrees well with the 24 h immersion test,which is solutionized ZK60>solutionized ZK60-Ca>peakaged ZK60-Ca>over-aged ZK60-Ca>over-aged ZK60>peak-aged ZK60.To summarize,the variations in the size and number density of intragranular nanoscale precipitation phases arising from the microalloying Ca and heat treatments can lead to distinct changes in the corrosion rate.
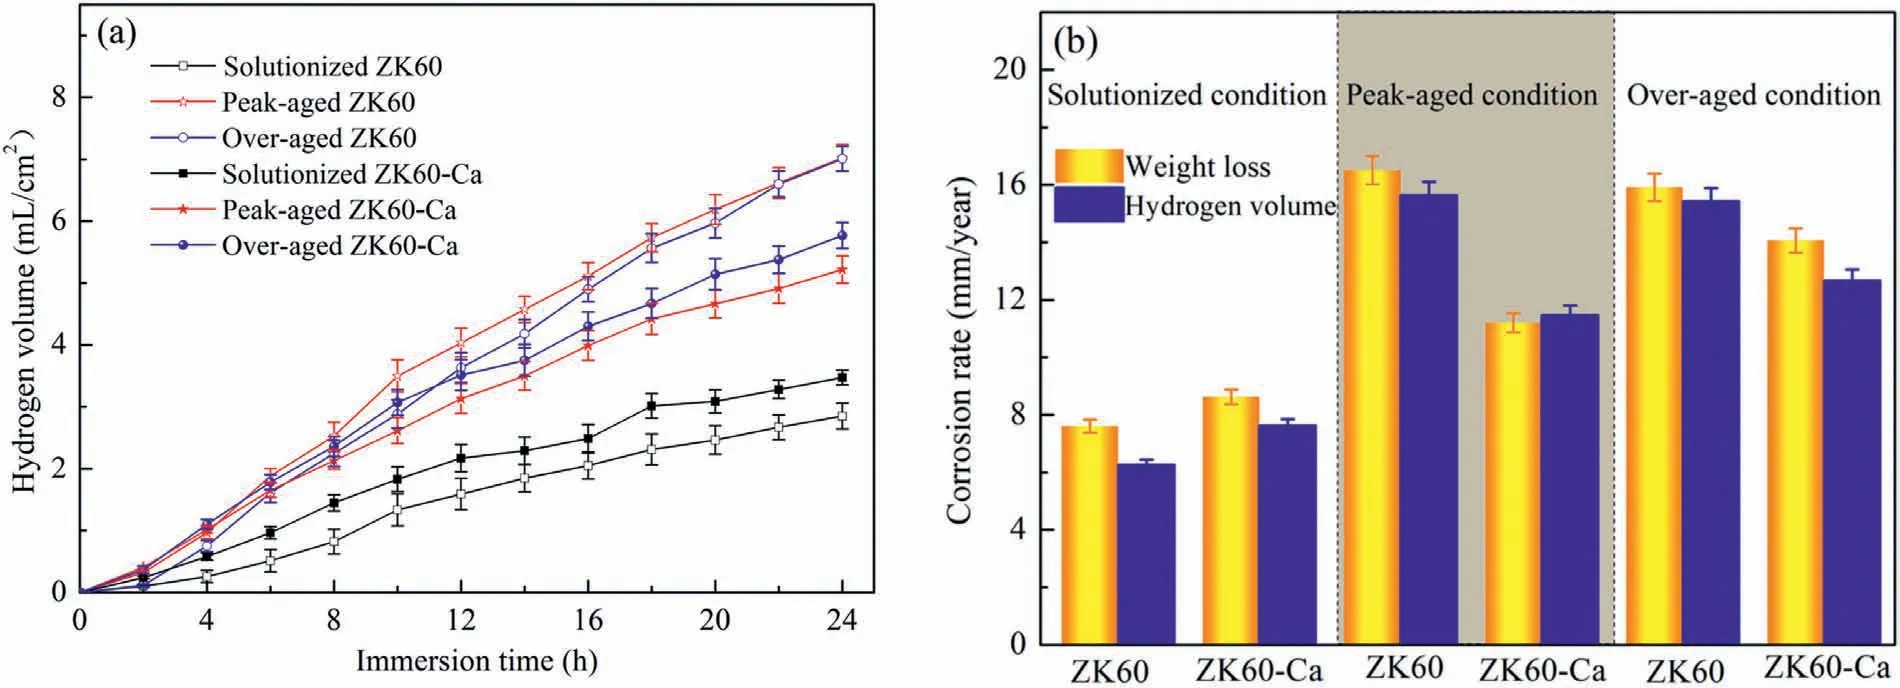
Fig.5.(a) Hydrogen evolution volume and (b) average corrosion rate calculated from the weight loss and hydrogen volume measurements after immersion in 3.5 wt.% NaCl solution for 24 h.
3.4. Electrochemical characterization
Fig.6a displays OCPs versus time transition curves of the ZK60 and ZK60-Ca alloys with various heat treatments obtained at 25±1 °C during immersion in the 3.5 wt.%NaCl solution.It is reported that the increase trend of OCPs manifests the initiation and propagation of corrosion,then OCP remains relatively stable implying that the reaction reaches equilibrium [41].In the initial immersion period,the OCPs of peak-and over-aged alloys increase sharply to peak values within a short time followed by reaching the relatively stable values.The incubation periods (the increasing region of OCP at the beginning of immersion) for the localized corrosion of the solutionized alloys are comparatively longer,indicating that a relatively stable and protective oxide film formed on the surface.The OCP difference between the aged and solutionized alloys is attributed to the nanoscale precipitates.Furthermore,the OCPs of the peak-and overaged ZK60-Ca alloys reach relatively stable values prior to the ZK60 alloys under the condition of the same heat treatments,indicating an instant establishment of equilibrium between the localized corrosion and deposition of corrosion products.This is probably due to the additional corrosion reaction caused by the microalloying Ca and the consequent refinement of intragranular precipitates.In addition,OCPs of the solutionized alloys fluctuate severely in comparison with the aged alloys,which suggests the fierce competition between the localized corrosion and the passivation [42].The stabilized OCP values of the alloys decrease in the order ofEpeak-agedZK60<Eover-agedZK60<Eover-agedZK60-Ca<Epeak-agedZK60-Ca<EsolutionizedZK60-Ca<EsolutionizedZK60,where the solutionized alloys exhibit the most positive values on account of the absence of nanoscale precipitates.The precipitates acting as cathodes promote the dissolution ofα-Mg.For the aged alloys,the value of OCPs depends on the number density and size of nanoscale precipitates.Nevertheless,it can be observed that the variations of OCPs among the alloys during the 24 h period are less than 15 mV,revealing that the heat treatments and microalloying exert little influence on the driving force of corrosion.
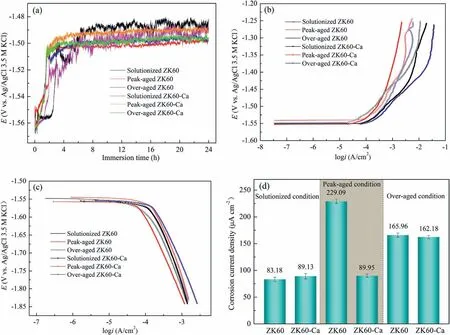
Fig.6.(a) OCPs of the alloys during immersion in 3.5 wt.% NaCl solution at 25±1 °C for 24 h.(b) and (c) show the anodic and cathodic polarization curves of the alloys after immersion for 300 s,respectively.(d) displays the calculated corrosion current densities.
Fig.6b and c depict the anodic and cathodic polarization curves of the alloys measured in 3.5 wt.% NaCl solution after 300 s stabilization.The anodic branches with no Tafel characteristic represent the dissolution of the alloys.In contrast,the cathodic branches with linear Tafel characteristic mainly reflect the hydrogen evolution.To compare the corrosion rate,the Tafel extrapolation of the cathodic branches is conducted and the calculated corrosion current densities are displayed in Fig.6d.The solutionized ZK60 alloys possess the lowest corrosion current densities for the absence of nanoscale precipitates.The current density of the solutionized ZK60-Ca alloy increases compared with solutionized ZK60,which is attributed to microalloying Ca generating the additional potential difference.However,for the peak-aged ZK60-Ca alloy,the Ca addition refines the nanoscale precipitates,as shown in Fig.3e_and g,and thus reduces the intensity of galvanic corrosion,which causes corrosion current densities 2.5 times lower than that of peak-aged ZK60 alloy.Why is there such a large difference of the current density in both peak-aged alloys? Obviously,the number density and size of nanoscale precipitates are responsible for the current density difference.The comparisons reveal that the precipitate number density of the peak-aged ZK60-Ca alloy is approximately 5.4 times higher,2.8 times lower in length,and 1.9 times lower in diameter than that of the peak-aged ZK60 alloy.Compared with the peak-aged ZK60 alloy,the precipitate coarsening growth of the over-aged ZK60 alloy and lower precipitate density lead to the decrease of current density.However,it is surprised that the precipitate coarsening growth and lower density for the over-aged ZK60-Ca alloy than that for peak-aged ZK60-Ca alloy lead to the increase of current density.Consequently,the corrosion current densities of alloys have great relations with the number density and size of the precipitates.These results are consistent with the hydrogen evolution test shown in Fig.5.
According to the Faraday’s Law,the electrochemical corrosion rate can be calculated based on the electrochemical corrosion via the following equation [43]:
whereCR2is the electrochemical corrosion rate(mm/year),Mis the molar mass of magnesium (24.3 g/mol),icorr,meanis the corrosion current density (A/cm2),uis the number of electrons transferred (u=2),Fis the Faraday’s constant (96,485 C/mol),ρis the density of the Mg alloy (g/cm3) andSequals 1 cm2.The calculated corrosion rate is shown in Table 2.The values are smaller than those by the weight loss measurements and volume of hydrogen gas (Fig.5b),probably because the corrosive chemical reactions cannot completely accord with the electrochemical process,some events such as electrochemical formation of Mg+ions,and partial disintegration of specimens into fine metallic particles may occur.The electrochemical estimates tend to underestimate the corrosion losses.This is similar with the reports of electrochemical estimation of the corrosion cate of pure Mg and AZ31 alloy[44].

Table 2Corrosion rates calculated based on the electrochemical corrosion.
Fig.7a shows the Nyquist diagrams and fitted solid lines of the alloys after stabilization for 600 s at 25±1 °C in 3.5 wt.% NaCl solution.Three loops can be found in the electrochemical impedance spectra (EIS): a high frequency capacitance loop,an intermediate frequency capacitance loop,and a low frequency inductance loop.According to the Pebere model [45],the presence of inductance loop is attributed to the relaxation of mass transport.The equivalent circuit in Fig.7b is fitted to further elaborate the corrosion mechanism quantitatively.TheRsandRctrepresent the solution resistance and charge transfer resistance,respectively.The CPEdlrepresents the double layer capacitance.TheRfand CPEfare the resistance of the corrosion film and the constant phase element of product film,respectively,which are employed to describe the second capacitance loop.The CPE component is defined by two parameters,nandY0.Thenis the dispersion index.TheY0represents the non-ideal capacitance,which is attributed to the dispersion effect caused by the surface oxide film,cracks,impurities and second phases [37].Besides,theRLandLare introduced to describe the low frequency inductance loop which refers to the resistance of Mg+reaction and the inductance of Mg+reaction on the damaged area of partially protective film.According to the fitting results summarized in Table 3,the peak-aged ZK60-Ca alloy presents the highestRfvalue among the aged alloys,indicating the lowest film rupture property.Rfvalues of the solutionized ZK60 and ZK60-Ca alloys are higher than that of the peak-aged ZK60-Ca alloy,while hardness of the peak-aged ZK60-Ca is higher.To make a comparison with the hydrogen evolution test quantitatively,the polarization resistance (Rp) which represents resistance to the corrosion process at the electrode surface is calculated.The higher theRp,the lower the corrosion rate of the alloy surface is,and a lowerRpvalue means that the alloy surface is corroding at a higher rate.Rpis proportional to the inverse of corrosion rate,and can be calculated as follows[13]:
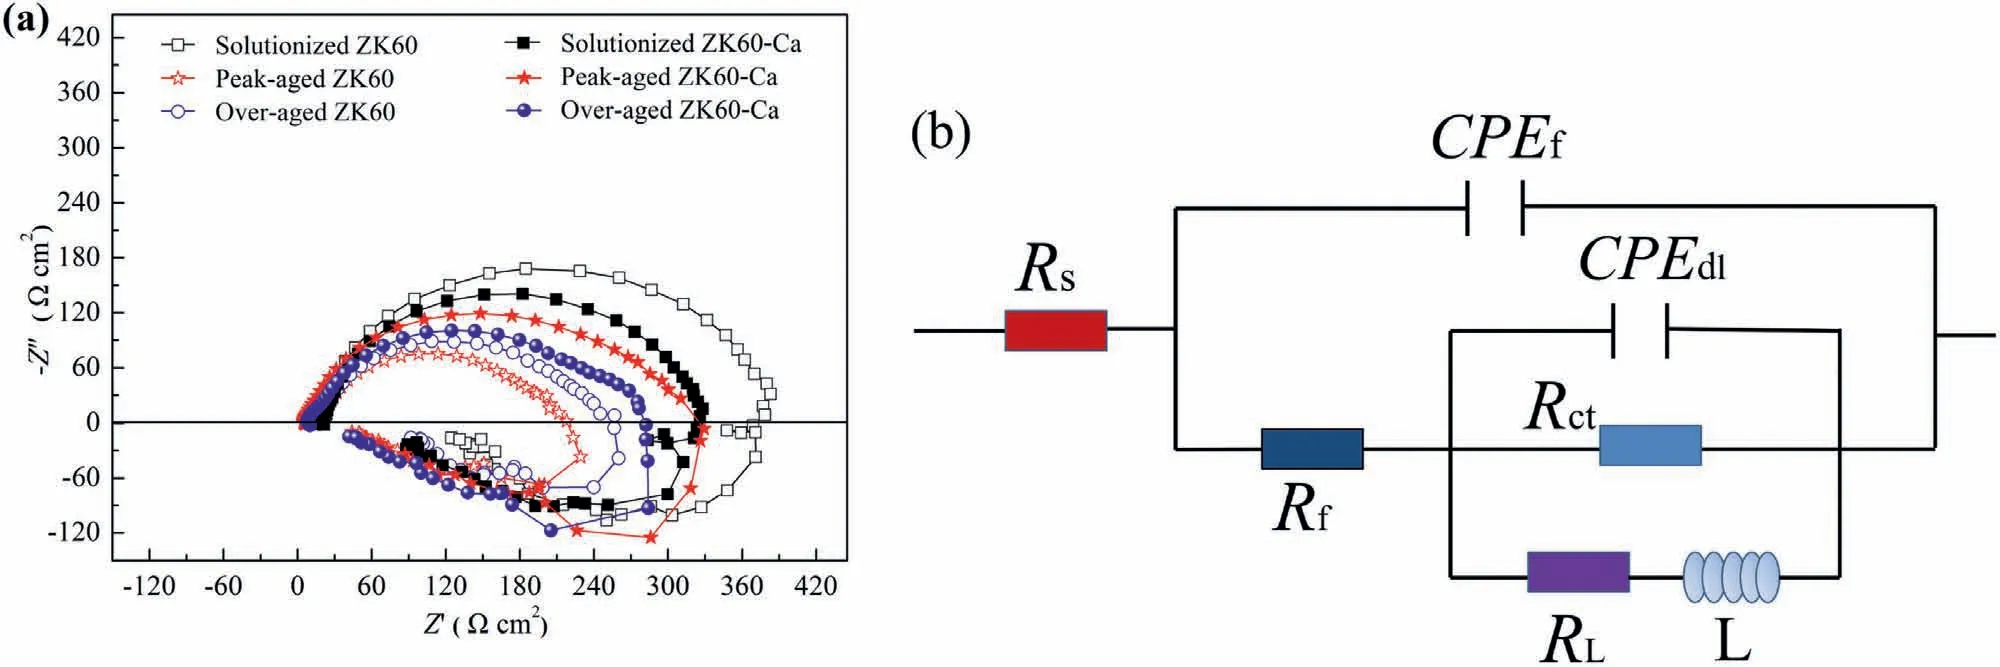
Fig.7.(a) Nyquist diagrams and fitted solid lines of the alloys after 600 s stabilization at 25±1 °C in 3.5 wt.% NaCl solution.(b) Equivalent circuit for EIS data.
The calculatedRpindicates that the dissolution rates of the alloys can be ranked as solutionized ZK60 <solutionized ZK60-Ca <peak-aged ZK60-Ca <over-aged ZK60-Ca<over-aged ZK60 <peak-aged ZK60.This is consistent with the ranking of dissolution rates obtained by the hydrogen evolution test.Corrosion rates of the alloys have close relation with the corrosion product film.Corrosion morphology analyses are carried out to understand the detailed corrosion mechanism.

3.5. Corrosion morphology
Fig.8 presents corrosion morphologies of the samples before and after removal of the corrosion products.In general,micro-cracks and some local detachments are distributed on the corrosion surface.The corrosion products of the solutionized alloys shown in Fig.8a1,a3,b1 and b3 are denser than those of the aged alloys shown in Fig.8c1-f1 and c3-f3,which possess some blocking characteristics.It can be inferred that the intragranular precipitates cause imperfection of the corrosion product film.Furthermore,the microalloying Ca has a significant influence on the morphology of the corrosion products.The peak-and over-aged ZK60-Ca alloys possess more compact corrosion product films than the aged ZK60 alloys,which is closely correlated with the size and number density of the precipitates.Fig.8a2-f2 and Fig.8a4-f4 present surface morphologies of the alloys after removal of corrosion products.To compare the corrosion depth,three-dimensional topography of the alloys is collected (see Fig.8a5-f5).The solutionized alloy surface exhibits a relatively uniform morphology with shallow and extensive gullies in Fig.8a1-a5.The microalloying Ca enhances the potential difference in the solutionized alloy,thus causing more intense localized corrosion identified by the deeper and wider corrosion holes (Fig.8b1-b5).However,the intragranular precipitates of the aged alloys are refined by microalloying Ca,reducing the intensity of galvanic corrosion.In consequence,the corrosion depth of the peakand over-aged alloys decreases with the addition of Ca.Corrosion intensity of the alloys is correlated with the size and number density of the precipitates.When the length of precipitates is less than 160 nm (peak and over-aged ZK60-Ca),the high-density precipitates of peak-aged ZK60-Ca endow the“in-situpinning effect” on the corrosion products.As such,a spider-web-like corrosion layer (see Fig.8d1 and d3) generates,the fine precipitates as nodes and the corrosion products as reticula,which has a retarding effect on localized corrosion.Accordingly,the corrosion morphology exhibits relatively shallow corrosion cavities (see Fig.8d2,d4 and d5).By contrast,corrosion products on the over-aged ZK60-Ca tend to spalling off for the absence of firm pinning effect,resulting from the relatively bulky and sparse characteristic of the precipitates,thus creating a less-protective corrosion product layer and increasing the corrosion depth (Fig.8f1-f5).When the length of precipitates is larger than 360 nm (peakand over-aged ZK60),the low-density precipitates come into being the weak pinning effect.The corrosion product layer is difficult to adhere to the surface for the big corrosion defects generated by the large precipitates and could not provide an effective barrier,leaving large cavities on the surface(Fig.8c1-c5) and (Fig.8e1-e5).The sectional corrosion morphologies and their corresponding electron probe microanalysis (EPMA) mapping (Fig.S3) have been conducted.Stratification phenomenon of the corrosion product films are observed.The detailed analyses can be found in the supplementary information.The observed two-layer structure may be another reason for the better corrosion resistance of the aged ZK60-Ca alloys than the aged ZK60 alloys.
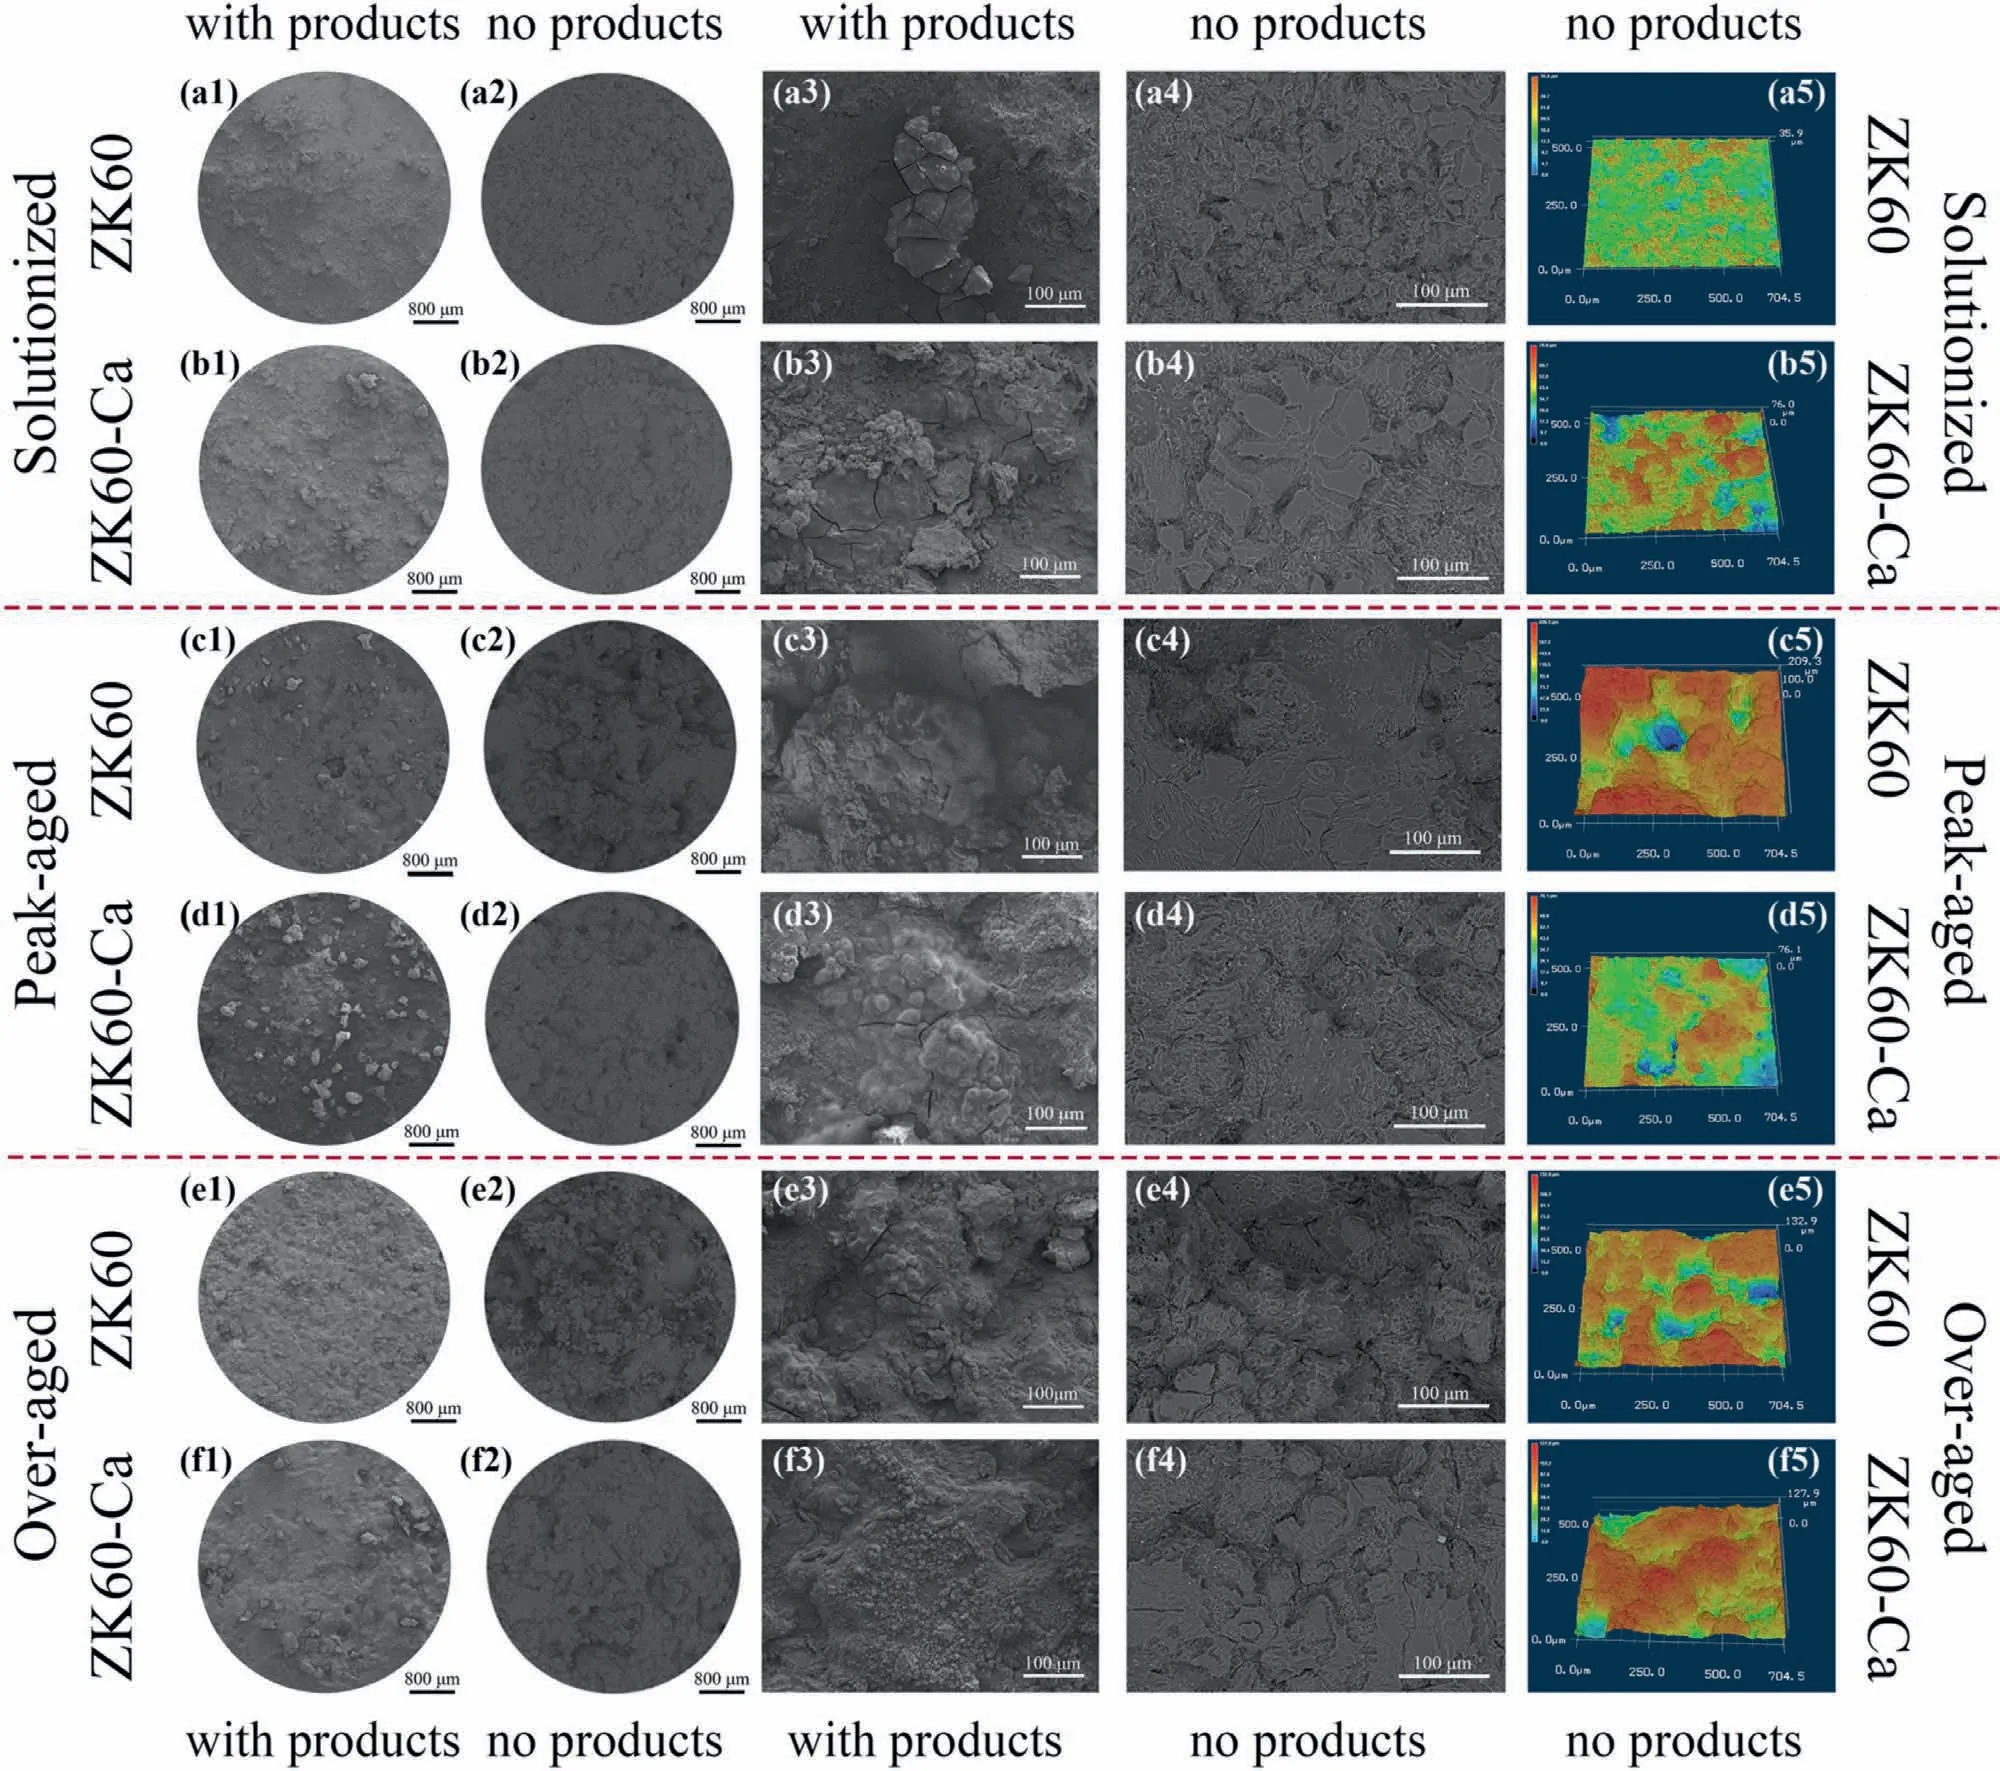
Fig.8.Corrosion morphologies of the alloys before and after removal of corrosion products at different magnifications.
The μCT is a method of non-destructive observation,which can access differences in localized corrosion rates and allow a more comprehensive analysis of the corrosion progress[46].The sample reconstruction by μCT provides the visualization of the sample from various directions,which determines the morphology and position of each characteristic position.Fig.9a shows the morphological variations of the samples with corrosion products after immersion for 24 h,and Fig.9b presents quantitative μCT analysis of the crosssectional area of corroded cavities (between the top and bottom surfaces).The sequencing of the area of corroded cavities is as follows: peak-aged ZK60>over-aged ZK60>over-aged ZK60-Ca>peak-aged ZK60-Ca>solutionized ZK60-Ca>solutionized ZK60,which is consistent with the results of weight loss.The effect of nanoscale precipitates on the corrosion is intensified due to the high reactivity of Mg.The solutionized samples without precipitates and peakaged ZK60-Ca with fine and dense precipitates present mild corrosion cavities.
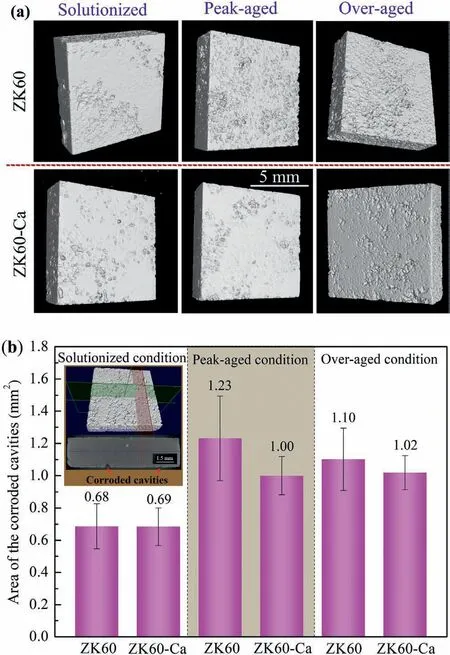
Fig.9.(a)3D reconstructions of the alloys after immersion in 3.5 wt.%NaCl solution for 24 h obtained by μCT.(b) Quantitative analysis of the corroded cavities in the cross-sectional area.
Fig.10a-f show cross-sectional corrosion morphologies of the samples after immersion in 3.5 wt.% NaCl solution for 24 h with removal of corrosion products.In general,the corrosion pits started off in a semi elliptical shape and the secondary pits nucleated at the bottom of the semi elliptical pit.Meanwhile,the pit coalescence occurred on the surface.To quantitatively compare the nucleation and coalescence,the depth (D1) and width (W) of the pits have been measured,see Fig.10g.TheD1maxis ranked as: peak-aged ZK60>over-aged ZK60-Ca>over-aged ZK60>solutionized ZK60-Ca>peak-aged ZK60-Ca>solutionized ZK60,while theWmaxis ranked as: peak-aged ZK60>over-aged ZK60> over-aged ZK60-Ca> solutionized ZK60-Ca> peakaged ZK60-Ca>solutionized ZK60.The peak-aged ZK60,over-aged ZK60 and ZK60-Ca show relatively larger pit nucleation and coalescence rate.This is consistent with the above-mentioned analysis that the peak-and over-aged ZK60 alloys with the length of intragranular precipitates larger than 360 nm and lower number density have the tendency of forming larger corrosion cavities.Accordingly,the weight loss of these alloys increases.Nevertheless,the solutionized ZK60 and ZK60-Ca as well as peak-aged ZK60-Ca present more uniform corrosion morphology (see Fig.10a,d and e)with the occasional pit nucleation and coalescence.This is attributed to the absence of precipitates in the solutionized ZK60 and ZK60-Ca alloys,while there are fine and dense precipitates in the peak-aged ZK60-Ca alloy which contribute to pinning the corrosion products layer.
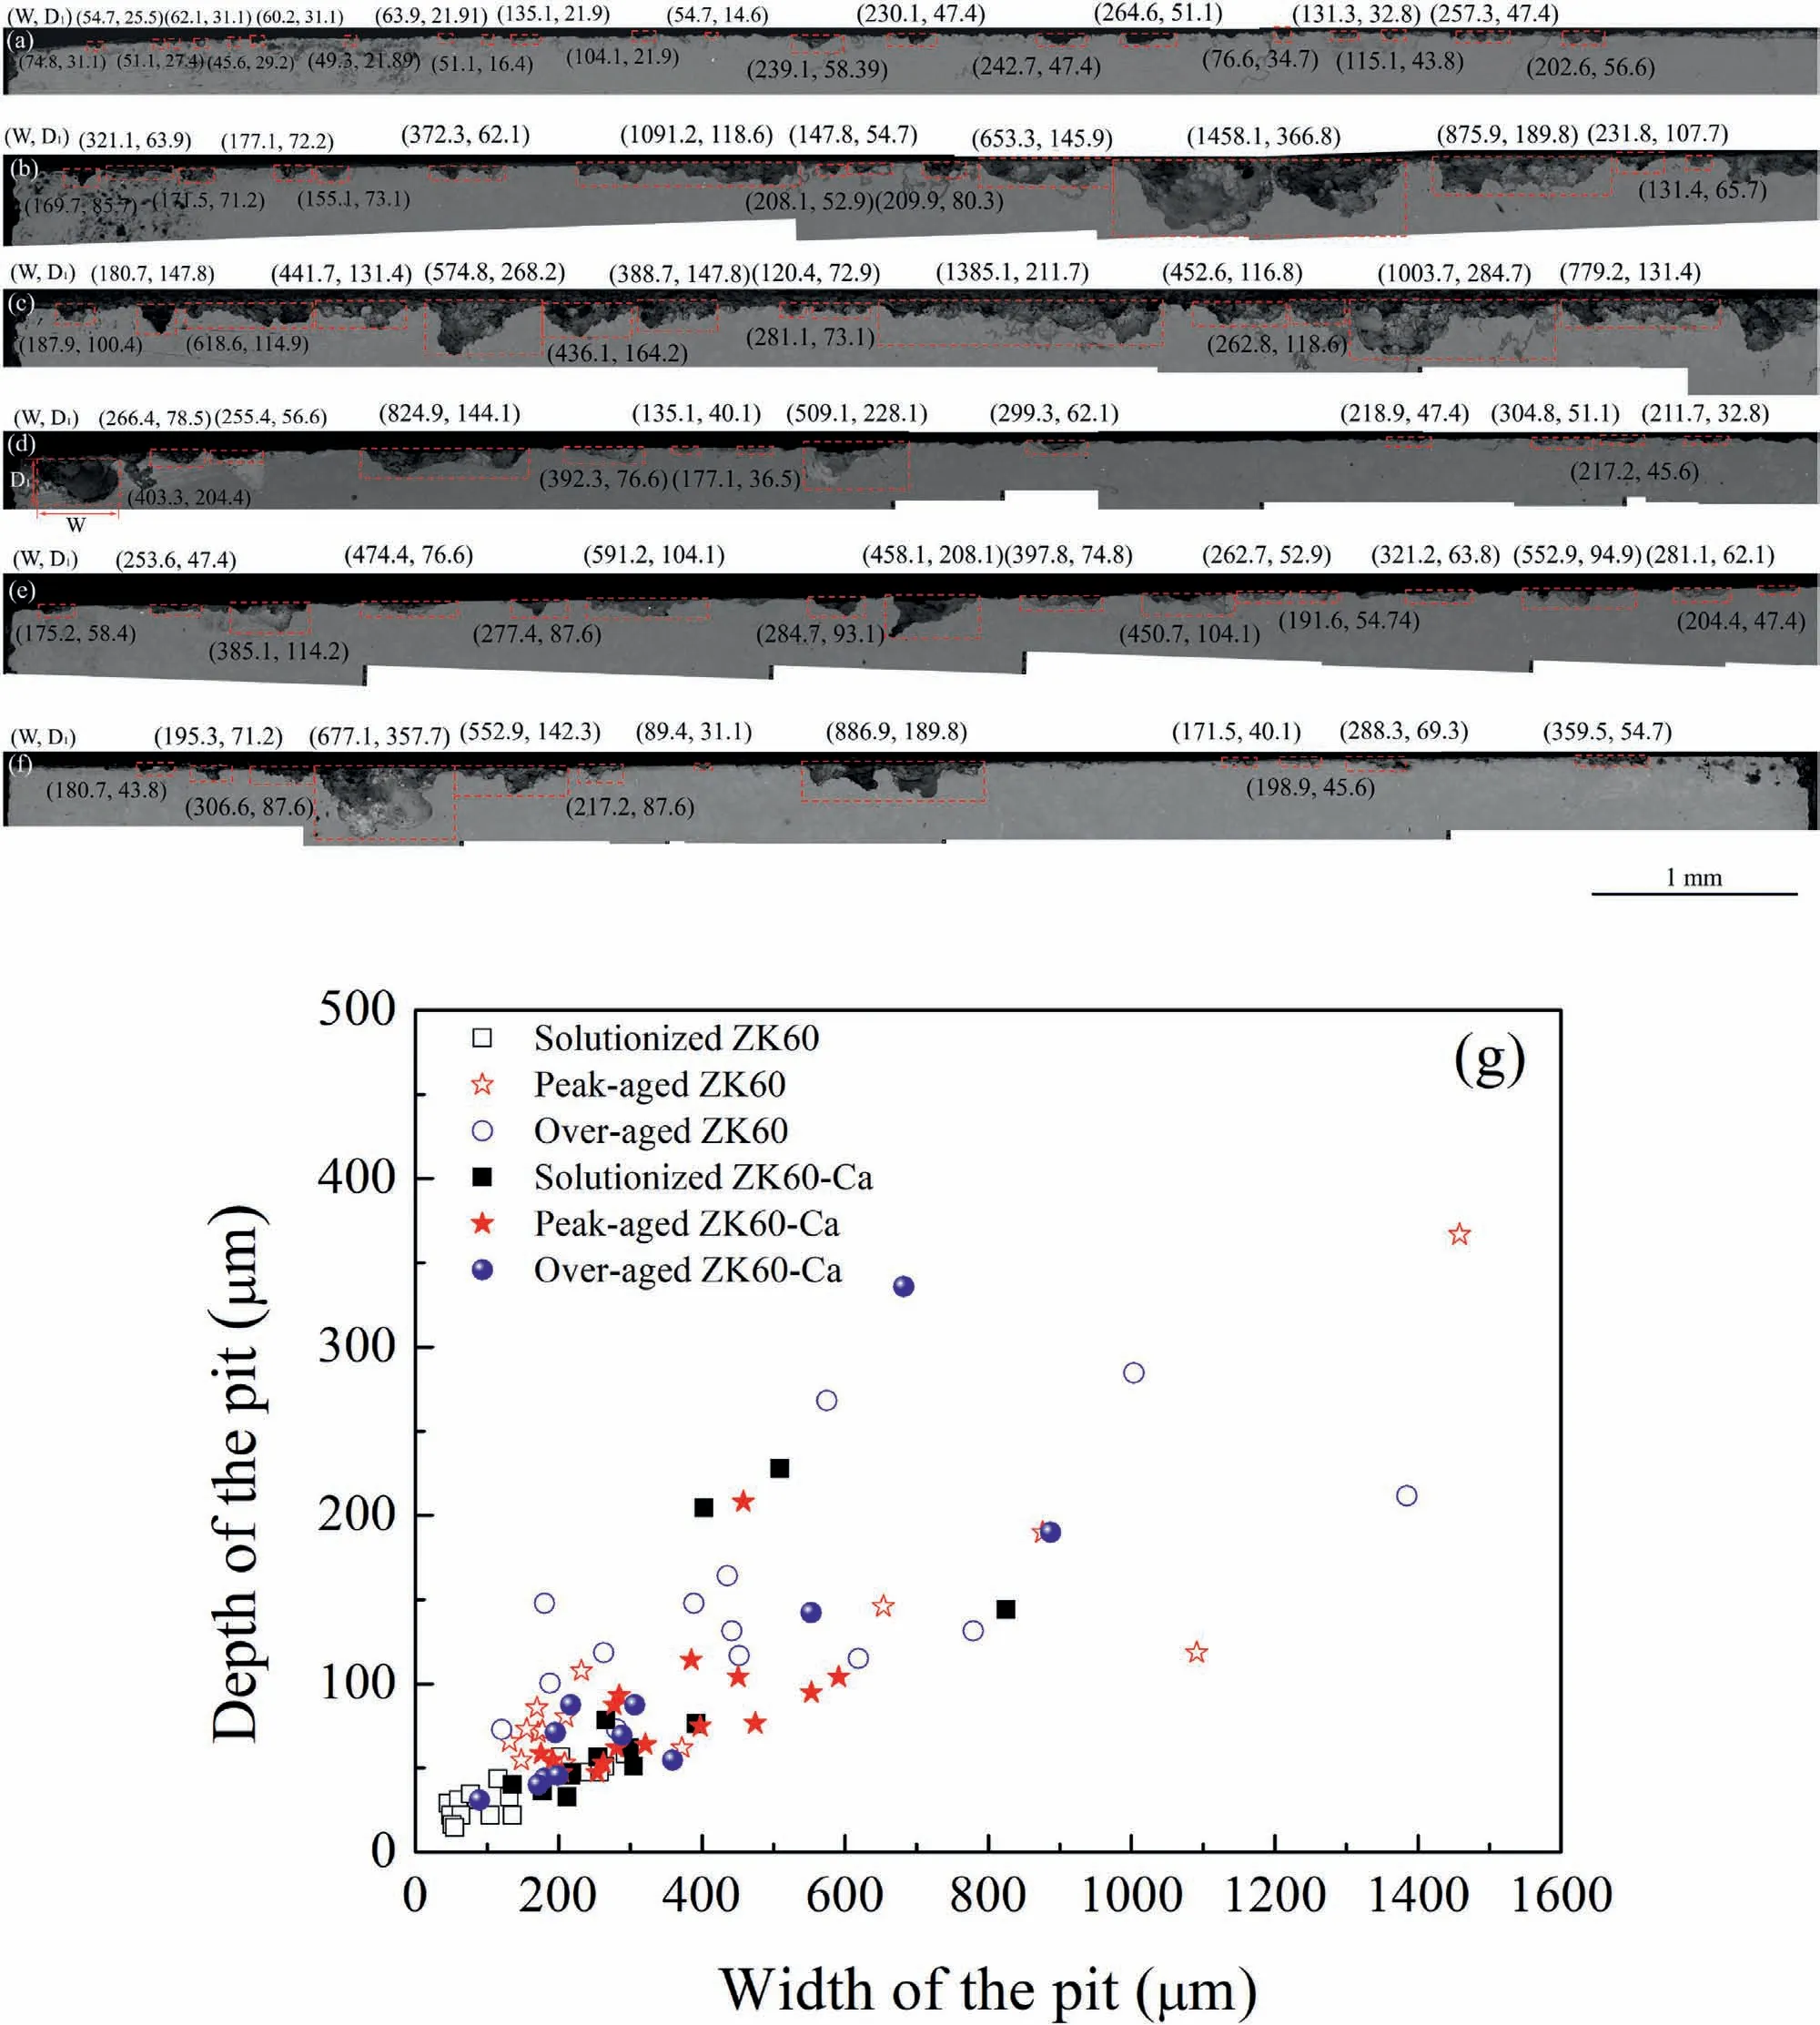
Fig.10.Cross-sectional corrosion morphologies of (a) solutionized ZK60,(b) peak-aged ZK60,(c) over-aged ZK60,(d) solutionized ZK60-Ca,(e) peak-aged ZK60-Ca,and (f) over-aged ZK60-Ca after immersion in 3.5 wt.% NaCl solution for 24 h with removal of corrosion products (W: width of the pit; D1: depth of the pit).(g) W vs. D1 statistical graph.
To further investigate the effect of microalloying Ca on the components of corrosion products,XPS test has been conducted on the surface of the alloys after immersion in 3.5 wt.% NaCl solution for 24 h.The XPS spectra of Zn,Ca,C,O,Cl,and Mg elements are shown in Fig.11,which are similar to the results reported in the Ref.[47].The corrosion products of the alloys without Ca are composed of Mg(OH)2,MgCO3,MgCl2,MgO and ZnO.However,CaCO3is detected on the surface of the Ca-containing alloys in addition to the above-mentioned constituents,which constitutes the Cacontaining layer in the cross-section of corroded ZK60-Ca alloys.As such,the components of the corrosion products of the alloys change with the microalloying Ca.
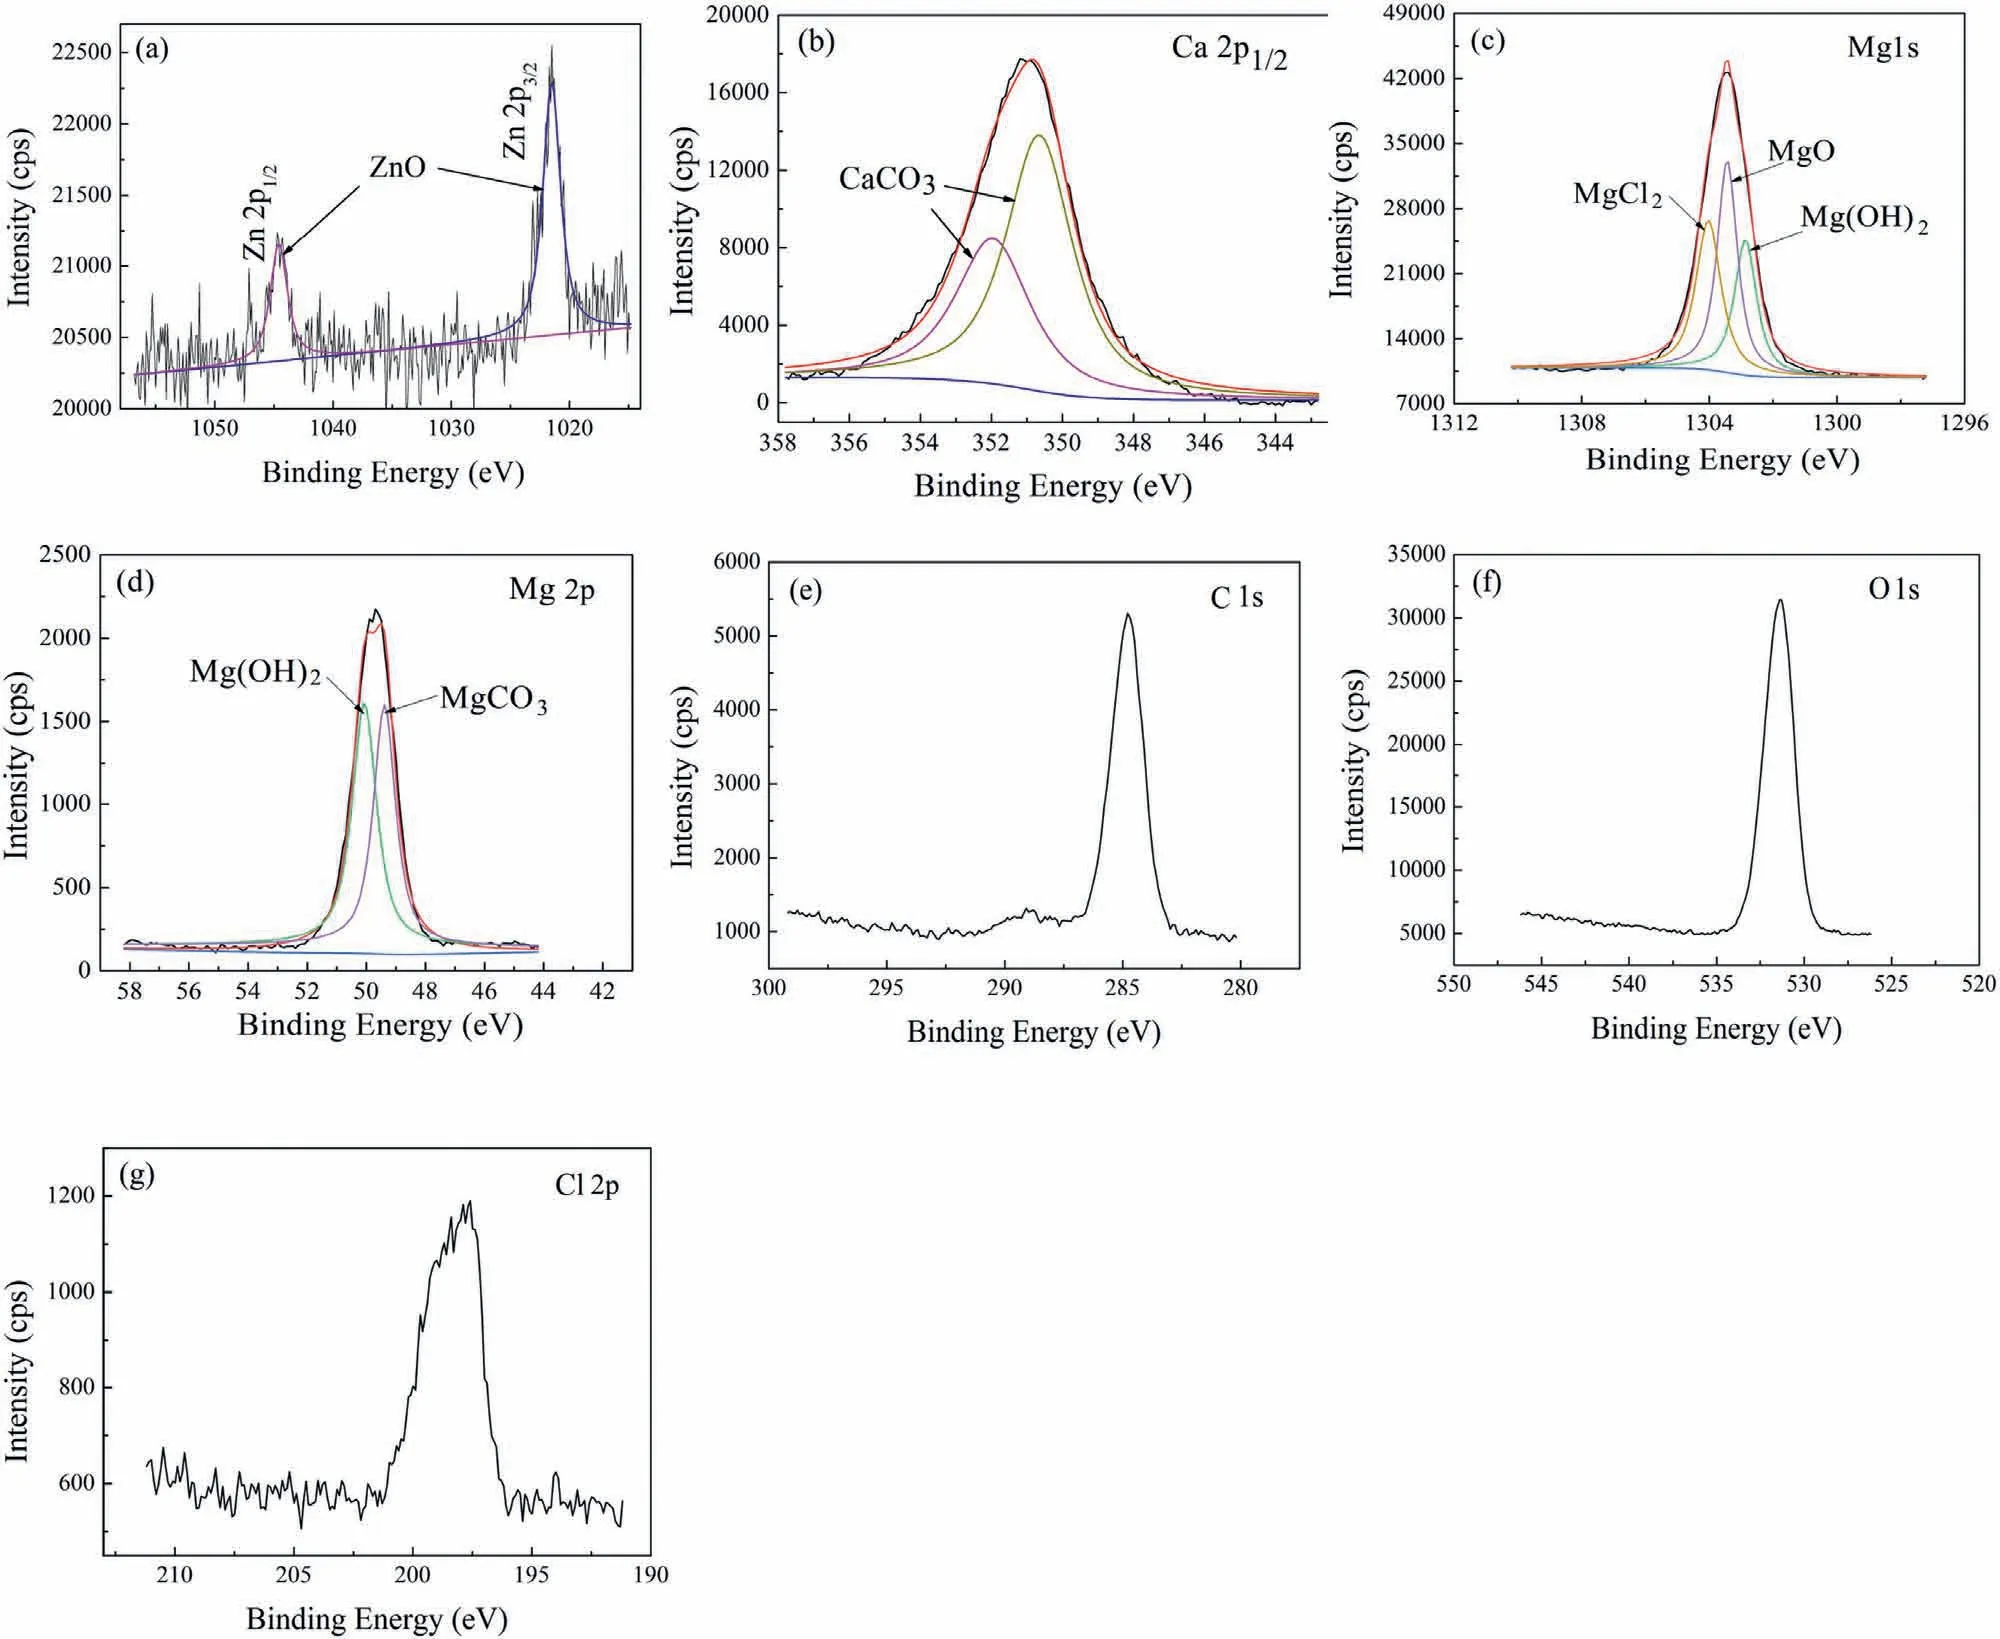
Fig.11.XPS analysis of the corrosion products formed on the solutionized ZK60-Ca alloys: (a) Zn 2p1/2 and 2p3/2 spectrum;(b) Ca 2p1/2 spectrum;(c) Mg 1s spectrum;(d) Mg 2p spectrum;(e) C 1s spectrum;(f) O 1s spectrum;(g) Cl 2p spectrum.
4.Discussion
4.1. Influence of precipitates on corrosion rate
It is generally accepted that the electrode potential difference between the precipitates andα-Mg matrix inevitably leads to micro-galvanic reaction.However,the comprehensive effect of micron-scale IMPs near the grain boundary and nanoscale precipitates inside the grains on the corrosion behavior has rarely been investigated.In this work,the size and number density of nanoscale precipitates are adjusted via heat treatments and microalloying Ca to fully compare their corrosion behavior and reveal the corrosion mechanism.
The cathodic current can be applied to determine the corrosion rate of Mg alloys [48].In this work,the corrosion process ofα-Mg electrode possesses a partially protective film mechanism on account of porous characteristic of corrosion products film on the surface.Considering this situation,an area fractionθ,where 0<θ <1,is defined to describe the unprotected area fraction of the alloy surface without corrosion products film.Then,the hydrogen evolution current (Ic)can be expressed as [48]
whereIc0,bc0,andEcerepresent the exchange current density,Tafel slope and equilibrium potential of the cathodic process on a bare sample surface,respectively.Icpandbcpare referred to as the exchange current density and Tafel slope on a sustained and protective products film,andEis the electrode potential.
As for a film-covered area,both the anodic and cathodic reactions are greatly inhibited compared with that on the bare metal surface [49].For this reason,bcpapproaches infinity andIcpapproaches zero.Then,Eq.(4) can be simplified as follows.
θis a function ofEaccording to the Ref.[48].In this work,another two parametersεandηare introduced to define the number density and size of the nanoscale precipitates,respectively.
Accordingly,the derivative ofIcwith respect to the time could be expressed as follows.
To simplify the model,Eis considered as a constant for the reason that the corrosion occurs at the free corrosion potential,resulting in dE/dt≈0.Consequently,Eqs.(6) and (7) can be simplified as follows.
Corrosion initiates nearby the micron-scale IMPs.The hydrogen evolution during the corrosion reaction can generate the stirring effect,decreasing the adhesiveness of the corrosion products.This stirring effect is almost equal because the area fraction and size of micron-scale IMPs in both ZK60 and ZK60-Ca alloys are very close.However,the stirring effect would become more intense as the decreasing number density and increasing size of the nanoscale precipitates.Therefore,the following equation could be obtained,
whereE0represents OCP of the alloys.
With continuous dissolution ofα-Mg,an increasing number density and size of the cathodic phase with the time is exposed during the corrosion process.Thus,
Combining Eqs.(8)–(13),it yields
Eqs.(14) and (15) explain that the corrosion rates of the alloys exhibit adverse change rules with the immersion time.The reason might be that in addition to the stirring effect caused by the galvanic corrosion,the nanoscale precipitates have an “in-situpinning” effect on the corrosion products.This pinning effect derives from the relatively mild galvanic corrosion and appropriate combination of size and number density of precipitates.Consequently,the corrosion products film presents a spider-web-like structure,enhancing the adhesiveness at the film/substrate interface.As mentioned above,the higher number density precipitate contributes to the “insitupinning” effect if the length of precipitates is less than 160 nm.When the length of precipitates is larger than 350 nm and the number density is lower,the pinning effect is weakened for the intense stirring effect caused by the more severe galvanic corrosion,decreasing the adhesiveness of corrosion products film.As for the solutionized alloys,stirring effect of micron-scale IMPs near the grain boundary plays a major role and the adhesiveness of corrosion products is greatly improved for a lack of galvanic corrosion caused by precipitates.In this case,the following relationship of the value ofθmight be obtained.
As shown in Fig.6c,cathodic reactions of the studied alloys present the similar behavior.Thus,the slopes of cathodic Tafel branches are approximately equal.Accordingly,
It can be seen in Fig.6a that the free corrosion potentials of the alloys present the following sequence.
The minor differences ofEcefor the alloys can be neglected,then,
The value ofIc0for the alloys might be ordered as follows due to the different number density and size of precipitates.
It can be obtained the following relationship via bringing Eqs.(16)–(20) into Eq.(4).
The deduction result in Eq.(21) obtained the relationship of corrosion rates ranking as peak-aged ZK60>over-aged ZK60>over-aged ZK60-Ca>peak-aged ZK60-Ca>solutionized ZK60-Ca>solutionized ZK60.
However,Eqs.(14),(15) and (21) should satisfy the following assumptions: (a) As the corrosion reaction progresses,enoughα-Mg/solution interface is provided to supply sufficient electrons for the increasing corrosion rate with the time.Otherwise,the corrosion rate would not increase even though the fine and dense precipitates facilitate the galvanic corrosion.As a result,an equilibrium between the dissolution ofα-Mg and the desorption of cathodic phases would be established and thereupon the corrosion rate would reach a relatively stable value.(b)The residual uncorroded cathodic phase should be not compacted.It is reported that the continuous IMPs would block the electrons transfer [50,51].
4.2. Roles of microalloying Ca and heat treatments in corrosion behavior of the alloys
The standard potentials of Mg,Zn and Ca are-2.36,-0.76 and-2.87 V,respectively [52].The comparable standard potential of Ca and Mg contributes to the alleviation of galvanic corrosion.Furthermore,Ca dissolves preferentially and generates a thick protective layer of complex carbonates of Mg and Ca,inhibiting the corrosion process.And the aged ZK60-Ca alloy have finer and denser precipitates than the aged ZK60 alloys.These precipitates generate “in-situpinning effect” on the corrosion products film.Accordingly,the aged ZK60-Ca alloys present superior corrosion resistance than the aged ZK60 alloys.Unlike the aged ZK60-Ca alloy,solutionized ZK60-Ca alloy has no galvanic corrosion between precipitates and Mg matrix.Thus,the solutionized ZK60-Ca alloy possesses superior corrosion resistance than the aged ZK60-Ca alloy.
Based on the above analysis,the corrosion schematic of the alloys is displayed in Fig.12.The solutionized alloys possess relatively uniform protective films for the lack of micro-galvanic couples between precipitates andα-Mg and thus corrode slightly.However,for the aged alloys,the precipitates generate “in-situpinning effect” on the corrosion products film,which is conducive to enhancing the adhesiveness of protective film.This pinning effect depends on the size and number density of the precipitates.In this work,when the length of precipitates is smaller than 160 nm (peakand over-aged ZK60-Ca alloys),the higher number density is favorable to the pinning effect,generating a sustained and protective film.Nevertheless,when the length of precipitates is larger than 350 nm (peak-and over-aged ZK60 alloys),the pinning effect depends not only on the size but also the intensity of galvanic corrosion caused by the precipitates.Furthermore,large corrosion cavities occur in the peak-and overaged ZK60 alloys for the severe galvanic corrosion and weak adhesiveness of corrosion products film.Thus,the areas with weak protective film would become new micro-anodes.By contrast,the films on the peak-and over-aged ZK60-Ca alloys inhibit the corrosion reaction for the pinning effect and mild stirring effect caused by galvanic couples of the precipitates and Mg,improving galvanic corrosion resistance.This result is also verified by the theoretical calculation,which provides important insight into the design and development of advanced corrosion resistant Mg alloys.
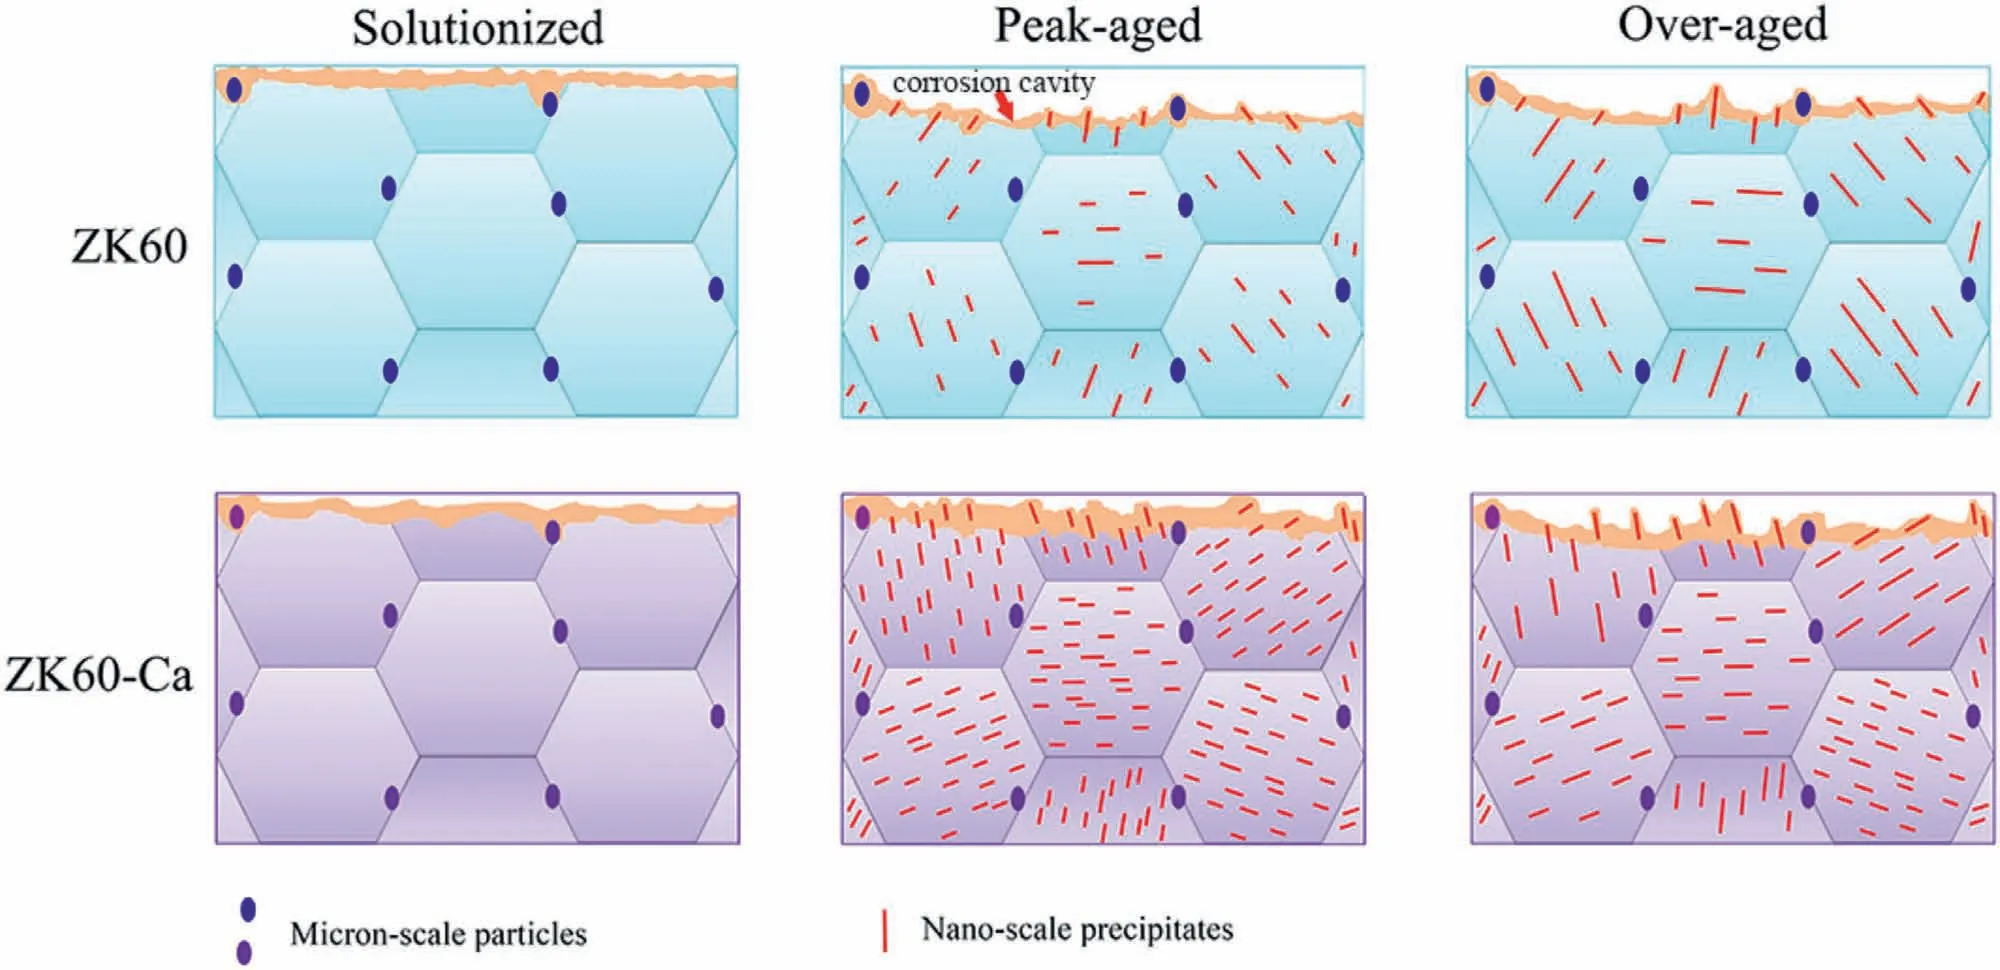
Fig.12.Schematic of the corrosion mechanism for the alloys.
5.Conclusions
The study has demonstrated that the microalloying Ca combined with heat treatments are conducive to obtain collaborative improvement of corrosion resistance and mechanical properties of ZK60 alloy.The main conclusions can be summarized as follows:
(1) Microalloying Ca significantly can refine the rod-shapedprecipitates and increase number density of the precipitates.Compared with the peak-aged ZK60 alloy,the peak-aged ZK60-Ca alloy is 2.7 times smaller in length of the precipitate,and 1.9 times smaller in diameter.Notably,the number density of precipitates in the peakaged ZK60-Ca alloy increases considerably,about 5.4 times higher than that in the peak-aged ZK60 alloy.The microalloying Ca addition is responsible for the differences in the size and number density of the precipitates;
(2) The corrosion rate of the solutionized ZK60-Ca is greater than that of the solutionized ZK60 due to more intense galvanic corrosion and weakness of the protective product film.Generally,the corrosion resistance of the solutionized alloys is greater than the aged alloys.However,the hardness,TYS of the solutionized alloys are significantly smaller than the aged alloys.The number density and size of the nanoscale precipitates are responsible for the corrosion rate and hardness difference;
(3) The peak-aged ZK60-Ca alloy has the highest hardness,TYS and UTS,as well as relatively good corrosion resistance among the alloys,which is promising for engineering applications.The reason is that the density of nanoscale precipitates for the peak-aged ZK60-Ca alloy is the highest among the aged alloys.The fine and dense precipitates contribute to the “in-situpinning” effect,which dominates the adhesiveness at the corrosion products film/substrate interface,and improves the corrosion inhibition ability;
(4) When the length of precipitates is less than 160 nm,the pinning effect is strengthened with increasing number density of the precipitates.Nevertheless,this effect is weakened for the intense galvanic corrosion due to lower number density of the precipitates and the higher length of the precipitates (350 nm).The competition between the pinning effect and stirring effect caused by the galvanic corrosion determines the integrity of corrosion products film,thus influencing the corrosion resistance.This is verified by experimental results and theoretical calculation,which provides important insight into enhancing the corrosion resistant Mg alloys.
Declaration of Competing Interest
The authors declare that they have no known competing financial interests or personal relationships that could have appeared to influence the work reported in this paper.
Acknowledgments
The authors gratefully acknowledge the support of the National Natural Science Foundation of China (Grant Nos.51901174,52005389),the China Postdoctoral Science Foundation (Nos.2020M673383,2020M673389),and the Fundamental Research Funds for the Central Universities(xzy012020001).
Supplementary materials
Supplementary material associated with this article can be found,in the online version,at doi:10.1016/j.jma.2022.06.011.
杂志排行
Journal of Magnesium and Alloys的其它文章
- Corrosion behavior of composite coatings containing hydroxyapatite particles on Mg alloys by plasma electrolytic oxidation: A review
- Rational design,synthesis and prospect of biodegradable magnesium alloy vascular stents
- Antibacterial mechanism with consequent cytotoxicity of different reinforcements in biodegradable magnesium and zinc alloys: A review
- Preparation,interfacial regulation and strengthening of Mg/Al bimetal fabricated by compound casting: A review
- Pitting corrosion behavior and corrosion protection performance of cold sprayed double layered noble barrier coating on magnesium-based alloy in chloride containing solutions
- Designing strategy for corrosion-resistant Mg alloys based on film-free and film-covered models
