In situ formed ultrafine metallic Ni from nickel (II) acetylacetonate precursor to realize an exceptional hydrogen storage performance of MgH2–Ni-EG nanocomposite
2023-12-27ShoyngShenLiuzhngOuyngJingwenLiuHuiWngXuShengYngMinZhu
Shoyng Shen ,Liuzhng Ouyng,b,* ,Jingwen Liu ,Hui Wng ,Xu-Sheng Yng ,Min Zhu
a School of Materials Science and Engineering and Key Laboratory of Advanced Energy Storage Materials of Guangdong Province, South China University of Technology, Guangzhou, 510641, China
b China-Australia Joint Laboratory for Energy &Environmental Materials, Key Laboratory of Fuel Cell Technology of Guangdong Province, Guangzhou,Guangzhou, 510641, China
c Advanced Manufacturing Technology Research Centre, Department of Industrial and Systems Engineering, The Hong Kong Polytechnic University, Hung Hom, Kowloon, Hong Kong, China
d Research Institute for Smart Energy, The Hong Kong Polytechnic University, Hung Hom, Kowloon, Hong Kong, China
Abstract It has been well known that doping nano-scale catalysts can significantly improve both the kinetics and reversible hydrogen storage capacity of MgH2.However,so far it is still a challenge to directly synthesize ultrafine catalysts (e.g.,<5 nm),mainly because of the complicated chemical reaction processes.Here,a facile one-step high-energy ball milling process is developed to in situ form ultrafine Ni nanoparticles from the nickel acetylacetonate precursor in the MgH2 matrix.With the combined action of ultrafine metallic Ni and expanded graphite (EG),the formed MgH2–Ni-EG nanocomposite with the optimized doping amounts of Ni and EG can still release 7.03 wt.% H2 within 8.5 min at 300 °C after 10 cycles.At a temperature close to room temperature (50 °C),it can also absorb 2.42 wt.% H2 within 1 h.It can be confirmed from the microstructural characterization analysis that the in situ formed ultrafine metallic Ni is transformed into Mg2Ni/Mg2NiH4 in the subsequent hydrogen absorption and desorption cycles.It is calculated that the dehydrogenation activation energy of the MgH2–Ni-EG nanocomposite is also reduced obviously in comparison with the pure MgH2.Our work provides a methodology to significantly improve the hydrogen storage performance of MgH2 by combining the in situ formed and uniformly dispersed ultrafine metallic catalyst from the precursor and EG.
Keywords: Hydrogen storage;Magnesium hydride;Nickel precursor;Size effect;Expanded graphite.
1.Introduction
With the reduction of industrial hydrogen production costs and the development of hydrogen fuel cell technology,hydrogen has gradually become one of the most promising clean energy in the 21st century [1].Noticeably,hydrogen storage is a crucial link in rolling out infrastructure construction to build a “hydrogen economy,” especially in terms of the extensive applications in hydrogen compressor,fuel cell vehicle(FCV),as well as grid-scale hydrogen energy storage [2–5].More specifically,it is still urging to develop hydrogen storage technologies with the characteristics of high gravimetric capacity,low cost,high safety,and reliability.Compared with the high-pressure gaseous and low-temperature liquid storage technologies,the solid-state hydrogen storage technology is highly promising,due to its relatively higher gravimetric or volumetric density,safety,and economy [6,7].Owing to the high theoretical gravimetric capacity (7.6 wt.% for pure MgH2) and relatively abundant resources,Mg-based materials have been receiving widespread coverage from researchers as one of the most promising carriers for on-board hydrogen storage devices[8–10].But the relatively high desorption temperature (>300 °C) and slow sorption kinetics make them difficult to meet the requirements of the fuel cell module(<85 °C) and on-board hydrogen storage devices.Besides,Mg-based materials still have the problem in terms of the capacity fade during the ab/desorption cycles.
Doping additives or catalysts,such as transition metalbased catalysts (such as Nb,Ti,V,and Ni,etc.),has been considered as one of the most effective strategies to improve the hydrogen storage performance of Mg/MgH2.It can effectively accelerate the dissociation and combination of hydrogen atoms and decrease the activation energy for hydrogen desorption [11–14],thus improving the dehydrogenation kinetics and lowering the dehydrogenation temperatures [15–21].For example,Wang et al.[15]demonstrated that the N–Nb2O5(10 wt.%)-doped MgH2composite has an excellent desorption performance,releasing 5.0 wt.% H2at 250 °C within 3 min.By exfoliating the Ti3AlC2powders to synthesize 2D Ti3C2(MXene),Liu et al.[20]obtained MgH2containing 5 wt.%Ti3C2that can release 6.2 wt.% H2at 300 °C within 1 min,exhibiting superior dehydrogenation kinetics to counterparts doped with other Ti-based catalysts.In particular,metallic Ni is also an efficient and low-cost catalyst to significantly improve the hydrogen storage performance of Mg/MgH2.To name a few,Liu et al.[21]added the porous Ni@rGO to MgH2by ball milling,and the formed MgH2+5 wt.%Ni@rGO nanocomposite can still release 6 wt.% H2at 300°C within 10 min after the 9th cycle.Although the excellent catalytic effects,the amount of doped catalyst should be limited largely,especially for some heavy elements since it would lower the practical hydrogen storage capacity of the Mg/MgH2system.Therefore,the catalytic activity of the doped catalyst should be effectively improved to promote the dehydrogenation kinetics of MgH2as much as possible,so as to maintain the high hydrogen storage capacity of Mg/MgH2.
Recently,it is interesting to find that the reduction in size and improvement of dispersity would increase the catalytic activity of the catalyst [22–25].For instance,Zhang et al.[23]employed a wet-chemical method to prepare the NbHx(~10–50 nm-sized nanoparticles) and doped it into MgH2to improve its hydrogen storage properties,which can release 7.0 wt.% H2within 9 min at 300 °C.In addition,their experimental results also concluded that the smaller the particle size of the NbHxwas,the better catalytic effect on hydrogen storage performance of MgH2would be.In this regard,Chen et al.[24]reported that the well-distributed Ni nanoparticles(NPs) can provide more active catalytic sites for the absorption and desorption cycles.Specifically,the homogeneous distribution of super Ni NPs (uniform size of~10–20 nm) on the surface of MgH2was achieved by breaking the 1D fibrous Ni via ball milling.Accordingly,the MgH2doping with 4 mol% Ni NPs composites can dehydrogenate 7.02 wt.% H2within 11 min at 325 °C.More impressively,the ultrafine catalyst with homogeneous dispersity can be tailored from some precursors,such as some transition metal MXene and metal organic frameworks (MOF) [26–30].For example,Jia et.al[27]obtained ultrafine Ni NPs (2–3 nm) from Ni-MOF-74 in the MgH2matrix by a mechanochemical-force-driven procedure,which improved the hydrogen absorption/desorption processes of Mg/MgH2and was proven by theoretical calculations and experiments.Huang et al.[30]used MOF as a precursor to homogeneously disperse metallic Ni on Ti3C2.The synthesized MgH2+10 wt.% Ni@C-MXene composite can release about 5.6 wt.% H2within 2 min at 300 °C and absorb approximately 5 wt.% H2within 2 min under 3.2 MPa at 150°C,possessing an excellent cycling stability(e.g.,without obvious decay for both capacity and kinetics after 10 cycles).Particularly,a common Ni-based metal-organic complex named nickel acetylacetonate (Ni(acac)2) has been often used as a precursor for high-efficiency catalysts [31].In comparison with other Ni-based compounds (e.g.,NiCl2and NiF2),Ni(acac)2as catalyst precursor has a lower melting point (238 °C) [32,33],which is beneficial for the smaller particle size and better dispersion [34].Nonetheless,many ultrafine catalysts-doped Mg/MgH2systems still show the obvious degradation of cycle stability.[35].
It has been found that the addition of carbon can be used as a grinding aid to inhibit the grain aggregation and growth of Mg/MgH2during cycle-life (kinetics).Various carbonbased materials,such as activated carbon,carbon nanotubes,graphite,graphene,and its derivatives,are considered as additives [36–40],among which carbon nanotubes and graphite are typical representatives for the ideal candidates.For example,Liu et al.[41]supported the Co/Pd catalysts on bamboo-shape carbon nanotubes to obtain MgH2–Co/Pd@BCNTs composite,which can absorb 6.68 wt.% H2at 250 °C within 10 s.Wang et.al [42]developed a graphene-guided and growth process to prepare N-doped Nb2O5@C nanorods and the MgH2with 10 wt.% N-doped Nb2O5@C can release 6.2 wt.% H2from 170 °C to 270 °C,which has a capacity retention of 98% after 50 cycles.It should be noted that expanded graphite(EG)is one of the cheapest and most efficient carbon materials [37].
The above descriptions indicate that a suitable transition metal catalyst precursor and carbon materials (especially the EG) could be introduced into the Mg/MgH2matrix to in situ form the ultrafine and well-dispersed catalyst with high catalytic activity,thereby improving the dehydrogenation kinetics and cycle stability of Mg/MgH2system while maintaining the high hydrogen capacity (e.g.,over 7 wt.%) for the target of the on-board application.Herein,a facile one-step highenergy ball milling technique has been developed to in situ form ultrafine Ni nanoparticles catalyst in the MgH2matrix,combining the nickel acetylacetonate as a precursor and EG.On one hand,the in situ formed ultrafine Ni nanoparticles catalyst from the Ni(acac)2can significantly improve the desorption kinetics of MgH2.On the other hand,the cycle performance of Mg/MgH2is improved by the low-cost and effective EG.Consequently,the formed MgH2–Ni-EG nanocomposite with the optimized doping amounts of Ni and EG can release 7.03 wt.% H2within 8.5 min at 300 °C after 10 cycles.The exceptional hydrogen storage performance was credited to a 26.9% decrease in the dehydrogenation activation energy in comparison with pure MgH2.In addition,the evaluation process of Ni(acac)2and was revealed on the basis of the microstructural characterization analysis.
2.Material and methods
2.1. Sample preparations
The high-purity Ni(acac)2(99%,Aladdin),MgH2(98%,Aladdin),Ni powder (99%,Maclin),and expandable graphite(XingRuiDa Graphite manufacturing Co.,Ltd.) were used as raw materials.The received expandable graphite was annealed in an Ar atmosphere at 1300 °C for 2 h,and then sintered in a H2atmosphere at 400 °C for 4 h to obtain EG.Ni(acac)2was doped into the commercial MgH2at mass percentages ofx=1 wt.%,3 wt.%,5 wt.%,7 wt.%,and 10 wt.%,respectively,via a vibration-type ball mill (QM-3C,Nanjing,China)at 1200 rpm for 5 h under H2pressure of 1.5 MPa.Further,the EG was introduced into MgH2with Ni(acac)2together by ball milling.The mass ratio of MgH2,Ni(acac)2,and EG is 97:1.5:1.5 (denoted as MgH2–Ni-EG).For the comparison,pure Ni powder was also doped into MgH2(donated as MgH2–Nip-EG) by ball milling for 5 h The ball-to-sample radio was around 50:1 during the milling process,which was conducted for 30 min after every 30 min pause.
2.2. Characterizations
The X-ray diffraction (XRD) equipped with Cu Kαradiation (λ=0.15,418 nm) operated at 45 kV and 40 mA was used to identify the phase of the samples.The XRD data was captured in a 2θrange of 15°~85° with a step of 0.026°.A scanning electron microscope (Zeiss Supra-40)and a transmission electron microscope (JEM-2100,Japan)were used for observing morphologies and microstructures of the samples.X-ray photoelectron spectroscopy (XPS) spectra (Thermo Fisher Scientific K-Alpha) were performed with a monochromatic Al KαX-ray source at a base pressure of 5 × 10⁻⁹mbar to obtain the relevant valence information about the sample.The XPS data were fitted using Avantage software.
The hydrogen sorption properties of materials were measured by using PCT Pro2000,in which the sample with a mass of 180±5 mg was loaded into a stainless-steel sample holder.For non-isothermal dehydrogenation tests,the sample was heated at a heating rate of 2 K/min under a vacuum environment for desorption.For isothermal measurements,the sample was heated to the preset temperature at a heated rate of 5 K/min and then start the next dehydrogenation experiments.In addition,the sample with the mass of 9.5±0.5 mg was loaded into an alumina crucible for thermal analysis(DSC,Setaram SENSYS Evolution) and it was heated from room temperature to 450 °C at different rates (2,7,10 and 15 K/min,respectively) under an argon atmosphere.Before the measurement for DSC,the MgH2–Ni-EG and MgH2–Nip-EG composites were activated via dehydrogenation and hydrogenation procedures at 300 °C.
3.Results and discussion
3.1. Catalytic effects of Ni in situ formed from Ni(acac)2
Ni(acac)2precursors with different mass fractions were added to MgH2via vibratory-type high-energy ball milling to investigate the effect of Ni(acac)2addition on the hydrogen storage performance of MgH2.Fig.1 shows the XRD results of MgH2+xwt.% Ni(acac)2(x=1,3,5,7,and 10)samples after high-energy ball milling which can provide sufficient energy for the reaction between them.Obviously,the diffraction peaks associated with theβ-MgH2,γ-MgH2,and a little amount of MgO phases can be well indexed in the ballmilled MgH2+xwt.%Ni(acac)2samples.Characteristic peaks related to Ni(acac)2cannot be found,indicating the chemical reaction between MgH2and Ni(acac)2or the decomposition of Ni(acac)2during the ball milling process.However,there are no diffraction peaks of Ni and/or Ni-based compounds in the XRD patterns.It may be due to the small content of the Ni phase or the small size in situ formed Ni particles from Ni(acac)2(as evidenced by the HRTEM observations in the following section),which might result in the corresponding diffraction peaks being too weak to detect.In addition,it should be noted that the peak intensity of the MgO phase become stronger with the increase of the mass percent of Ni(acac)2(Fig.S1),which suggests that the O element might come from the C=O group of Ni(acac)2to facilitate the formation of the MgO phase.
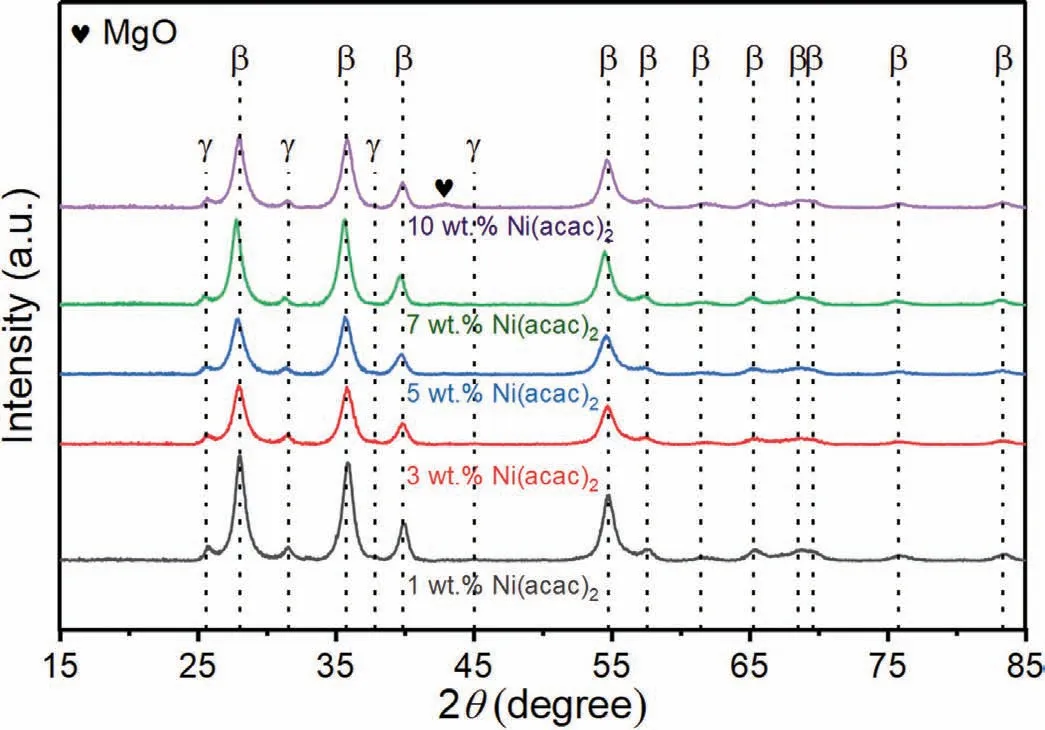
Fig.1.The XRD patterns of MgH2+x wt.% Ni(acac)2 samples (x=1,3,5,7 and 10).
Non-isothermal dehydrogenation curves of MgH2+xwt.%Ni(acac)2samples (x=1,3,5,7,and 10) were firstly tested to explore the influence of Ni(acac)2precursor on the hydrogen storage performance of MgH2,which was also compared with the pure MgH2treated under the same conditions of ball milling.Specifically,the temperature at which the sample releases 0.1 wt.% H2was used as the initial dehydrogenation temperature during the non-isothermal dehydrogenation test.As shown in Fig.2(a),it can be clearly seen that the initial dehydrogenation temperature of the MgH2+xwt.%Ni(acac)2samples decrease with the increase of the addition of Ni(acac)2,i.e.,around 260°C,254°C,245°C,243°C and 234 °C forx=1,3,5,7,and 10,respectively.These initial hydrogen release temperatures of all MgH2+xwt.%Ni(acac)2samples are lower than 265 °C of as-milled pure MgH2.In addition,the kinetics of MgH2+xwt.% Ni(acac)2samples in the subsequent dehydrogenation are better than that of the asmilled MgH2sample.It should also be noted that the hydrogen storage capacity of the MgH2+xwt.% Ni(acac)2samples is decreased with the increase of the addition of Ni(acac)2.
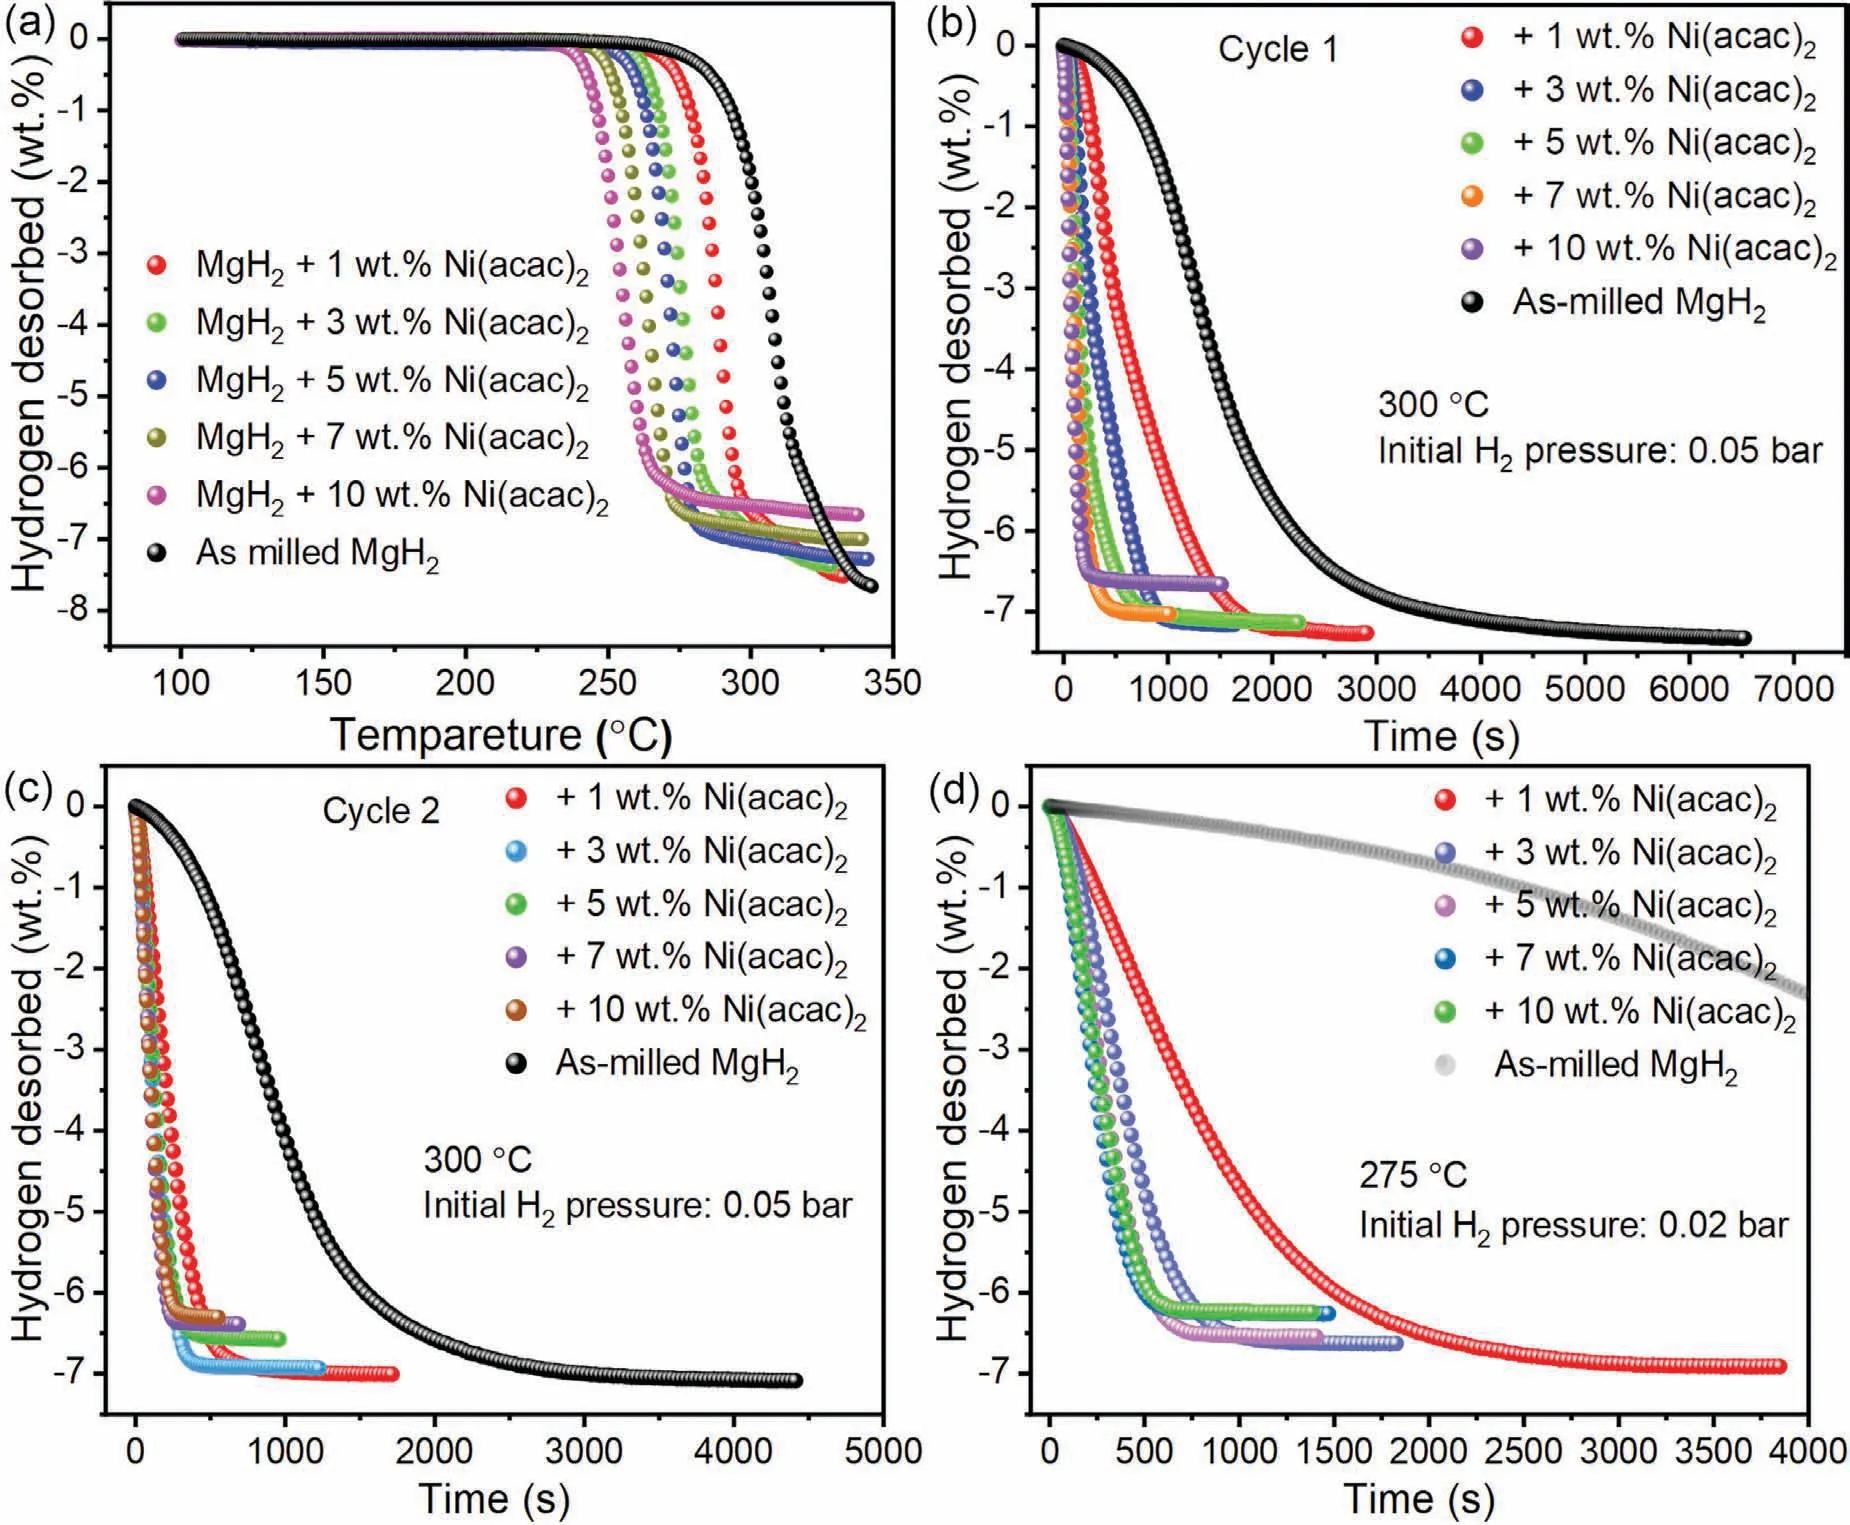
Fig.2.Non-isothermal dehydrogenation curves (a).The first (b) and second (c) isothermal dehydrogenation curves at 300 °C.(d) The second isothermal dehydrogenation curves at 275 °C of MgH2 + x wt.% Ni(acac)2 (x=1,3,5,7 and 10) and as-milled MgH2 samples.
Furthermore,the first and second-cycle isothermal dehydrogenation curves of the MgH2+xwt.% Ni(acac)2samples and as-milled MgH2at 300 °C under initial H2pressure of 0.05 bar were given and compared in Fig.2(b) and (c),respectively.Obviously,all the MgH2+xwt.% Ni(acac)2samples demonstrate the much better dehydrogenation kinetics than the as-milled MgH2sample.Fig.2(b) shows that the MgH2+xwt.% Ni(acac)2samples can release H2ranging from 7.26 wt.% to 6.66 wt.% at 300 °C in the first cycle,with increasing the doping amount of Ni(acac)2from 1 wt.% to 10 wt.%.And the increment in the doping amount of Ni(acac)2could also speed up the dehydrogenation kinetics of MgH2in the first dehydrogenation process.Noticeably,the dehydrogenation kinetics of the MgH2+xwt.% Ni(acac)2are further accelerated in the second cycle (Fig.2(c)),especially for the MgH2+xwt.%Ni(acac)2samples with relatively small Ni(acac)2amount.For example,the MgH2+1 wt.% Ni(acac)2sample spends~1580 s to release 6.9 wt.% H2in the first dehydrogenation process,as shown in Fig.2(b-c),which is significantly reduced to be~758 s in the second dehydrogenation process.When the addition of Ni(acac)2exceeds a certain value (i.e.,higher than 3 wt.%) at 300 °C,the dehydrogenation kinetics of MgH2+xwt.% Ni(acac)2samples would keep unimproved in the second dehydrogenation cycle,while the hydrogen capacity is decreased correspondingly,as shown in Fig.2(c).In other words,the MgH2+3 wt.%Ni(acac)2sample may exhibit the best combination of the dehydrogenation kinetics and hydrogen storage capacity(~6.9 wt.% H2for the second dehydrogenation test) at 300°C,showing the sufficient catalytic effect without scarifying the hydrogen capacity.This optimized doping amount is very important for designing the subsequent experiments,which will be discussed later.
In addition,the isothermal dehydrogenation kinetics curves of the MgH2+xwt.% Ni(acac)2samples were measured at a lower temperature of 275 °C under initial H2pressure of 0.02 bar to further understand the effect of Ni(acac)2addition on the dehydrogenation kinetics of MgH2,as shown in Fig.2(d),exhibiting the significantly enhanced dehydrogenation kinetics performance in comparison with the asmilled MgH2sample.Noticeably,when the added amount of Ni(acac)2is increased to 5 wt.%,the improvement in the dehydrogenation kinetics of MgH2will be not obvious anymore.For instance,the MgH2+5 wt.% Ni(acac)2sample releases 6.27 wt.% H2within 10 min and 6.5 wt.% H2within 13 min,respectively.Similarly,the 10 wt.% Ni(acac)2-doped sample can release the slightly less hydrogen capacity of 6.15 wt.% within 10 min,which might be caused by the more addition of Ni(acac)2.Different from that at 275 °C,it is noted that the dehydrogenation kinetics of the MgH2+10 wt.% Ni(acac)2sample can be significantly faster than MgH2+5 wt.% Ni(acac)2sample at two lower temperatures of 250°C under initial H2pressure of 0.002 bar and 225°C under initial H2pressure of 0 bar,respectively,as shown in Fig.3.It is reasonable to see in Fig.3(a)that MgH2+10 wt.%Ni(acac)2sample with more addition results in a lower reversible hydrogen storage capacity than the MgH2+5 wt.%Ni(acac)2sample at 250 °C.However,Fig.3(b) shows that both MgH2+5 wt.%Ni(acac)2and MgH2+10 wt.%Ni(acac)2sample can desorb equivalent H2capacity of 5.6 wt.% within 120 min at the lower temperature of 225 °C,but the dehydrogenation kinetics of the former is slower than the latter.For example,the MgH2+5 wt.% Ni(acac)2sample releases 3.6 wt.% H2with 1 h,significantly lower than 4.6 wt.% H2for the MgH2+10 wt.% Ni(acac)2sample.The above dehydrogenation curves of MgH2+xwt.% Ni(acac)2tested at various temperatures indicate that appropriately controlling the amount of the additive could achieve the optimal combination of the fast desorption kinetics and high hydrogen storage capacity at a certain temperature.

Fig.3.Isothermal dehydrogenation curves of MgH2 + x wt.% Ni(acac)2 samples at 250 °C (a) and 225 °C (b).
3.2. Hydrogen storage performance of MgH2–Ni-EG nanocomposite
The results of dehydrogenation tests suggest that MgH2+3 wt.%Ni(acac)2sample might have the optimal combination of reversible hydrogen storage capacity and desorption kinetics at 300 °C.Subsequently,the cycle stability of the MgH2+3 wt.% Ni(acac)2sample was further measured at 300 °C under initial H2pressure of 0.05 bar using isothermal dehydrogenation mode,as shown in Fig.4(a).It is found that the capacity of MgH2+3 wt.% Ni(acac)2sample is decayed rapidly from 7.15 wt.% in the first cycle to 6.73 wt.%in the fifth cycle during the dehydrogenation cycle-life (kinetics),showing the relatively poor cycle stability.This phenomenon may be related to the agglomeration of Mg/MgH2and catalysts during high-temperature cycles [25,40,43],leading to the incomplete hydrogenation of Mg(also evidenced by our XRD results in Fig.8(b) in the later section).Therefore,the prepared EG with the same weight fraction was introduced to improve the cycle stability of the MgH2,denoting as MgH2+3 wt.% EG.And the XRD pattern and SEM image of EG were shown in Fig.S2 and Fig.S3,respectively.Owing to the huge improvement in the cycle stability from EG,as shown in Fig.4(b)and(c),the MgH2+3 wt.%EG sample can maintain the hydrogen capacity of 7.05 wt.% after 5 cycles.To balance the dehydrogenation kinetics and cycle stability,the Ni(acac)2and EG were added to MgH2together with a mass ratio of 1:1,namely MgH2:Ni(acac)2:EG=97:1.5:1.5(donated as MgH2–Ni-EG)).

Fig.4.The isothermal cycle-life (kinetics) curves of MgH2+3 wt.% Ni(acac)2 (a) and MgH2+3 wt.% EG sample (b).Hydrogen capacity versus cycle numbers of these two samples (c).
Accordingly,the hydrogen storage performance,including the isothermal hydrogenation and dehydrogenation measurements,was characterized for the MgH2–Ni-EG nanocomposite.Fig.5(a) shows the isothermal dehydrogenation curves of MgH2–Ni-EG nanocomposite at different temperatures of 275 °C,300 °C,and 320 °C,respectively.Excitingly,the MgH2–Ni-EG nanocomposite can release 7.0 wt.% H2within 9.3 min at 300 °C and within 4.2 min at 320 °C,respectively.To the best of our knowledge,this should be the best performance in the literature in terms of the dehydrogenation hydrogen capacity of 7.0 wt.% for the Ni catalyst.The final dehydrogenation capacity of the MgH2–Ni-EG nanocomposite is reduced to 6.8 wt.% at 275 °C,which is still significantly better than pure MgH2that only can desorb 0.55 wt.% H2at 300 °C within the same period of dehydrogenation time.Fig.5(b) shows the hydrogen absorption performance of the MgH2–Ni-EG nanocomposite at several different temperatures ranging from 50 °C to 125 °C under initial H2pressure of 50 bar It turns out that MgH2–Ni-EG nanocomposite can absorb 5.6 wt.% H2within 60 min at 100 °C,and the finally reach 6.3 wt.% within 2 h When the temperature increases to 125 °C,the hydrogen absorption kinetics of the sample is greatly accelerated,absorbing 6.0 wt.% H2within 40 min and 6.51 wt.%H2within 75 min.Even at a low temperature of 50°C,2.42 wt.% and 3.44 wt.% H2can still be absorbed within 1 h and 2 h,respectively,which is much better than that of the pure as-milled MgH2.In addition,the hydrogen absorption kinetics of MgH2–Ni-EG and MgH2+3 wt.% Ni(acac)2samples are given and compared in Fig.S4,which shows that the hydrogen absorption kinetics of MgH2–Ni-EG sample are slower than MgH2+3 wt.%Ni(acac)2sample at relatively low temperatures of 50 °C and 100 °C.When the temperature increasing to 125°C,the MgH2–Ni-EG sample exhibits a better hydrogen absorption kinetics and higher hydrogen absorption capacity than that of the MgH2+3 wt.% Ni(acac)2sample,consistent with the dehydrogenation kinetics performance.
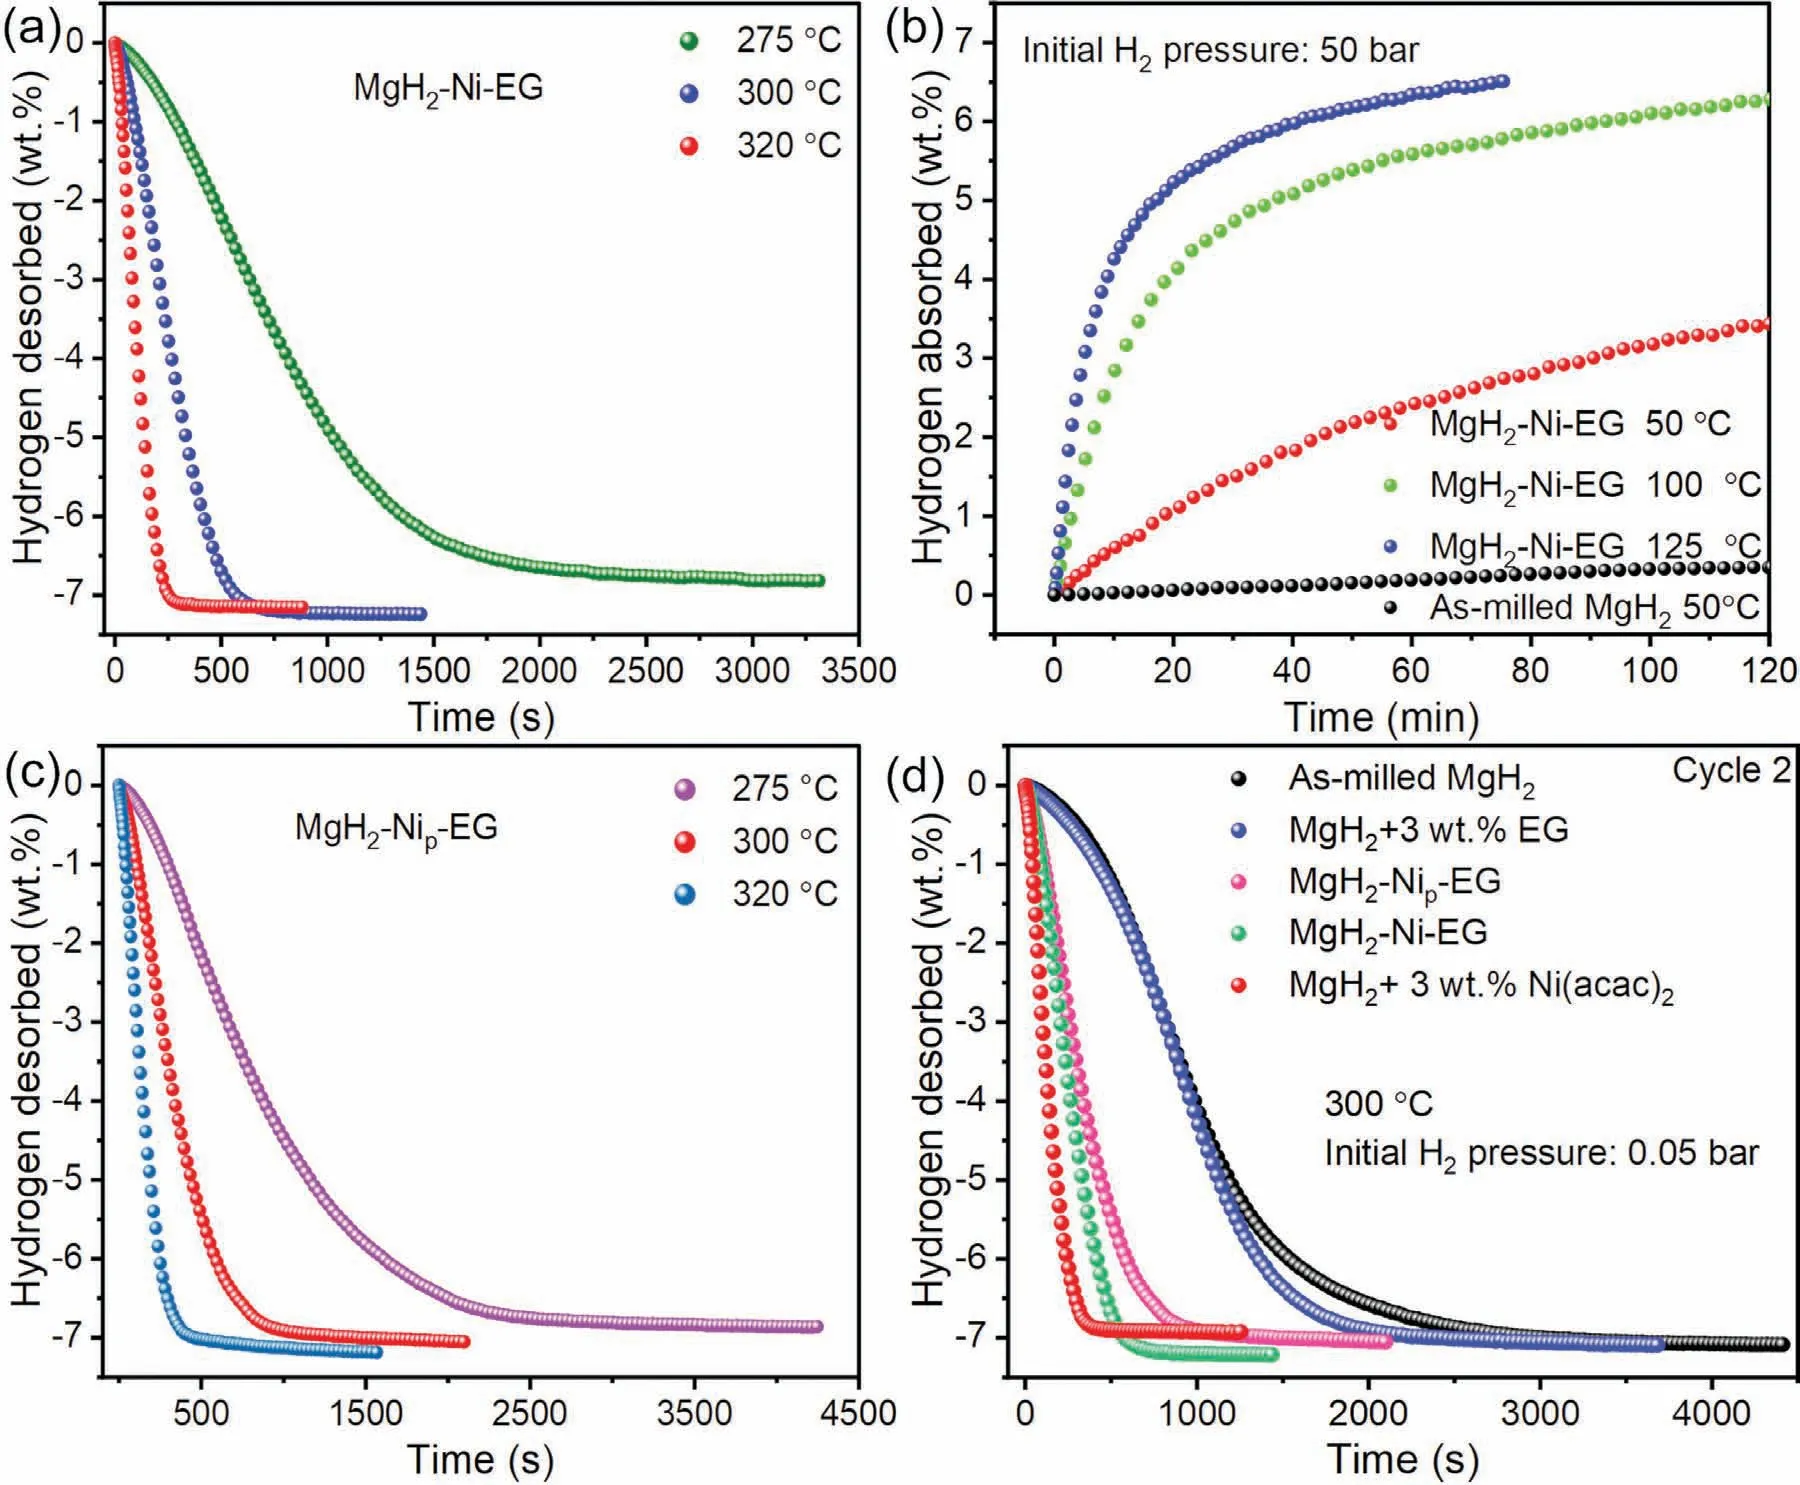
Fig.5.Isothermal dehydrogenation(a),isothermal hydrogenation(b)curves of MgH2–Ni-EG nanocomposite;isothermal dehydrogenation curves of MgH2–Nip-EG composite (c);The second isothermal dehydrogenation curves (d) of MgH2+3 wt.% EG,MgH2–Ni-EG,MgH2–Nip-EG,MgH2+3 wt.% Ni(acac)2 and as-milled MgH2 samples,respectively,at the temperature of 300 °C.
Fig.5(c) gives the dehydrogenation kinetics curves of MgH2–Nip-EG composite at the same temperatures of 275°C,300 °C,and 320 °C,respectively,to compare with the MgH2–Ni-EG nanocomposite using Ni(acac)2as a precursor.Since the content of Ni in Ni(acac)2is~22.6 wt.%,the actual Ni content in the MgH2–Ni-EG nanocomposite is 0.33 wt.%.Therefore,the metallic Ni powder with the amount of 0.33 wt.% and EG with 1.5 wt.% were selected to prepare the MgH2–Nip-EG sample for comparison.Fig.5(c)shows that the MgH2–Nip-EG composite needs 25.5 min to desorb 7.0 wt.% H2at 300 °C,obviously longer than that 9.3 min for the MgH2–Ni-EG nanocomposite.In addition,the MgH2–Ni-EG nanocomposite also shows faster dehydrogenation kinetics at both 275 °C and 320 °C.As a concluding point,Fig.5(d) compares the dehydrogenation kinetics curves of different samples at 300 °C.Although the MgH2+3 wt.%Ni(acac)2sample shows the best dehydrogenation kinetics,the poor cycle stability and the loss of theoretical hydrogen storage capacity due to the reaction of Ni(acac)2with MgH2lead to the necessity to further optimize its performance.Thanks to the excellent catalytic performance of the catalyst,the MgH2–Ni-EG nanocomposite can not only speed up the dehydrogenation kinetics rate but also increase the dehydrogenation capacity,compared to the MgH2+3 wt.% EG,MgH2–Nip-EG,and as-milled MgH2samples.Thus,replacing part of Ni(acac)2by EG to improve the cycle stability of the composite is necessary,as indicated by our experimental results.
Further,the effects of Ni(acac)2and EG on the dehydrogenation process of MgH2–Ni-EG nanocomposite was analyzed by DSC in Fig.6(a),which indicates that the dehydrogenation peak temperatures of MgH2–Ni-EG nanocomposite are 293.20 °C,321.35 °C,329.20 °C,and 340.04 °C at the heating rates of 2,7,10,and 15 K/min,respectively.And the pure MgH2and MgH2–Nip-EG were also studied by the DSC method,as shown in Fig.S5 and Fig.S6.Based on DSC curves at different heating rates,the dehydrogenation activation energy (Ea) can be calculated using Kissinger’s method as follows [44]:
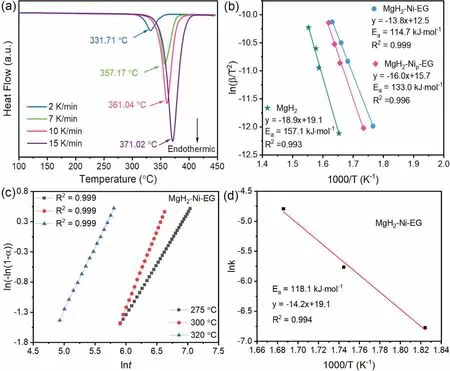
Fig.6.DSC curves of MgH2–Ni-EG nanocomposite at different heating rates (2,7,10,and 15 K/min) (a),Kissinger’s plots,and corresponding fitting lines for pure MgH2,MgH2–Ni-EG,and MgH2–Nip-EG samples (b).JMAK plots (c),and Arrhenius’s plots of MgH2–Ni-EG nanocomposite (d).
whereEais the apparent activation energy (kJ·mol-1),βis the heating rate (K/min),Tmaxis the absolute temperature for the maximum reaction rate (K),andRis the gas constant(J/(K·mol)),respectively.Based on Eq.(1),theEacan be obtained by linearly fitting the slope of the plot with ln(β/T2max)versus 1/T (Fig.6(b)).Accordingly,the dehydrogenation activation energy (Ea) of MgH2–Ni-EG nanocomposite is linearly fitted to be 114.7 kJ·mol-1,which is lower than 133.0 kJ·mol-1for MgH2–Nip-EG sample and 157.1 kJ·mol-1for pure MgH2,respectively.On the other hand,Johnson-Mehl-Avrami-Kolmogorov (JMAK) equation can be expressed as[42]:
whereαis the dehydrogenation reaction fraction at timet,ηis Avrami index,kis the dehydrogenation rate constant andtis the reaction time,respectively.Combining the Arrhenius equation,the dehydrogenation activation energy of the MgH2–Ni-EG sample can also be obtained by a linearly fitting plot with lnk versus 1000/T.Fig.6(c) shows the fitting results of the dehydrogenation kinetics curves for the MgH2–Ni-EG sample at 275 °C,300 °C,and 320 °C,respectively,contributing to a dehydrogenation activation energy of 118.1 kJ·mol-1in Fig.6(d).It should be noticed that the dehydrogenation activation energy of the MgH2–Ni-EG sample calculated by the above two methods is very close.Both the high reversible hydrogen storage capacity of 7 wt.% and the faster dehydrogenation kinetics for the MgH2–Ni-EG sample can be understood by the decreased dehydrogenation activation energy.
The excellent reversible hydrogen storage capacity of the MgH2–Ni-EG sample over 7.0 wt.% was also confirmed by the dehydrogenation PCI curves (Fig.7) at 300 °C,320 °C,and 340 °C,respectively.Consistently,the dehydrogenation PCI curves in Fig.7(a) show that MgH2–Ni-EG nanocomposite has a hydrogen storage capacity of~7.1 wt.% at all temperatures.In addition,based on the dehydrogenation plateau pressure corresponding to the different temperatures(Table S1),the linearly fitted slope of the van’t Hoff curve(Fig.7(b)) denotes the dehydrogenation reaction enthalpy(ΔH) of 76.5 kJ·mol-1for the MgH2–Ni-EG sample,which is almost equivalent to that of pure MgH2,indicating that the addition of Ni(acac)2and EG hardly influences the thermodynamic property of MgH2.
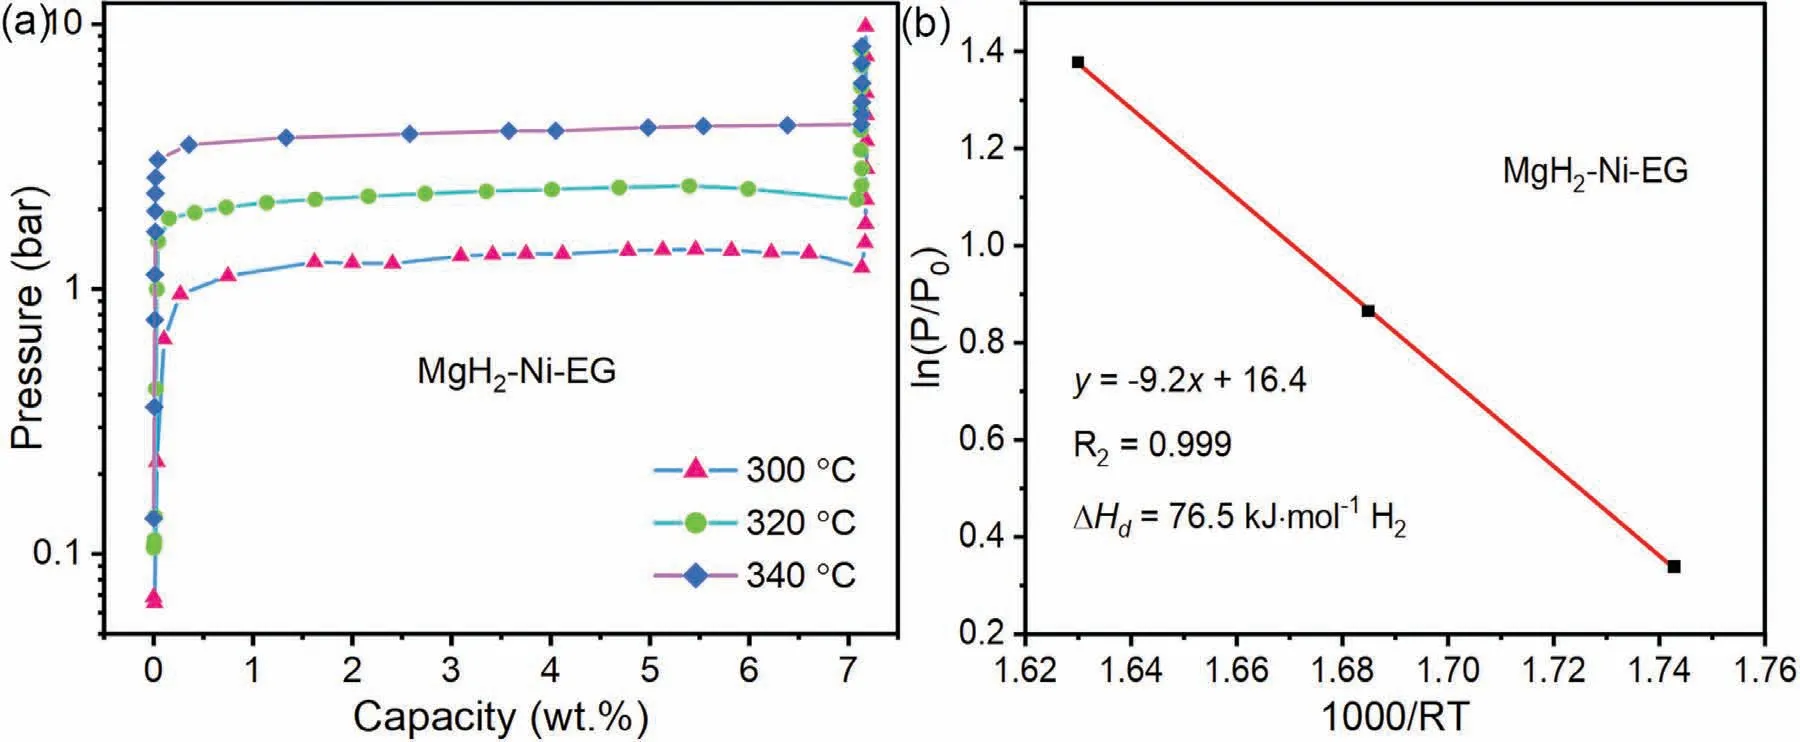
Fig.7.P-C-I curves (a) and corresponding van’t Hoff plots (b) of the MgH2–Ni-EG nanocomposite.
3.3. Evolution of Ni(acac)2 and catalytic mechanism during hydrogen de/absorption processes
The XRD patterns at different states of MgH2–Ni-EG nanocomposite during ball milling and the cycle-life(kinetics)process were obtained in Fig.8 to clarify the evolution process of Ni(acac)2.Fig.8(a) shows that the diffraction peaks ofβ-MgH2,γ-MgH2,and trace amount MgO phases can be found in the as-milled MgH2–Ni-EG sample.As mentioned earlier,the formation of the MgO phase may be due to the reaction between MgH2and Ni(acac)2during ball milling(Fig.8(c)).However,it should be noted that neither metallic Ni nor Ni-based compounds were detected from the XRD patterns in the as-milled,dehydrogenated,and rehydrogenated samples.It might be due to the low concentration of Ni being ultrafine particles.In this regard,the XRD pattern of asmilled,dehydrogenated,and rehydrogenated MgH2+10 wt.%Ni(acac)2sample with a higher amount of Ni were obtained in Fig.8(b),in which Mg2Ni and Mg2NiH4phases can be wellindexed.Admittedly,the in situ formed Mg2Ni/Mg2NiH4can actively affect the re/dehydrogenation process of MgH2as a“hydrogen pump” [45].
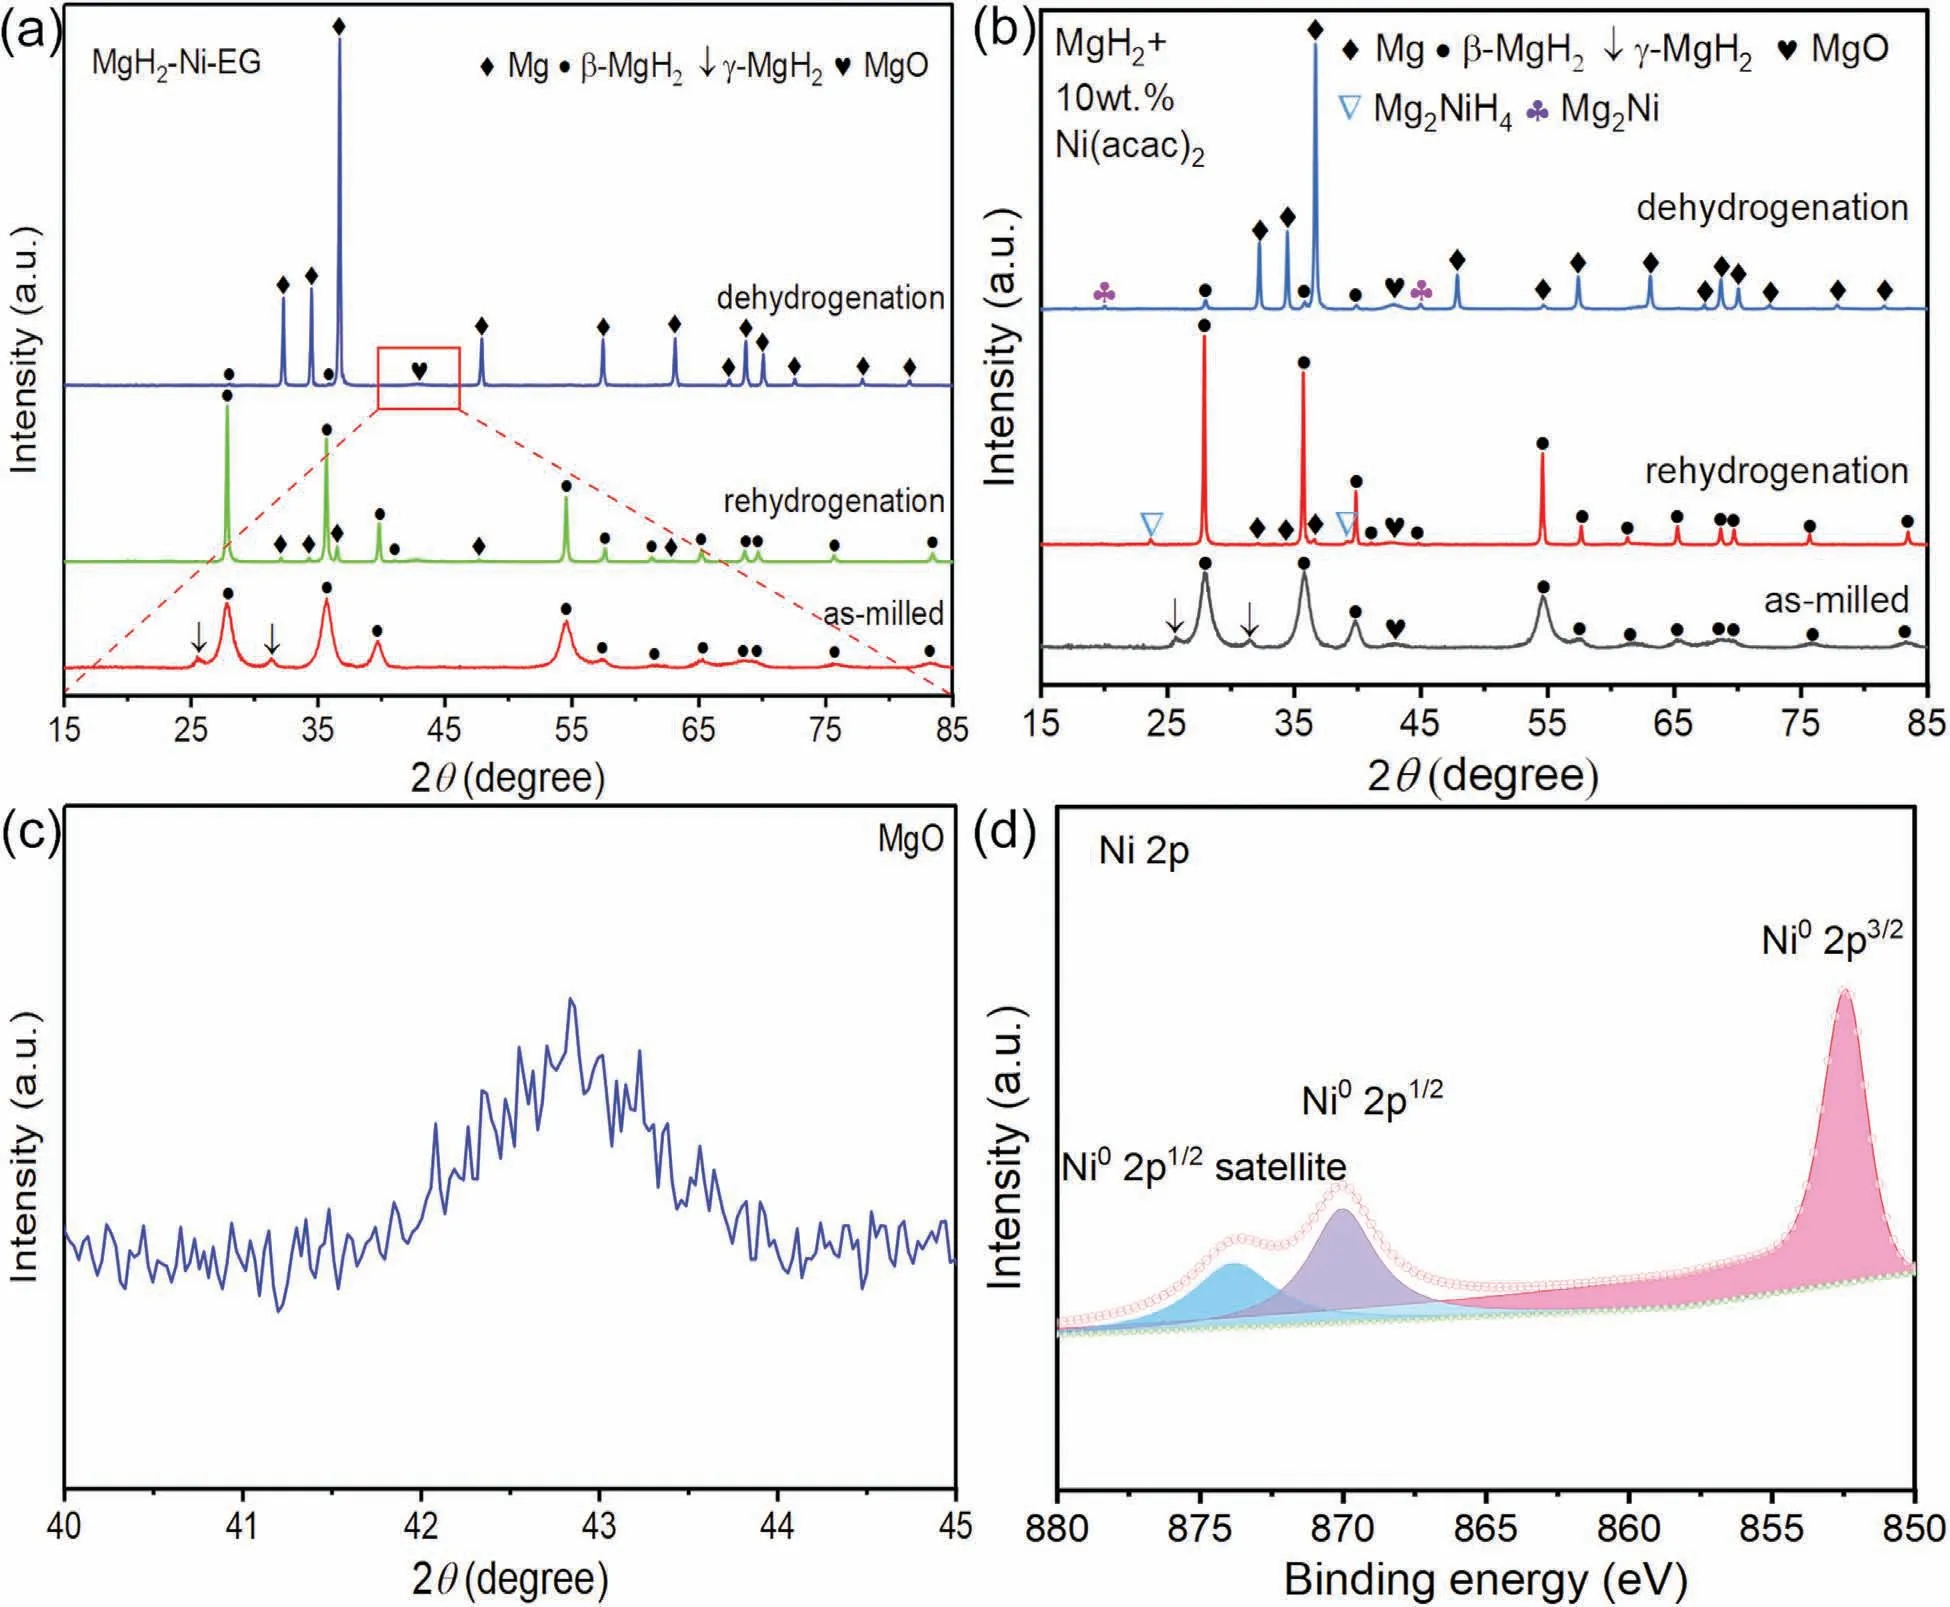
Fig.8.XRD patterns of the as-milled,dehydrogenated and rehydrogenated MgH2–Ni-EG (a) and MgH2+10 wt.% Ni(acac)2 composite (b);The expanded view of MgO for MgH2–Ni-EG nanocomposite (c),High resolution XPS spectra for Ni 2p of MgH2+10 wt.% Ni(acac)2 sample(d).
XPS was also used to analyze the chemical states of Ni in the sample after ball milling.Similarly,an effective XPS signal related to the Ni might still not be detected in the MgH2–Ni-EG nanocomposite because of the too low concentration of Ni.Therefore,the high-resolution spectrum of the Ni 2p was obtained from the as-milled MgH2+10 wt.%Ni(acac)2sample,which is shown in Fig.8(d).The Ni 2p spectrum exhibits two 2p1/2and 2p3/2contributions located at 852.38 and 869.98 eV,respectively,which can be assigned to Ni0.And the characteristic peak at 873.78 eV is the satellite peak of Ni02p1/2,also implying that the valence state of metal Ni is 0.In addition,Fig.9 gives the HRTEM images of the microstructure and distribution of the in situ formed ultrafine Ni particles in the as-milled MgH2–Ni-EG nanocomposite.As marked by the yellow lines,two typical diffraction rings in SAED patterns can be indexed to (211) planes of MgH2(PDF#01–074–0934) and (220) planes of metallic Ni (PDF#01–070–0989) phases,respectively,in the as-milled MgH2–Ni-EG sample.In addition,the HRTEM image of the as-milled MgH2–Ni-EG nanocomposite in Fig.9(c) also confirms the existence of these two phases.More specifically,the interplanar spacing ofd(111)=0.287 nm forγ-MgH2,d(101)=0.255 nm for □-MgH2,andd(111)=0.204 nm for Ni are measured,respectively.In addition,a Fast Fourier Transform (FFT) pattern of the area circled by the red circle in Fig.9(c) is also given in its insert,showing the (111) plane of the metallic Ni phase.It should be noted that the ultrafine metallic Ni (4–5 nm) is in situ formed and dispersed uniformly in the MgH2matrix,as shown in Fig.9(c),which is consistent with the reference work [27].Therefore,the evolution process of Ni(acac)2can be described as follows:
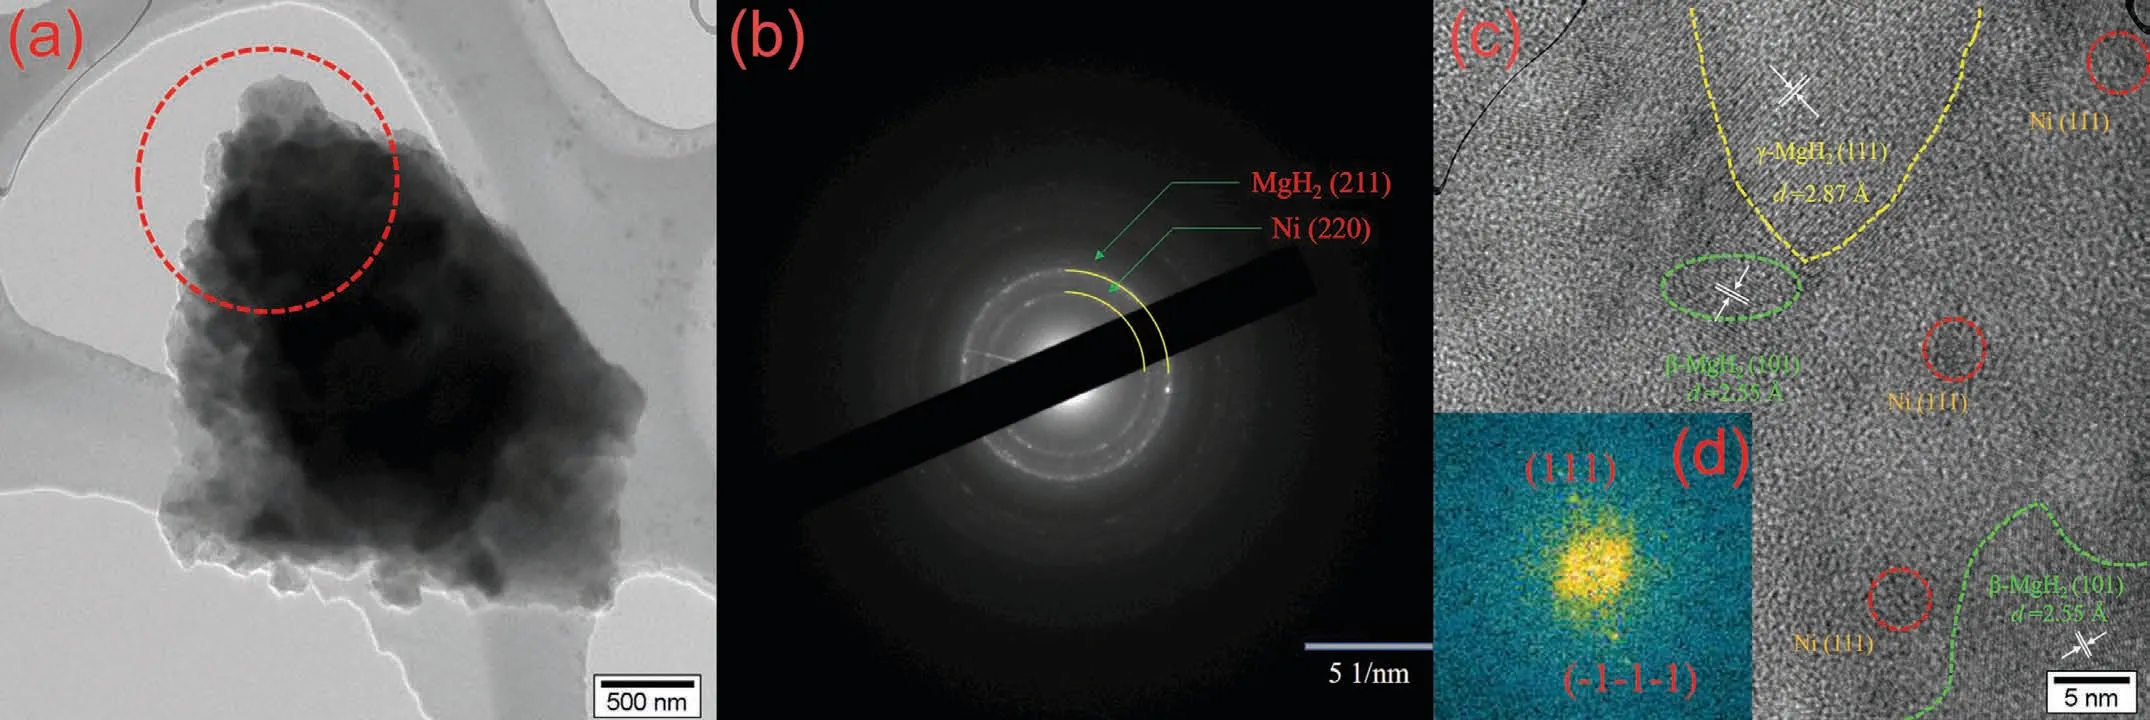
Fig.9.TEM (a),SAED (b),HRTEM image (c) of as-milled MgH2–Ni-EG nanocomposite,and corresponding FFT pattern of metallic Ni (d).
3.4. The cycle performance of the MgH2–Ni-EG nanocomposite
The cycling stability of MgH2–Ni-EG nanocomposite has been evaluated in Fig.10 for the purpose of the potential practical application.During the cycling testing,the MgH2–Ni-EG nanocomposite was operated to absorb H2at 300 °C under initial H2pressure of 50 bar for 25 min and then started the dehydrogenation kinetics test at the same temperature under initial H2pressure of 0.05 bar.Fig.10 shows that the MgH2–Ni-EG nanocomposite is able to maintain a high hydrogen storage capacity of 7.03 wt.% even after 10 hydrogen ab/desorption cycles.It achieves a hydrogen capacity retention of up to 97.2%(Fig.S7),which is referred to the second-cycle capacity.Surprisingly,the MgH2–Ni-EG nanocomposite exhibits faster dehydrogenation kinetics with the increase of the cycle number.There is no doubt that the in situ formed ultrafine and uniformly dispersed metallic Ni from Ni(acac)2precursor and the EG combined in the MgH2–Ni-EG nanocomposite can significantly improve the hydrogen storage performance of MgH2,including the dehydrogenation kinetics,high hydrogen capacity,and cycle stability.

Fig.10.Cycling profiles of MgH2–Ni-EG nanocomposite under dehydrogenation conditions at 300 °C and the initial H2 pressure of 0.05 bar.
Fig.11 shows the TEM results of the MgH2–Ni-EG sample after 10th dehydrogenation.It can be proved from the SAED patterns (Fig.11(a)) that the main phases of the dehydrogenated MgH2–Ni-EG sample are Mg and Mg2Ni phases,which is consistent with the XRD results (Fig.8(b)).The interplanar spacingd(101)=0.245 andd(200)=0.245 can be also well-indexed for Mg (PDF#01–089–7195) and Mg2Ni(PDF#01–075–1249) phases,respectively,in the HRTEM image (Fig.11(b)).Note that the in situ formed Mg2Ni distributed around the Mg particles can act as catalytic active sites.In addition,the EDX analysis of the dehydrogenated MgH2–Ni-EG sample (Fig.11(c-f)) shows that the Ni and C elements are still homogeneously distributed on the MgH2matrix,in lieu of aggregation after 10 dehydrogenation/hydrogenation cycles.Therefore,the TEM observations reveal that the in situ formed Mg2Ni/Mg2NiH4phase has been well-maintained with the cycles,in which the highdispersibility of Ni and C elements might contribute to such superior cycling stability of the MgH2–Ni-EG system.
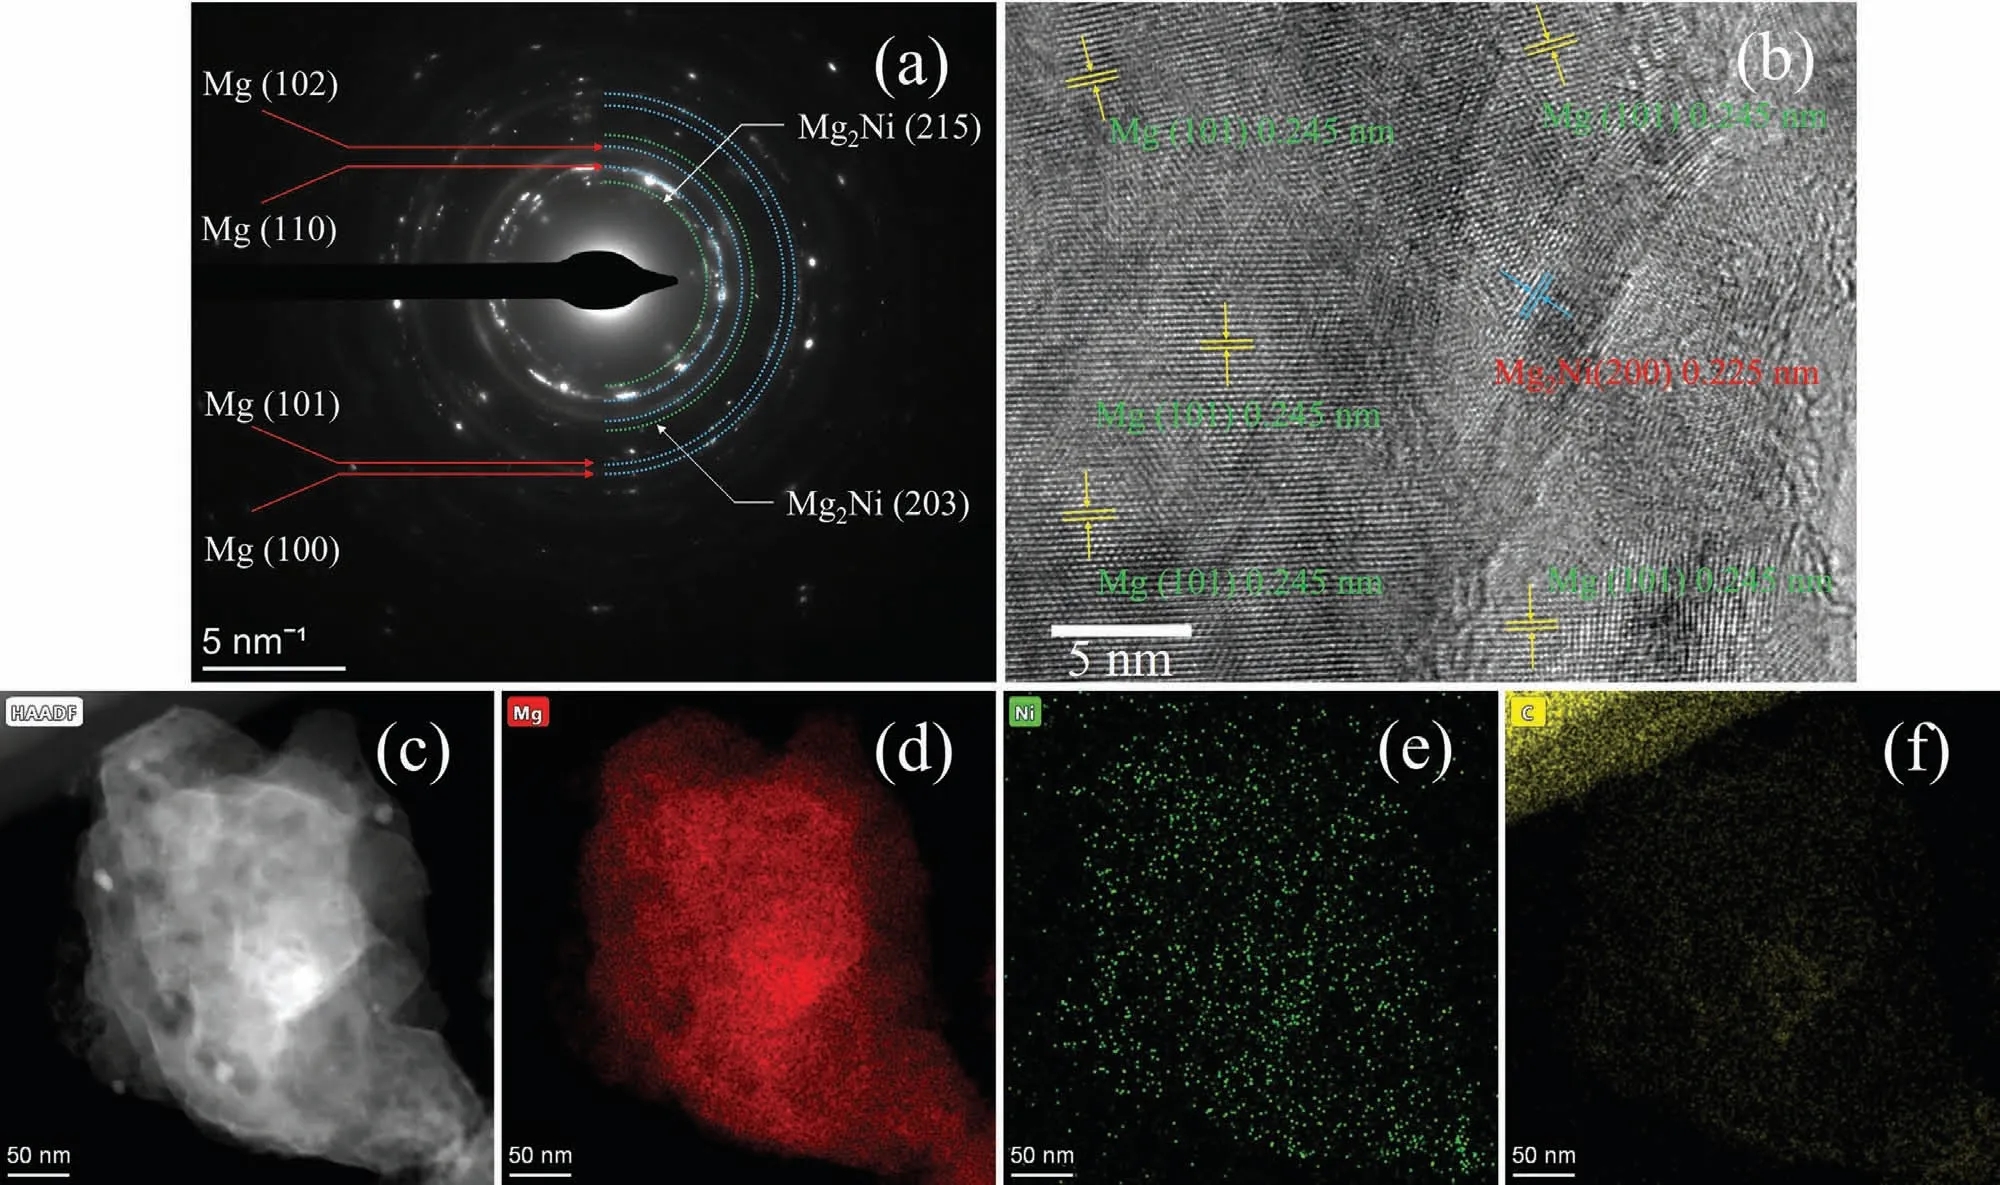
Fig.11.SAED patterns (a),HRTEM image (b),and (c-f) corresponding EDX results of Mg,Ni,and C elements of the MgH2–Ni-EG sample after 10th dehydrogenation.
Fig.12 schematically summarizes the roles of the in situ formed Mg2Ni/Mg2NiH4and EG in improving the hydrogen storage performance of MgH2and the catalytic mechanism.More specifically,the Mg2Ni/Mg2NiH4converted from the ultrafine metallic Ni and EG are homogeneously dispersed on the interface of the MgH2particles.First,the highly dispersed Mg2Ni/Mg2NiH4provides a large number of active sites for the hydrogen absorption/desorption reactions of MgH2,which can reduce the dehydrogenation activation energy and accelerate its hydrogen de/absorption kinetics.Secondly,the presence of EG can inhibit the grain agglomeration and growth of Mg/MgH2at high temperatures and thus improve the cycle stability of the MgH2–Ni-EG nanocomposite.With the combined action of the in situ formed Mg2Ni/Mg2NiH4and EG,the MgH2–Ni-EG nanocomposite not only can ensure suitable dehydrogenation kinetics but also show good cycle stability.
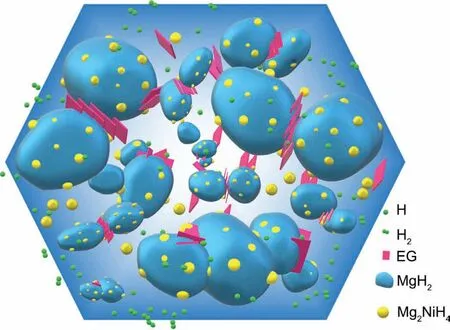
Fig.12.Schematic summary of the catalytic mechanism for in situ formed Mg2Ni/Mg2NiH4 and EG during the dehydrogenation process of MgH2.
4.Conclusions
In this work,a facile one-step high-energy ball milling process is developed to in situ form ultrafine Ni nanoparticles with uniform dispersity from the nickel acetylacetonate precursor in the MgH2matrix.On one hand,the in situ formed ultrafine Ni nanoparticles catalyst from the Ni(acac)2can significantly improve the desorption kinetics of MgH2.On the other hand,the cycle performance of Mg/MgH2is improved by the low-cost and effective EG.After tailoring the amounts of the catalyst,the MgH2–Ni-EG nanocomposite can combine the individual functions from the ultrafine metallic Ni catalyst and EG to release 7.03 wt.% H2within 8.5 min after 10 cycles,showing an exceptional hydrogen storage performance.The activation energy of dehydrogenation is reduced to 115 kJ/mol from 157.1 kJ/mol for pure MgH2.Additionally,the MgH2–Ni-EG sample can absorb 2.42 wt.% H2within 1 h at a temperature close to room temperature(50°C).As a result,the ultrafine metallic Ni (<5 nm) in situ formed and the Mg2Ni/Mg2NiH4generated in the subsequent hydrogen absorption and desorption process play a critical role in the improvement of the hydrogen ab/desorption kinetics of MgH2.Our work provides a methodology to significantly improve the hydrogen storage performance of MgH2by combining the in situ formed and uniformly dispersed ultrafine metallic catalyst from precursor and EG.
Declaration of Competing Interest
The authors declare that they have no known competing financial interests or personal relationships that could have appeared to influence the work reported in this paper.
Acknowledgments
The authors would like to acknowledge financial support from the National Basic Research Program of China(2018YFB1502100).XSY acknowledges the support from the PolyU grant (No.G-YW5N).
Supplementary materials
Supplementary material associated with this article can be found,in the online version,at doi:10.1016/j.jma.2021.12.003.
杂志排行
Journal of Magnesium and Alloys的其它文章
- Corrosion behavior of composite coatings containing hydroxyapatite particles on Mg alloys by plasma electrolytic oxidation: A review
- Rational design,synthesis and prospect of biodegradable magnesium alloy vascular stents
- Antibacterial mechanism with consequent cytotoxicity of different reinforcements in biodegradable magnesium and zinc alloys: A review
- Preparation,interfacial regulation and strengthening of Mg/Al bimetal fabricated by compound casting: A review
- Pitting corrosion behavior and corrosion protection performance of cold sprayed double layered noble barrier coating on magnesium-based alloy in chloride containing solutions
- Designing strategy for corrosion-resistant Mg alloys based on film-free and film-covered models
