QTL mapping and transcriptome analysis identify candidate genes influencing water–nitrogen interaction in maize
2023-12-25KunhuiHeYkunZhngWeiRenPengyunChenJinchoLiuGuohuMiFnjunChenQingchunPn
Kunhui He, Ykun Zhng, Wei Ren, Pengyun Chen, Jincho Liu, Guohu Mi, Fnjun Chen,c,Qingchun Pn,c,*
a State Key Laboratory of Nutrient Use and Management, College of Resources and Environmental Sciences, China Agricultural University, Beijing 100193, China
b College of Agronomy, Northwest A&F University, Yangling 712100, Shaanxi, China
c Sanya Institute of China Agricultural University, Sanya 572000, Hainan, China
Keywords:Quantitative trait loci Water Nitrogen Interaction Maize
ABSTRACT Water and nitrogen fertilization are the key factors limiting maize productivity.The genetic basis of interactions between maize genotype, water, and nitrogen is unclear.A recombinant inbred line (RIL) maize population was evaluated for seven yield and five agronomic traits under four water and nitrogen conditions: water stress and low nitrogen, water stress and high nitrogen, well-watered and low nitrogen,and well-watered and high nitrogen.Respectively eight, six, and six traits varied in response to genotype–water interactions, genotype–nitrogen interactions, and genotype–water–nitrogen interactions.Using a linkage map consisting of 896 single-nucleotide polymorphism markers and multipleenvironmental quantitative-trait locus (QTL) mapping, we identified 31 QTL, including 12 for genotype–water–nitrogen interaction,across the four treatments.A set of 8060 genes were differentially expressed among treatments.Integrating genetic analysis,gene co-expression,and functional annotation revealed two candidate genes controlling genotype–water–nitrogen interactions, affecting both leaf width and grain yield.Genes involved in abscisic acid biosynthesis and bZIP,NAC,and WRKY transcription factors participated in maize response to water and nitrogen conditions.These results represent a step toward understanding the genetic regulatory network of maize that responds to water and nitrogen stress and provide a theoretical basis for the genetic improvement of both water- and nitrogen-use efficiency.
1.Introduction
Maize(Zea mays L.),is used worldwide for food,feed,and industrial applications [1,2].Its wide geographical distribution subjects it to stressful growing conditions,including water stress and nutrient deficiencies[3,4].Because hyper-arid,arid,and semi-arid lands represent approximately one-third of the global land surface [5],water scarcity threatens global maize production [6].
Nitrogen is a component of all nucleic acids and amino acids,and sufficient nitrogen fertilization is critical to maize yield potential [7].Although the annual nitrogen consumption of maize production is increasing [8], only 30%–40% of applied nitrogen fertilizer is absorbed and utilized [9,10].Drought exacerbates this poor utilization, because water is necessary for transporting nutrients from the soil [11,12].Application of nitrogen fertilizer reduces the yield losses caused by drought stress, and sufficient irrigation reduces the impact of low-nitrogen environments to yield[13,14].Because maize tolerance to drought and low nitrogen stress is genotype-dependent[3],an understanding of the effects of the interactions between genotype, water, and nitrogen on maize growth could guide efforts to optimize maize yield during drought and low nitrogen stresses.
Maize genetic improvement is a promising strategy for optimizing water–nitrogen interactions.Although scientists have identified many quantitative-trait loci (QTL) associated with water or nitrogen use [15–18], few studies have been aimed at identifying QTL interacting with water or nitrogen, and more complex QTL interacting with water and nitrogen have rarely been detected.This is due partially to the difficulty in identifying suitable field locations subject to both water and nitrogen deficiency.It is also difficult to evaluate the interactions between genotype and environment using conventional QTL mapping methods.Conventional multi-environment QTL analysis has deficiencies, many of which arise from incomplete datasets.A‘‘multiple environment QTL mapping” method [19] has been developed to solve this problem.This method,based on a three-step process that increases the reliability of QTL, has been widely used to study QTL-environment interactions [20].Using this method, 14 pleiotropic QTL for 13 root traits were identified in maize under well-watered and water-stress conditions [21].QTL–nitrogen interactions of seven key agronomic traits were recently identified in indica rice(Oryza sativa L.indica),and candidate genes associated with nitrogen-use efficiency were identified[22].This method has thus proven effective for QTL analysis of water–nitrogen interactions.
The molecular mechanisms underlying plant responses to water or nitrogen stress have been extensively studied.Analyses of water-stress conditions have consistently identified three major kinds of responsive genes: (1) genes involved in signal transduction and transcriptional regulation (protein kinases, protein phosphatases, and transcription factors); (2) genes involved in protecting cell membranes(late embryogenesis abundant proteins,antioxidants, and osmotin); and (3) genes involved in water and ion transport and absorption (aquaporin and sugar transporters)[23].Similarly, many genes have been shown to be involved in the response to nitrogen stress.Nitrate transporters (NRT) and ammonia transporters (AMT) function in plant nitrogen signaling response and nitrogen transport [24].Overexpression or heterologous expression of some transcription factors, such as ZmDof1,OsRDD1, and AtNLP7, increase plant nitrogen use efficiency[25–27].Genes involved in nitrogen metabolism have also been implicated in plant responses to water deficits [28].The expressions of some nitrogen transporters (AMT1.2, AMT2.4, and NRT1.5)and assimilation genes (GOGAT, GS, and AS) are repressed during drought stress [29,30].The NIN-like protein 7 (NLP7), which regulates genes involved in nitrogen metabolism, conferred tolerance to drought stress in Arabidopsis[31].There was an overlap between genes responsive to drought and those responsive to low-nitrogen stresses in Arabidopsis[32].A study combining omics analysis with genetic mapping may be useful for identifying candidate genes that regulate water-nitrogen interactions in maize.
The purpose of this study was to investigate the genetic basis of genotype–water–nitrogen interactions in maize.A recombinant inbred line(RIL)population planted in a split-split field experiment was subjected to water and nitrogen treatments conducted across two years under arid climate conditions in northwest China.Multiple-environment QTL mapping was combined with transcriptome analysis to identify candidate genes.
2.Materials and methods
2.1.Plant materials
A RIL population consisting of 218 F8lines was derived from a cross between inbred lines Ye478 and Wu312 followed by singleseed descent [15,33].Ye478, developed in Yexian, Shandong province, China during the 1990s, has served as the female parent of more than 50 high-yielding hybrids.It belongs to the Reid hybrid group and is sensitive to nitrogen and water.Wu312,derived from an unknown hybrid, is insensitive to nitrogen.During population development, 35 RILs were removed owing to unintended outcrossing, leaving 183 RILs for QTL mapping.Lines Ye478 and Wu312 were also used for transcriptome analysis.
2.2.Field sites and treatments
Field experiments were performed in northwest China in Wuwei, Gansu province (38°37′N, 102°40′E, 1802 m altitude) during the 2009 and 2010 growing seasons.The experimental station is located in a continental temperate climate zone.The mean annual precipitation of this zone is 164.4 mm, the mean annual evapotranspiration is 2000 mm, the mean annual sunshine duration is over 3000 h, and the mean annual temperature is 8.8 °C.The groundwater level is consistently 40 m below the soil surface[34].The physicochemical properties of the soil at a depth of 0–30 cm are described in Table S1.The site receives little to no rainfall during the maize growing season, with annually 14.3 mm of precipitation in 38.4 rainy days(10.5%of days),allowing control of water treatments.The experiment employed a split-split-plot design with water treatment as one whole plot,nitrogen treatment as a split-plot, and genotype as a split-split plot.Four treatments,T1 (WS-LN), T2 (WS-HN), T3 (WW-LN), and T4 (WW-HN), were applied with one plot used per treatment.Water treatment was set at the well-watered (WW) and water-stress (WS) levels.For the WW treatment, maize plants received sufficient irrigation throughout the entire growth period, whereas for the WS treatment, plants were irrigated only three times at stages V12, R1,and R3.Nitrogen fertilization was applied at the high-nitrogen(HN) and low-nitrogen (LN) levels.Detailed information about the treatments is shown in Table S2.Superphosphate(120 kg ha-1)and potassium sulfate(135 kg ha-1)fertilizers were applied before sowing.For the HN treatments, 391 kg-1ha-1of urea was applied at maize stage V11.In each plot,13 plants of each RIL were planted in a single row 3 m long with 0.5 m between rows.Three replications were used for each treatment.
2.3.Trait measurement
Seven yield and five agronomic traits were evaluated in the parents and RILs in 2009 and 2010.The yield traits were grain yield per plant (GYP, g), 100-kernel weight (HKW, g), stover yield per plant (SYP, g), row number per ear (RNE, number), kernel number per row(KNR,number),ear length(EL,mm),and ear diameter(ED,mm).The agronomic traits were plant height (PH, cm), leaf length(LL, cm), leaf width (LW, cm), leaf area (LA, cm2), and leaf chlorophyll content (CC, unitless).For agronomic trait measurements,three adjacent plants at the silk emergence stage were selected from the middle of each row to avoid margin effects.LA was calculated as LL × LW × 0.75 [35].Leaf CC was measured with a SPAD-502 device (Konica Minolta Sensing Inc., Tokyo, Japan).Measurements were repeated three times on the middle part of each leaf(ear leaf, the first leaf below the ear, and the first leaf above the ear).At maturity, all ears were harvested from each plot, as well as the stover of three representative plants.After air drying, GYP,HKW, and SYP were determined.Five ears were selected to measure RNE, KNR, EL, and ED.
2.4.Statistical analyses


The best linear unbiased prediction (BLUP) value of each trait under the different treatments was calculated using the following linear model: yijk=μ+ρk+αi+βj+αβij+εijk, where yijkis the phenotypic value,μ is the grand mean,ρkis block effect,αiis genotype effect,βjis year effect,αβijis genotype–year interaction effect,and εijkis error.All effects were treated as random, and the BLUP for each genotype was the grand mean added to the estimated random effect of each genotype.The broad-sense heritability (h2B) for each trait was estimated using the following formula:h2B=σ2G/(σ2G+σ2GE/n+σ2e/nr)×100%, where σ2Grepresents genotype variance,σ2GErepresents genotype–year interaction variance, σ2erepresents error variance, n represents number of years,and r represents number of blocks [36].The ‘‘lmer” function of the ‘‘lme4” package (https://cran.r-project.org/web/packages/lme4/index.html) was used to calculate BLUP values and h2B.
The BLUP values of each trait under different treatments were used to perform normality tests, multiple comparisons,and correlation analyses.A normality test was performed using the ‘‘ggplot2” package (https://cran.r-project.org/web/packages/ggplot2/index.html).Multiple comparisons of each trait between treatments were performed using the ‘‘glht” function of the ‘‘multcomp” package (https://cran.r-project.org/web/packages/multcomp/index.html).The phenotypic correlations between traits were simple Pearson’s correlations, which were calculated using the‘‘corr.test”function of the‘‘psych”package(https://cran.r-project.org/web/packages/psych/index.html) and visualized with the‘‘igraph” package (https://cran.r-project.org/web/packages/igraph/index.html).
2.5.Construction of genetic maps
Seeds of the parents and the RILs were sterilized in 10%H2O2for 20 min,washed with distilled water,soaked in saturated CaSO4for 6 h,and germinated in the dark on moist filter paper at room temperature.After two days,germinated seeds were wrapped in moist filter paper rolls and planted in soil until two leaves were visible.Fully expanded leaves were collected and genomic DNA was extracted using the CTAB method[37].The DNA of the two parents and RILs was used for genotyping with the maizeSNP3072 array(National Maize Improvement Center, China Agriculture University) [38].Markers polymorphic between the two parents were identified.Markers with a missing data rate greater than 30% or a minimum allele frequency < 0.25 in the population were excluded with PLINK 2.0 [39].Carthagene was used to construct a linkage map, following previously published procedures[40,41].A minimum LOD (logarithm of odds) value of 3.0 and a maximum distance of 37.2 cM to group markers in linkage groups.The extract-and-input method was used to determine the order of the markers within each linkage group, and the Kosambi function was used to estimate map length.Collinearity was assessed by comparison of the genetic map with the physical map of the B73 reference genome (version 4) (https://www.maizegdb.org/).The linkage map contained 896 markers, with a mean of 90 markers per chromosome.The total length of the map was 2705 cM, with a mean genetic distance of 3.02 cM between adjacent SNPs(Fig.S1A).Recombination rates of chromosomes varied from 1.09(chromosome 3) to 1.63 (chromosome 8) cM Mb-1, with a mean of 1.32 cM Mb-1(Table S3).There was no gap greater than 10 cM, suggesting that the linkage map was suitable for QTL mapping.
2.6.QTL mapping
Based on the linkage map and BLUP trait values under WS-LN(T1), WS-HN (T2), WW-LN (T3), and WW-HN (T4) treatments,GenStat version 19 [19] was used to perform genotypeenvironment QTL mapping.This analysis consisted of four steps.First, the four environments defined by the four treatments and the phenotype BLUP values for each environment were input into the software.The ‘‘maximum size step along genome” parameter was set to 10 cM, the ‘‘minimum cofactor proximity” parameter was set to 50 cM, the ‘‘minimum separation for selected QTLs”parameter was set to 20 cM and the ‘‘genome-wide significance level” parameter was set to 0.05.Next, simple interval mapping(SIM)was performed with the above parameters to identify cofactors showing significant effects on the traits of interest.Composite interval mapping (CIM) was used to map QTL.The cofactors identified by SIM were used in CIM to control genetic background effects.QTL with a P-value less than 0.05 were considered candidate QTL[42,43].Finally,the candidate QTL identified by CIM were placed into a final multi-QTL model for backward selection calculation, which consisted of two key steps: (1) determining which QTL were significant in the model and(2)testing for QTL–environment interactions.The backward selection procedure was stopped when all remaining QTL in the model were significant.Results of the multi-QTL analysis included the position of QTL and the 95%confidence interval, estimated allelic effect, phenotypic variation explained(PVE),and significance level(P value)of each QTL under each treatment [21,44].Major QTL were defined as those with a maximum PVE greater than 10% in each treatment.QTL were named following standard guidelines [45].The confidence intervals of overlapping QTL were classified as QTL clusters.
The QTL detected were classified as genotype–water–nitrogen interaction QTL (GWNIQTL), genotype–water interaction QTL(GWIQTL), genotype–nitrogen interaction QTL (GNIQTL), or stable QTL (SQTL).GWNIQTL were defined as QTL that showed a significant effect only under certain combinations of water and nitrogen conditions.GWIQTL were defined as QTL showed had a significant effect only under well-watered or water-stressed conditions.GNIQTL were defined as QTL that showed a significant effect only under high- or low-nitrogen conditions.SQTL were defined as QTL that showed a significant effect (P < 0.05) under all four treatments.
2.7.Phenotypic determination, RNA extraction, and transcriptome analysis of the two parental inbred lines
Lines Ye478 and Wu312 were grown in a greenhouse at China Agricultural University in 2020 under four conditions (WS-LN,WS-HN, WW-LN, and WW-HN) using soil culture.For nitrogen treatment, the soil was obtained from a long-term nitrogen fertilizer treatment experimental field at the Shangzhuang Experimental Station of China Agricultural University (39°26′N, 116°17′E,53 m altitude).In the experimental field, 391 kg ha-1of urea per hectare was applied annually in the HN treatment,while no nitrogen fertilizer was applied in the LN treatment.Each plant was irrigated every 3 days with 150 mL of water until jointing stage.Afterward, the water treatment began.Plants were irrigated with 250 mL of water every three days in the WW treatment and every six days in the WS treatment.Plant height(PH,cm),ear leaf length(ELL,cm),ear leaf width(ELW,cm),ear leaf area(ELA,cm2),and ear leaf chlorophyll content (ECC, unitless) at silking stage were recorded.Leaves with a length of 4 cm at the middle part of the ear leaf were sampled and frozen in liquid nitrogen for RNA extraction and RNA sequencing (RNA-seq).Samples from two plants were mixed as one biological replicate, and three biological replicates were taken.RNA was extracted using TRIzol reagent (Takara Bio, Shiga, Japan), and RNA purity was assessed with a NanoDrop 1000 spectrophotometer (Thermo Fisher Scientific, Illkirch,France).
Library construction and sequencing were performed by Biomarker Technologies (Beijing, China).Raw data were subjected to quality control using FASTP software [46], and the remaining clean data were aligned to the maize reference genome (B73 RenGen_v4, https://www.maizegdb.org/) with HISAT2 [47].Alignments were filtered to retain concordantly mapped reads using Samtools [48], and read counts per gene were generated for each library using featureCounts [49].Transcripts per million reads(TPM) was used to determine gene expression levels with the RSEM tool[50].Differentially expressed genes(DEGs)were identified with DESeq2 [51] by comparing conditions pairwise (WS-LN versus WW-HN, WS-HN versus WW-HN, WW-LN versus WWHN) using |log2(fold change)| ≥1 and false discovery rate (FDR;Benjamini-Hochberg adjusted P-value) ≤ 0.05.Gene Ontology(GO) enrichment analysis of DEGs was performed with agriGO(https://systemsbiology.cau.edu.cn/agriGOv2/).Kyoto Encyclopedia of Genes and Genomes (KEGG) enrichment analysis of DEGs was performed with the clusterProfiler package in R [52].Gene annotation information was obtained from MaizeGDB (https://www.maizegdb.org).
2.8.Co-expression network construction and visualization
Co-expression networks were constructed using TPM values and the weighted gene co-expression network analysis (WGCNA)package in R [53].A set of 8060 DEGs were used to generate an adjacency matrix.The soft threshold was set to power = 11.The modules were identified by the blockwiseModules function with minModuleSize = 30 and mergeCutHeight = 0.25.The module eigengene (ME) value for each module was calculated using the moduleEigengenes function and used to test the association with the phenotype.The KME value (eigengene-based connectivity)was obtained using the signedKME function based on TPM and ME values of each module.The final co-expression networks were visualized with Cytoscape v3.9.1 (https://cytoscape.org/).
2.9.Determination of ABA concentration
A 100-mg freeze-dried and powdered leaf sample at silking stage was digested in 1 mL of precooled 70%–80% methanol solution at 4 °C overnight.The digests were centrifuged at 12,000×g for 10 min at 4 °C.The residue was digested with 0.5 mL of 70%–80%methanol at 4°C for 2 h and then centrifuged.The supernatant was evaporated under reduced pressure at 40°C to one-third of the original volume, and an equal volume of petroleum ether was added.The sample was allowed to stand for stratification, after which it was repeatedly extracted and decolorized.Triethylamine was added to adjust the pH to 8.0, and crosslinked polyvinylpyrrolidone (PVPP) was added, followed by incubation with shaking for 20 min.The sample was centrifuged at 12,000×g and the supernatant was retained.The pH of the supernatant was adjusted to 3.0 with hydrochloric acid, extracted with ethyl acetate three times, and combined with the ester phases.Finally, the mixture was evaporated to dryness under reduced pressure at 40 °C, and the mobile-phase solution was added with vortex oscillation.The dissolved solution was used for ABA concentration determination using liquid chromatography.The experiment was conducted using an LC-100 liquid chromatography system with a C18 reverse-phase chromatographic column(Shanghai Wufeng Scientific Instrument Co., Ltd., Shanghai, China).The mobile phases A and B consisted of 100% methanol and a 0.1%aqueous solution of acetic acid, respectively, with a ratio of A to B set at 55:45.The injection volume was 20 μL, the flow rate was 0.8 mL min-1, the column temperature was maintained at 30°C,and detection was performed at a UV wavelength of 254 nm.
2.10.Asparagine measurement
The free asparagine (Asn) content of leaf samples at silking stage was measured using an Asn content kit (Grace; Suzhou,Jiangsu, China).Briefly, asparagine was decomposed into aspartic acid and NH4+with asparaginase.Glutamate dehydrogenase was added to catalyze the reaction of NH4+with α-ketoglutaric acid,resulting in NADH oxidation.The content of asparagine was calculated by detecting the decrease of NADH, as evidenced by a decrease in absorption at a wavelength of 340 nm.Each sample was quantified three times.
2.11.Subcellular localization
The coding DNA sequences (CDS) of two candidate genes identified from the integrated QTL and transcriptomic experiments(Zm00001d011117 and Zm00001d026632) were amplified and ligated into the BsaI site of the pBWA(V)HS-Glosgfp vector.After sequencing, the plasmids and empty vectors were infiltrated into the protoplasts of 10-day-old maize leaves[54].After 24 h of incubation in darkness at 28 °C, GFP signal (excitation at 488 nm and emission at 510 nm) and chlorophyll fluorescence signal (excitation at 640 nm and emission at 675 nm) were observed under a confocal laser scanning microscope (Nikon C2-ER, Tokyo, Japan).
2.12.Yeast two-hybrid assays
Yeast two-hybrid assays were performed to detect interactions between drought and low-nitrogen-responsive proteins and water–nitrogen interaction-responsive proteins with the ProQuest two-hybrid system(Invitrogen,Waltham,MA,USA).The bait plasmids pGBKT7 (BD) and prey plasmids pGADT7 (AD) were constructed by inserting the full lengths of genes ZmTGA(Zm00001d022542, AD) and ZmPP2CA (Zm00001d005609, BD),respectively.The constructed pairs were co-transformed into yeast strain AH109 and selected on double dropout plates(SD-Trp/-Leu).Interactions between proteins were detected based on the ability of the hybridized yeast to grow on triple dropout (SD-Trp/-Leu/His) medium supplemented with X-α-Gal.
3.Results
3.1.Responses of plant traits to water and nitrogen treatments

Fig.1.Experimental design and phenotypic differences of the RIL population under different water and nitrogen treatments.(A) Model of the experimental design and phenotypes of whole plants.(B)Differences in agronomic traits and yield of the RIL populations among water and nitrogen treatments.WS-LN,WS-HN,WW-LN,and WW-HN represent water-stressed low-nitrogen, water-stressed high-nitrogen, well-watered low-nitrogen, and well-watered high-nitrogen treatments, respectively.The shade of green on each leaf represents the chlorophyll content.Trait abbreviations: EL, ear length; LL, leaf length; LW, leaf width; and PH, plant height.
The phenotypic variation in the RIL population is described in Fig.1.Most yield and agronomic traits differed among genotypes and among water and nitrogen conditions, and all traits showed changes between years (Table S4).Traits GYP, HKW, SYP, ED, PH,LL, LW and LA differed (P < 0.001) under the water and nitrogen conditions.CC showed no change among water treatments but differed (P < 0.001) among nitrogen treatments.KNR, RNE, and EL showed no change among nitrogen treatments but differed(P < 0.05) among water treatments.
Genotype–water and genotype–nitrogen interactions were observed for all traits, except RNE (Table S4).The genotype–wate r–nitrogen interactions were not significant for HKW, RNE, EL,ED, PH, LL and LW (Table S4).RNE and EL differed significantly under different water treatments, but did not show any genotype–water–nitrogen interaction.GYP, SYP KNR, LA and CC,which showed changes under genotype–water and genotype–nitrogen interactions,were associated(P<0.05)with genotype–nitro gen–water interactions.
3.2.Phenotypic variance and heritability
All traits but CC showed significant differences between Ye478 and Wu312 under at least one treatment in one year (Table S5).The coefficients of variation (CV) of the 12 traits ranged from 2.7% to 16.2% (Table S5).The total yield and agronomic trait variance were higher under LN than HN and under WS than WW.Water and nitrogen inputs increased the phenotypic values of all yield and agronomic traits but EL (0.2% to 32.5%; P < 0.05;Fig.S2; Table S5).Compared to WS-LN, the phenotypic values of all traits increased by respectively 0.2% to 6.9%, 0.8% to 24.0%,and 2.2%to 32.5%under WS-HN,WW-LN and WW-HN conditions.Compared to WS-LN, the increases in GYP (5.6% to 19.5%), SYP(6.9% to 32.5%), and LA (6.4% to 31.4%) were much higher than those in the other traits under the water, nitrogen, and water–nitrogen treatments.
Under all four treatments, GYP was positively correlated with the other traits (P < 0.05), except for RNE and CC.GYP showed the highest positive correlation with KNR (r = 0.45 to 0.57;P < 0.001).SYP was positively correlated with PH (r = 0.44 to 0.51; P < 0.001), LL (r = 0.33 to 0.46; P < 0.001), and LA (r = 0.39 to 0.50; P < 0.001).There was a moderately positive correlation between PH, LL, and LA (r = 0.38 to 0.70; P < 0.001; Fig.S3;Table S6).The h2Bof each trait under each treatment ranged from 74.6 to 95.6 (Table S5).The relatively high heritability and lack of significant differences in heritability under the four treatments indicate that responses to water and nitrogen stresses are influenced by maize genetic factors.
3.3.QTL mapping of water–nitrogen interactions
QTL mapping identified 31 QTL (12 with interactions and 19 stable with no interactions) for the 12 traits under the WS-LN,WS-HN, WW-LN, and WW-HN treatments (Fig.2; Table S7).Among the 31 QTL, 12 environmental interactions were detected for four yield traits(GYP,HKW,KNR,and RNE)and four agronomic traits (PH, LL, LW, and CC).Three QTL were identified under three different treatments,six QTL under two treatments,and three QTL under only the WW-HN condition.The qLW4.1 QTL had the highest-log10(P)(5.07)and explained 5.3%–8.3%of the phenotypic variation detected under three treatments, whereas qKNR9.1 had the highest -log10(P) (6.24) and explained up to 9.5% of the phenotypic variation of KNR detected under two treatments.A large proportion of the 19 QTL, which were common to four treatments,were determined to be stable QTL (Fig.2; Table S7).For example,two QTL (qGYP2.1 and qHKW3.1) for yield traits had high -log10(P) (7.12 and 4.71) and explained respectively 4.5% to 12.5% and 6.5% to 10.4% of the phenotypic variation in GYP and HKW.The major agronomic trait QTL qLA7.1 explained 8.6% to 13.6% of the phenotypic variation in LA (Table S7).
The QTL identified were classified into four categories based on their responses during water and nitrogen stress: 7 GWNIQTL, 2 GWIQTL, 3 GNIQTL, and 19 SQTL (Fig.S4; Table S8).GWNIQTL,which were influenced by water and nitrogen stresses, were further classified into three types.The first type showed a significant effect only under conditions of water and nitrogen deficiency,whereas the second type showed a significant effect only under sufficient water and nitrogen,and the third type showed a complement of water and nitrogen.GWIQTL showed genetic effects under water-stressed or well-watered conditions and GNIQTL showed genetic effects under low or high nitrogen conditions.QTL with overlapping confidence intervals were classified into nine clusters.Custer 1.1 contained four QTL for yield traits (GYP and KNR) and leaf size-related traits (LL and LA).Clusters 2.1, 8.1, and 9.1 contained QTL associated with leaf size traits (LW, LA, LL, LW, LL,and LA), whereas clusters 3.1 and 6.1 contained QTL for yieldrelated traits (HKW, KNR and SYP) (Fig.2).

Fig.2.Heat map showing genomic regions of the 31 QTL detected for 12 traits.Columns indicate the physical position on the 10 chromosomes,ascending from left to right.The –log10P of each QTL is indicated by the color scale.QTL with significant QTL × environmental effects are labeled with asterisks.Green transparent rectangles represent QTL clusters.Trait abbreviations:GYP,grain yield per plant;HKW,100-kernal weight;SYP,stover yield per plant;KNR,kernel number per row;RNE,row number per ear;EL,ear length; ED, ear diameter; PH, plant height; LL, leaf length; LW, leaf width; LA, leaf area; and SPAD, chlorophyll content.T1, T2, T3, and T4 represent water-stressed and low-nitrogen (WS-LN), water-stressed and high-nitrogen (WS-HN), well-watered and low-nitrogen (WW-LN), and well-watered and high-nitrogen (WW-HN) treatments,respectively.
3.4.DEGs in ear leaves of the parental lines
The parental lines showed differing transcript abundances under all conditions surveyed (Fig.S5).Comparisons of WS-HN and WW-HN, WS-LN and WW-HN, and WW-LN and WW-HN revealed respectively 2373, 1825, and 3318 DEGs in Ye478 and 1908, 2282, and 3106 DEGs in Wu312 (Fig.3A, B; Table S9).DEGs common to the WS-HN vs.WW-HN and WS-LN vs.WW-HN groups were considered to be water-responsive genes, whereas DEGs common to WW-LN vs.WW-HN and WS-LN vs.WW-HN groups were considered to be nitrogen-responsive genes.DEGs that were common to both water and nitrogen comparisons were considered to be water–nitrogen interaction-responsive genes.This analysis revealed 186, 903, and 384 genes in Ye478 and 639, 492, and 325 genes in Wu312 responding respectively to water, nitrogen,and water–nitrogen interactions (Fig.3C).Sets of respectively 20,79, and 38 genes responding to water, nitrogen, and water–nitrogen interactions were identified in both Ye478 and Wu312(Fig.3D).
The DEGs identified after comparing different conditions of Ye478 and Wu312 were found to be involved in multiple biological processes,including protein metabolic process(GO:0019538),lipid metabolic process (GO:0006629), oxidation–reduction process(GO:0055114), transmembrane transport (GO:0055085), and nitrogen compound metabolic process (GO:0006807), all of which have roles in water and nitrogen responses.Among the nitrogenresponsive DEGs identified in both Ye478 and Wu312, 59 had GO annotations,15 of which were associated with nitrogen compound metabolism.Thirteen water-responsive DEGs were associated with organic substance metabolism.Among the 38 water–nitrogen interaction-responsive DEGs, 11 macromolecule metabolismassociated genes were identified(Fig.S6;Table S10).KEGG analysis of the DEGs identified pathways that were enriched in the water and nitrogen-responsive DEGs, including plant hormone signal transduction, nitrogen metabolism, MAPK signaling pathway, and benzoxazinoid biosynthesis (Fig.S7).
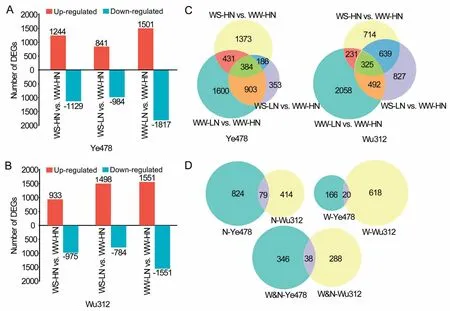
Fig.3.Differentially expressed genes(DEGs)among water(W)and nitrogen(N)treatments of the two inbred lines.(A)Number of DEGs in Ye478 under different treatments.(B)Number of DEGs in Wu312 under different treatments.WS-LN,WS-HN,WW-LN,and WW-HN represent water-stressed low-nitrogen,water-stressed high-nitrogen,wellwatered low-nitrogen, and well-watered high-nitrogen treatments, respectively.(C) Number of DEGs responding to water, nitrogen, and water–nitrogen interactions in Ye478 and Wu312.Common DEGs in‘‘WS-HN vs.WW-HN”and‘‘WS-LN vs.WW-HN”groups were considered as water-responsive genes,whereas common DEGs in‘‘WW-LN vs.WW-HN”and ‘‘WS-LN vs.WW-HN”groups were considered as nitrogen-responsive genes, and common DEGs among the three comparisons were considered as water–nitrogen interaction-responsive genes.(D) Number of DEGs responding to water, nitrogen, and water–nitrogen interaction in Ye478 and Wu312.
3.5.Co-expression network analysis identified water- and nitrogenresponsive genes
WGCNA revealed 19 co-expression gene modules containing 8060 genes(Fig.S8).Module-line correlation analysis revealed four modules(brown,green,magenta,and pink)that were significantly associated with the two parental lines.The ‘‘brown” and ‘‘green”modules were positively correlated with Wu312 (r = 0.78, P = 6E-6; r = 0.85, P = 1E-7) (Fig.4A), and the majority of the genes they contained were expressed more highly in Wu312 than in Ye478(Fig.4B).The genes in the ‘‘brown” module were involved mainly in metabolic processes, whereas the genes in the ‘‘green” module were involved mainly in cell and metabolism (Table S11).By contrast,the‘‘magenta”and‘‘pink”modules were positively correlated with Ye478 (r = 0.79, P = 5E-6; r = 0.97, P = 2E-14) (Fig.4A).The genes in the‘‘magenta”module were enriched in carbohydrate catabolism and metabolic pathways, whereas the genes in the ‘‘pink”module were enriched in phosphorylation and small molecule and lipid biosynthesis (Table S11).Module-trait correlation analysis indicated that the ‘‘cyan” and ‘‘purple” modules were positively associated with LW and LL in both the field and the greenhouse.The ‘‘magenta” and ‘‘pink” modules were positively associated with LL in both the field and the greenhouse but were positively associated with LW only in the field.The‘‘black”module was positively associated with ECC(Fig.4A)and contained genes that were more highly expressed under HN treatments than LN treatments in both Wu312 and Ye478 (Fig.4B).This module was enriched in metabolic processes associated with small molecules and cellular amino acids (Table S11).
For gene correlation network construction, the ten genes with highest KME value were selected as hub genes (Table S12).In the‘‘black” module, the hub gene with the highest value encoded HAD-superfamily hydrolase (Zm00001d031705).Other hub genes in this module included glycosyltransferase-like KOBITO 1(ZmKOB1/ABI8, Zm00001d039284), urea-proton symporter DUR3(Zm00001d037242), and APx4-peroxisomal ascorbate peroxidase(ZmAPX4, Zm00001d053223) (Fig.4C).For the ten hub genes in the ‘‘purple” module, there were two amino acid transportassociated genes, ZmAAP6 (Zm00001d012231) and ZmAVT6(Zm00001d012485).A phosphate transporter (ZmPHO1,Zm00001d037468) and a sulfate transporter (ZmSULTR2;1,Zm00001d028164) were also strongly connected with other genes in the ‘‘purple” module.One glutamine exporter (ZmGDU4,Zm00001d053729) and one CBL-interacting protein kinase(ZmCIPK10, Zm00001d023353) were associated with water and nitrogen interactions (Fig.4D).Three of the ten hub genes in the‘‘cyan”module were annotated as transcription factors:ZmbHLH66(Zm00001d052038), MYB-SHAQKYF (Zm00001d007962), and AThook with a DUF296 domain (ZmAHL10, Zm00001d020951).Hub genes encoding tetratricopeptide repeat (TPR)-like superfamily protein (Zm00001d013919), aspartyl protease (Zm00001d022390),and pathogenesis-related thaumatin-like protein(Zm00001d006054) were highly associated with water- and nitrogen-responsive genes (Fig.4D).These hub genes interacted with other genes in the module to jointly regulate the response of maize plants to water and nitrogen treatments.

Fig.4.Weighted gene co-expression network analysis (WGCNA) of DEGs responding to water and nitrogen treatments.(A) Module–line and module–trait correlation analysis.The left panel shows the 19 modules built by the WGCNA analysis.The color scale on the right shows correlations from-1(blue)to 1(red).Abbreviations:and GYP,grain yield per plant; PH, plant height; LL, leaf length; LW, leaf width; CC, leaf chlorophyll content; ELL, ear leaf length, ELW, ear leaf width; and ECC, ear leaf chlorophyll content.The‘‘field”label indicates that the phenotypic data were derived from field trials,and the‘‘greenhouse”label indicates that the phenotypic data were derived from pot experiments in a greenhouse.(B)Heat maps of the expression patterns of the co-expressed genes in‘‘brown”,‘‘green”,‘‘magenta”,‘‘pink”,‘‘purple”,and‘‘black”modules.(C) Gene correlation network of the ‘‘black”module.(D) Gene correlation network of the ‘‘purple” module.(E) Gene correlation network of the ‘‘cyan” module.Node size is proportional to the |KME|, and node color is proportional to the degree of correlation with other genes.Hub genes for each module are labeled.
3.6.Identification of candidate genes for water and nitrogen response from the QTL intervals
For the interaction QTL, 74 candidate genes were identified from nine QTL: 53 genes for GWNIQTL, 20 genes for GWIQTL,and one gene for a GNIQTL (Fig.5A, B; Table S8).Among these genes, respectively four, five, and 10 genes were also identified as nitrogen-responsive, water-responsive, and water-nitrogen interaction-responsive genes.In total, 18 candidate genes were identified in both QTL mapping and transcriptome analysis(Fig.5B; Table S8).These genes were distributed in 10 coexpression modules, with the ‘‘turquoise” module containing the most genes (Fig.5A, B;Table S8).From gene function annotations,a gene encoding ABA 8’-hydroxylase (ZmABA8ox,Zm00001d011117) and another encoding asparagine synthetase(ASN) (ZmASN, Zm00001d026632) were predicted to be critical for water–nitrogen interactions (Fig.5C).
The concentration of ABA was negatively correlated with the expression of ZmABA8ox (Fig.5C).Subcellular localization showed that this protein was present mainly in granular organelles,which likely includes mitochondria, peroxisomes, and Golgi apparatuses,with a small amount in endoplasmic reticula(Fig.S9A).Asparagine content was positively correlated with ZmASN expression(Fig.5C).Subcellular localization of this protein showed that it was located mainly in the nucleus and cytoplasm (Fig.S9B).LW and GYP showed positive correlations with the contents of ABA and asparagine, respectively (Fig.5D).
ZmABA8ox was found to be sensitive to water treatment,whereas ZmASN was sensitive to both water and nitrogen(Fig.5E).The expression of ZmABA8ox was significantly higher in Wu312 than in Ye478.ZmASN, in contrast, was expressed at a higher level in Ye478 than in Wu312(Fig.5F).Sequence alignment of candidate genes in the parental lines (Fig.5G) suggested that these expression differences were due to variation in promoter regions.
4.Discussion
4.1.Effects of water and nitrogen interactions on maize growth and yield traits
Water deficiency reduces leaf area, plant height, shoot growth,and grain yield[55,56].Nitrogen deprivation also reduces leaf area,plant height, chlorophyll content, and grain yield [15,57].Water deficiency combined with nitrogen deficiency led to severe reductions in total biomass,leaf area index,plant height,shoot mass,and ear weight [4].The finding in this study that increased water and nitrogen increase LA was consistent with a previous finding.Some studies [58,59] have shown that nitrogen application can reduce yield loss under moderately dry conditions.This effect may be caused by high nitrogen delaying plant responses to water scarcity.High nitrogen also promotes additional shoot and root growth,which can further inhibit drought stress responses [60,61].These findings indicate that the interactions between water and nitrogen affect plant development through complex mechanisms that require additional investigation.

Fig.5.Identification of the candidate genes responding to water and nitrogen.(A)QTL regions related to leaf width(LW),kernel number per row(KNR),plant height(PH),leaf chlorophyll content(CC),100-kernel weight(HKW),and grain yield per plant(GYP)under different water and nitrogen treatments.(B)Process of determining QTL candidate genes by combining QTL mapping, differential gene expression analysis,co-expression networks,and gene functional annotation.(C)Correlation between the expression of candidate genes (TPM, transcripts per million) and the concentration of ABA and asparagine.(D) Correlation between the concentration of ABA and asparagine and the phenotypic traits LW and GYP,respectively.Correlation coefficient r and corresponding P-value are indicated.(E)Comparison of expression levels(TPM)of candidate genes under water and nitrogen treatments.WS, WW, LN, and HN represent water-stressed, well-watered, low-nitrogen, and high-nitrogen treatments, respectively.(F)Comparison of expression levels (TPM) of candidate genes in two parental lines.(G) Sequence alignment of candidate genes in the two parental lines.
Previous study [4] has found that the negative effects of water deficiency on total biomass and yield could be partially compensated by increasing nitrogen,whereas the negative effects of nitrogen stress could be partially overcome by increasing irrigation.This finding was further confirmed by our analysis of yield traits.GYP was affected by genotype–water, genotype–nitrogen, and genotype–water–nitrogen interactions, with the highest values found under well-watered conditions with sufficient nitrogen.Sufficient water and nitrogen increased yield and growth traits,although the effect of water was greater than that of nitrogen.
4.2.Genetic basis of the effect of water–nitrogen interactions on growth and yield performance
Thus far, few studies have investigated the underlying genetic basis of interactions between genotypes and environmental stress.In this study, most traits showed significant genotype–water,genotype–nitrogen, and genotype–water–nitrogen interaction effects, suggesting that complex genetic regulatory events occur under water and nitrogen treatments.In previous studies [21,62],QTL–environment interactions were often expressed strongly in one environment but weakly in another,and QTL could even show opposite effects in different environments.Differences in QTL appearing under stressed and unstressed conditions have been reported, with a few QTL found consistently in both[15,18,63,64].However, many QTL show no interaction with environment[21,44,62,63].In this study,31 QTL were identified for 12 traits across four treatments.Among them, 12 QTL were detected with significant QTL–environment interactions: four yield traits(GYP, HKW, KNR, and RNE) and four agronomic traits (PH, LL,LW, and CC).Some of these QTL are inconsistent with previous findings [65,66], possibly because we estimated the genetic effect of complex interactions between two different treatments, as opposed to previous efforts that focused on one condition at a time.This complex two-factor genetic analysis of water and nitrogen treatment represents a novel approach,although we did find some QTL that were co-located with those previously reported in single environments.qGYP2.1 was close to the QTL for HKW identified in a Mc × V671 population, which explained up to 12.3% of the phenotypic variation.qHKW3.1 was close to the QTL for HKW detected in 8984 × GY220 and 8622 × GY220 populations [67,68].These two QTL were identified in different genetic populations, and thus may be valuable references for marker-assisted selection and QTL fine-mapping.
The QTL identified in this study were divided into GWNIQTL,GWIQTL, and GNIQTL.The presence of some QTL under specific conditions indicates that they are associated with drought and low-nitrogen tolerance [69].qLW8.1 is GWNIQTL, and a candidate gene(ZmABA8ox,Zm00001d011117)of the cytochrome P450 family was identified as a water–nitrogen interaction DEG in Ye478.We verified the negative correlation between the expression of this gene and ABA content and the positive correlation between ABA content and LW.The gene expression level of Zm00001d051554,which also encodes an abscisic acid 8′-hydroxylase (ABAox), was negatively associated with plant drought tolerance [70].In our water–nitrogen interaction analysis,the GYP phenotype was influenced by genotype–water interactions,genotype–nitrogen interactions, and genotype–water–nitrogen interactions.qGYP10.1 is GWNIQTL,and an uncharacterized protein(Zm00001d026632)with a conserved glutamine amidotransferases class-II domain was also identified as a water–nitrogen interaction DEG in Wu312.The function of this gene is unknown,but its expression was positively correlated with Asn content, which was positively correlated with GYP.
By combining phenotypic data,QTL-mapping,and gene expression analysis, we investigated the interactions between genotype,water, and nitrogen and correlated these interactions with DEGs.Our study provides a theoretical basis for identifying genetic interactions between traits and environments.However, the specific regulatory mechanisms underlying these phenotypes await further investigation.The environmental interaction QTL identified in this study not only advance our understanding of the genetic basis of genotype–water, genotype–nitrogen, and genotype–water–nitro gen interactions but also provide an opportunity for use in breeding efforts aimed at increasing stress tolerance and yield.
4.3.Genes involved in nitrogen and ABA metabolism are involved in the responses of maize to water and nitrogen treatments
The molecular processes associated with water and nitrogen responses are coupled with each other, but to date no synergistic pathways have been fully elucidated.Under LN stress, water supply affected the expression of genes involved in nitrogen metabolism.Compared to WS-LN, many genes involved in nitrogen transport and assimilation were highly expressed under WW-LN,although different expression patterns were observed in Ye478 and Wu312.ZmNR2 was more highly expressed in Wu312,whereas ZmNR4 was more highly expressed in Ye478.GS expression increased in Ye478 after supplying water, but not in Wu312.These findings indicate that the two genotypes have different response mechanisms to water supply under LN conditions,possibly owing to differences in the root systems of these two inbred lines[71].In keeping with our results,genes responsible for nitrogen transport and assimilation were repressed at the transcriptional level under drought stress in other crops [72].Under WS,GS activity was decreased in both wheat and rice, and GS gene expression is regulated differently in different plant varieties[29,30].The expression of a nitrogen metabolism-associated transcription factor (ZmNLP13) was upregulated with water supply only in Wu312.In Arabidopsis thaliana, NLP7 functions in drought resistance by regulating stomatal movement [31], but this finding has not been reported in maize.More DEGs were identified in Wu312 under various water conditions, possibly owing to differences in water-use efficiency of the two inbred lines.
Under WS,nitrogen treatment greatly affected the expression of genes involved in ABA metabolism.ZmAPX4 was a hub gene in the‘‘black” module, which was activated by ZmMYB-CC10, thereby reducing H2O2content and increasing maize drought tolerance[5].These two genes were both upregulated under water stress when nitrogen was applied.ZmAVT6 was a hub gene in the ‘‘purple” module that was induced by water and nitrogen deficiency and is involved in uptake of aspartic acid [73].ZmAVT6 can link ABA with nitrogen metabolism, and thus may function in water and nitrogen interactions.ZmCIPK10 was another hub gene in the‘‘purple” module that was highly expressed under drought stress[74].This gene was also upregulated after nitrogen treatment under water stress in our study.Protein phosphatase 2Cs (PP2Cs),one of the core components of the ABA signaling pathway, negatively regulated plant drought responses[75].With nitrogen application, genes encoding PP2Cs were upregulated in Ye478, but downregulated in Wu312.Thus,nitrogen application may increase drought tolerance in Wu312 more than in Ye478.Pyrabactin resistance 1-like protein(PYL)can bind to PP2C and competitively inhibit its phosphatase activity [76–78].The interaction of PAL and PP2C in maize has also been demonstrated[79,80].To further verify our model of water–nitrogen interactions,we conducted molecular experiments to verify two of the interactions.Using yeast twohybrid assays, we identified a new interaction between ZmPP2C7(Zm00001d005609)and ZmPYL13(Zm00001d012475),which sheds light on the role of ABA signaling during drought stress.These results demonstrate the reliability of our model of the interactions between water and nitrogen.ZmbZIP, ZmNAC, and ZmWRKY are transcription factors involved in drought tolerance [81–83].However, their expression trends were inconsistent in our study, indicating that their regulatory mechanisms during drought stress require more study.
The combination of nitrogen and water influences plant traits,but the genetic regulation of nitrogen and water uptake individually and the interactions between them are complex.Our work has implication for the scientific understanding of water and nitrogen stress as well as practical applications aimed at breeding more tolerant maize inbred lines.
CRediT authorship contribution statement
Kunhui He:Formal analysis, Investigation, Visualization,Writing–original draft,Writing–review&editing.Yakun Zhang:Formal analysis, Investigation, Visualization, Writing – original draft, Writing – review & editing.Wei Ren:Formal analysis.Pengyun Chen:Formal analysis.Jianchao Liu:Investigation.Guohua Mi:Resources.Fanjun Chen:Supervision, Funding acquisition.Qingchun Pan:Investigation, Writing – original draft, Writing –review & editing, Supervision, Funding acquisition.
Declaration of competing interest
The authors declare that they have no known competing financial interests or personal relationships that could have appeared to influence the work reported in this paper.
Acknowledgments
We gratefully acknowledge the farming work by students and temporary workers.We thank all those who helped with sample collection and processing.We thank associate professor Ying Liu of Nanjing Agricultural University for his critical reading of the manuscript.This study was financially supported by the National Key Research and Development Program of China(2021YFD1200700), the National Natural Science Foundation of China (32272076), the Hainan Provincial Science and Technology Plan Sanya Yazhou Bay Science and Technology City Joint Project(320LH011),and the Inner Mongolia Foundation for the Conversion of Scientific and Technological Achievements (2021CG0026).
Appendix A.Supplementary data
Supplementary data for this article can be found online at https://doi.org/10.1016/j.cj.2023.09.001.
杂志排行

The Crop Journal的其它文章
- OsSPL10 controls trichome development by interacting with OsWOX3B at both transcription and protein levels in rice (Oryza sativa L.)
- Ectopic expression of OsNF-YA8, an endosperm-specific nuclear factor Y transcription-factor gene, causes vegetative and reproductive development defects in rice
- Mechanisms of autophagy function and regulation in plant growth,development, and response to abiotic stress
- ZmDRR206 functions in maintaining cell wall integrity during maize seedling growth and defense response to external stresses
- The plasmodesmata-associated β-1,3-glucanase gene GhPdBG regulates fiber development in cotton
- The MabHLH11 transcription factor interacting with MaMYB4 acts additively in increasing plant scopolin biosynthesis