Multiomic investigation of Sugarcane mosaic virus resistance in sugarcane
2023-12-25RiroJosGonzgPimentAlexnreHilAonoRoertoCrlosVillvienioBurnoMrelFernnoSilvIvnAntnioosAnjosMrosGuimresAnreLnellMrosCesrGonlvesLuinRossiniPintoAnetePereirSouz
Riro José Gonzg Piment, Alexnre Hil Aono, Roerto Crlos Villvienio Burno,Mrel Fernno Silv, Ivn Antônio os Anjos, Mros Guimrães e Anre Lnell,Mros Cesr Gonçlves, Luin Rossini Pinto, Anete Pereir e Souz,e,*
a Centre for Molecular Biology and Genetic Engineering, University of Campinas, Campinas, Brazil
b Gustavo Galindo Velasco Campus, Littoral Polytechnic Superior School, Guayaquil, Ecuador
c Advanced Centre for Technological Research in Sugarcane Agribusiness, Agronomic Institute of Campinas, Ribeirão Preto, Brazil
d Plant Protection Research Centre, Biological Institute, São Paulo, Brazil
e Department of Plant Biology, Institute of Biology, University of Campinas, Campinas, Brazil
Keywords:Saccharum SCMV GWAS Machine learning RNA-Seq
ABSTRACT Sugarcane mosaic virus (SCMV) is the main etiological agent of sugarcane mosaic disease, which affects sugarcane and other grass crops.Despite the extensive characterization of quantitative trait loci controlling resistance to SCMV in maize,the genetic basis of this trait in sugarcane is largely unexplored.Here,a genome-wide association study was performed and machine learning coupled with feature selection was used for genomic prediction of resistance to SCMV in a diverse sugarcane panel.Nine single-nucleotide polymorphisms(SNPs)explained up to 29.9%of the observed phenotypic variance and a 73-SNP set predicted resistance with high accuracy,precision,recall,and F1 scores(the harmonic mean of precision and recall).Both marker sets were validated in additional sugarcane genotypes, in which the SNPs explained up to 23.6% of the phenotypic variation and predicted resistance with a maximum accuracy of 69.1%.Synteny analyses suggested that the gene responsible for the majority of SCMV resistance in maize is absent in sugarcane, explaining why this major resistance source has not been identified in this crop.Finally, using sugarcane RNA-Seq data, markers associated with resistance to SCMV were annotated,and a gene coexpression network was constructed to identify the predicted biological processes involved in resistance.This network allowed the identification of candidate resistance genes and confirmed the involvement of stress responses, photosynthesis, and the regulation of transcription and translation in resistance to SCMV.These results provide a practical marker-assisted breeding approach for sugarcane and identify target genes for future studies of SCMV resistance.
1.Introduction
Sugarcane (Saccharum spp.) is cultivated in tropical regions worldwide as not only a leading sugar-producing crop but a source of renewable energy obtained from its juice and bagasse[1].Brazil,for many years the leader in the global cultivation of sugarcane,currently grows approximately 40%of global production[2].However,sugarcane yield is threatened by several diseases,with sugarcane mosaic one of the most damaging globally [3].In addition to the characteristic mosaic pattern displayed on leaves,other symptoms of the disease include dwarfing, striping and streaking of culms, and shortening of internodes in highly susceptible genotypes [4].In Brazil, the disease emerged at the beginning of the 20th century,incurring massive yield losses and driving the sugarcane industry to the brink of collapse in 1920–1930.Damage caused by sugarcane mosaic disease has since been controlled via the use of resistant cultivars and the adoption of practices such as the planting of healthy setts and roguing of nurseries and commercial fields.However, the disease is still a threat to sugarcane production, and resistance to sugarcane mosaic is a primary concern in breeding programs [5].
Three viruses of the Potyviridae family are currently recognized as etiological agents of the disease in sugarcane: Sugarcane mosaic virus (SCMV), Sorghum mosaic virus, and Sugarcane streak mosaic virus [6].SCMV, belonging to the Potyvirus genus, is a widespread species and is the only one of the three found to infect sugarcane naturally in Brazil[4,7,8].SCMV has been reported to cause sugarcane yield losses of over 50% [9] and to reduce juice quality [10],sett germination, and plant photosynthetic activity [4,11].High yield losses arising from infection by the virus have led to the discontinuation of several sugarcane cultivars [12].
SCMV also infects many other closely related Poaceae species,including maize (Zea mays), where it causes large yield losses,especially in Europe and China [13].Quantitative-trait locus(QTL) mapping studies have identified two major and three minor QTL controlling resistance to SCMV in maize.Together, the two major loci, Scmv1 and Scmv2, usually explain up to 60%–70% of the phenotypic variance observed for resistance[14–16].Recently,researchers have fine-mapped these QTL and identified the causal genes underlying resistance [17,18].
However, in sugarcane, data on resistance to SCMV are scarce.Three marker–trait association studies targeting SCMV resistance in the crop have been conducted [19–21], but two included very few(≤50)genotypes and all employed dominantly scored markers.This apparent disparity between the information on SCMV resistance available for sugarcane and maize can be partially explained by the greater economic importance of the latter species in several countries, but the genomic complexity of sugarcane is also to blame.Modern cultivars are derived from only a few crosses between two highly autopolyploid species, S.spontaneum(2n = 5x = 40 to 16x = 128; x = 8) [22] and S.officinarum(2n = 8x = 80; x = 10) [23].These hybrids have large [23], highly polyploid [24], aneuploid [25] and duplicated [26] genomes, characteristics that hinder sugarcane breeding research.Most sugarcane traits are controlled by many small-effect loci [27–29].However, given the presence of Scmv1 and Scmv2 in maize, it is unexpected that no major loci controlling SCMV resistance in sugarcane have been identified.
In view of the crop’s complex genome and the damage by SCMV to its yield,new methods are needed for the investigation of sugarcane resistance to the virus.The present study aimed to identify DNA markers associated with SCMV resistance and to elucidate its molecular basis using genomic and transcriptomic approaches.A panel of Saccharum accessions was assessed for SCMV resistance and genotyped by genotyping by sequencing (GBS).These data were used in a genome-wide association study (GWAS) and for genomic prediction with machine learning(ML)and feature selection(FS)to identify markers associated with resistance.Associated markers were genotyped in additional accessions for validation and were annotated using a newly assembled sugarcane transcriptome.This allowed the incorporation of SCMV-associated genes into a coexpression network, permitting a broader investigation of the molecular basis underlying sugarcane resistance to this virus.
2.Materials and methods
2.1.Plant material
The plant material employed in the study has been described elsewhere [29].The experimental population consisted of a panel of 97 sugarcane genotypes, comprising wild accessions of S.officinarum, S.spontaneum, and S.robustum; commonly grown sugarcane and energy cane clones; and commercial cultivars from Brazilian breeding programs.The accession names and pedigree information are presented in Table S1.A field experiment following a randomized complete block design with three blocks was established in May 2017 at the Advanced Center for Technological Research in Sugarcane Agribusiness located in Ribeirão Preto, São Paulo, Brazil (4°52′34′′W, 21°12′50′′S).Plants were grown in 1-mlong three-row plots with row-to-row and interplot spacings of 1.5 and 2 m, respectively.Each row contained two plants, for a total of six plants of each genotype per plot.Infection by SCMV isolate RIB-2 [21] was allowed to occur under natural conditions in conjunction with high inoculum pressure and a high incidence of aphid vectors.
2.2.Phenotyping
Plants were phenotyped in two cropping seasons: plant cane was assessed in February 2018 (9 months after planting) and ratoon cane in July 2019 (9 months after the first harvest).The severity of SCMV symptoms was assessed by two or three independent evaluators, who classified the top visible dewlap leaves in each plot using a diagrammatic scale consisting of four levels of increasing intensity of mosaic symptoms (Fig.S1).
Data normality was assessed by the Shapiro-Wilk test,and normalization was performed with the bestNormalize package[30]in R software[31].Best linear unbiased predictors(BLUPs)were estimated with the breedR R package [32] using a mixed model, as follows:
where Yijmis the phenotype of the ithgenotype in the jthblock and the mthyear of phenotyping,and the trait mean is represented by μ.Fixed effects were modeled to estimate the contributions of the jthblock (Bj), the mthyear (Ym) and the interaction between block and year(BYjm).Random effects included genotype(G)and residual error (e), representing nongenetic effects.
2.3.Genotyping
Genomic DNA was extracted from leaves and used for the construction and sequencing of a GBS library as described by Pimenta et al.[29].For operational reasons, 94 of the 97 genotypes in the panel were included in the library; genotypes 87, 88 and 95 were excluded (see Table S1).Two 150-bp single-end sequencing libraries were prepared, and their contents were sequenced on a NextSeq 500 instrument (Illumina, San Diego, CA, USA).After the sequencing quality was checked, three tools were used for SNP calling: SAMtools version 1.6 [33], FreeBayes version 1.1.0–3 [34]and the TASSEL4-POLY pipeline [35].A monoploid chromosome set obtained from the allele-defined S.spontaneum genome [36]that included the A haplotype and unassembled scaffolds was used as a genomic reference.After variant calling, VCFtools version 0.1.13 [37] was used to retain biallelic SNPs with a minor-allele frequency of 0.1,a maximum of 25%missing data,and a minimum sequencing depth of 50 reads.SNPs identified by TASSEL and at least one other tool were then selected,and the ratio between alleles (allele proportions, APs) was obtained for each marker.
2.4.Association analyses
2.4.1.Mixed modeling
Association analyses were performed using mixed linear modeling in the GWASpoly R package [38].For these analyses, APs were transformed into genotypic classes with a fixed ploidy of 12 in the vcfR R package [39].A realized relationship model (MMT) matrix[40],built in GWASpoly,was included as a random effect,and three principal components from a principal component analysis performed with genotypic data were included as fixed effects.Six marker-effect models were used for association analyses: general,additive, simplex dominant reference, simplex dominant alternative, diploidized general, and diploidized additive models.Quantile–quantile (Q–Q) plots of -log10(P) values of the markers were generated for all the models, and Manhattan plots were constructed for models with appropriate inflation profiles.Bonferroni correction with α = 0.05 was used to establish the significance threshold for associations.The phenotypic variance explained by each marker (R2) significantly associated with SCMV resistance was estimated using a linear model in R.
2.4.2.ML coupled with FS
Following a genomic prediction approach previously employed for sugarcane[29,41],ML algorithms coupled with FS were used to predict the attribution of genotypes to two groups:those that presented mosaic symptoms in any block or year (susceptible) and those that presented no symptoms in any case (resistant).Eight ML algorithms implemented in the scikit-learn Python 3 module[42] were tested: adaptive boosting (AB) [43], decision tree (DT)[44], Gaussian naive Bayes (GNB) [45], Gaussian process (GP)[46], K-nearest neighbor (KNN) [47], multilayer perceptron (MLP)neural network [48], random forest (RF) [49] and support vector machine (SVM) [50] models.Three FS techniques were employed to estimate feature importance and create subsets of marker data:gradient tree boosting[51],L1-based FS using a linear support vector classification system [50] and univariate FS using analysis of variance [52], which were also implemented in scikit-learn.The markers selected by at least two of these FS methods were used along with the eight ML algorithms to classify genotypes as resistant or susceptible.To implement a cross-validation strategy, a stratified K-fold (k = 5) repeated 100 times for different data configurations was used.The following metrics were evaluated:accuracy (proportion of correctly classified items), recall (items correctly classified as positive among the total number of positives), precision (items correctly classified as positive among the total items identified as positive), and the F1 score (the harmonic mean of precision and recall).The area under the receiver operating characteristic(ROC)curve(AUC)was also calculated for all the models using scikit-learn and plotted with the ggplot2 R package[53].
2.5.Marker validation
Markers significantly associated with SCMV resistance were subjected to validation in two additional panels with sugarcane genotypes previously assessed for this trait.The first panel comprised 28 wild accessions, including representatives of S.officinarum, S.spontaneum, S.robustum, S.barberi, and interspecific hybrids[54],and the second panel comprised 64 Brazilian varieties and elite clones from the three main sugarcane breeding programs in Brazil[55].These 92 genotypes(Table S2)were used for validation using MonsterPlex Technology (Floodlight Genomics, Knoxville, TN, USA).DNA was extracted from leaves following Aljanabi et al.[56] or using the GenElute Plant Genomic DNA Miniprep Kit (Sigma-Aldrich, St.Louis, MO, USA).DNA samples and marker flanking sequences were sent to Floodlight Genomics, where multiplex PCR was used to amplify ~100-bp fragments containing markers, which were then sequenced on a HiSeq platform (Illumina).Trimmomatic version 0.39 [57] was used to trim the single-end sequencing reads using a 5-nt sliding window with a minimum average Phred quality score of 20 and removing reads shorter than 30 nt.The trimmed reads were aligned to reference flanking sequences with Bowtie2 version 2.2.5 [58], and SNP calling was performed with SAMtools and FreeBayes.After APs/genotypic classes were obtained for each locus,linear models in R were used to estimate marker R2values for each panel, and ML models were used to predict resistance phenotypes as previously described.
2.6.Synteny analyses
For synteny analyses, the coding DNA sequences (CDSs) of the causal genes at Scmv1 and Scmv2 were retrieved from the MaizeGDB database [59] and aligned against the S.spontaneum genome sequence [36] using BLASTn [60].Synteny plots were constructed using Circos software version 0.69.9 [61].The Scmv1 CDS was also aligned to the genome sequences of S.spontaneum Np-X [62], S.officinarum LA Purple (SRA BioProject accession PRJNA744175), and the hybrids SP70–1143 [63], R570 [64],SP80–3280 [65], and CC01–1940 [66].
2.7.Coexpression network construction and marker annotation
To annotate markers associated with SCMV and investigate their expression profiles, RNA-Seq data supplied by Marquardt et al.[67] were used.This study provided data from sugarcane samples grown in Australia with five biological replicates, each composed of four to five bulked leaves, which were considered suitable for the construction of a highly robust coexpression network.Sequencing data were downloaded from the Sequence Read Archive (SRA; BioProject PRJNA474042) and trimmed with Trimmomatic version 0.39 [57] with the default parameters.
A de novo-assembled transcriptome was obtained using Trinity version 2.5.1 [68], with the minimum contig length set to 300 bp.The completeness of the assembly was evaluated with BUSCO version 5.1.2 [69] using datasets of conserved orthologs from Viridiplantae.Annotations were performed with Trinotate [70]and included similarity searches of sequences in the UniProt database [71], domain identification according to information in the Pfam database[72],and predictions of signal peptides with SignalP[73] and transmembrane domains using TMHMM [74].Salmon version 1.1.0 software [75] was used for transcript quantification with the default parameters.Genes with fewer than 5 transcripts per million (TPM) on average in at least one sample type were filtered out to exclude genes expressed at low levels,and genes with no variance across quantifications were excluded using the WGCNA package [76].A global weighted gene coexpression network (GWGCN) was constructed with WGCNA.Pairwise Pearson correlations of TPM values considering a power function fitting scale-free independence were used.A soft threshold power beta estimation of 25, corresponding to an R2value of 0.85, was estimated and generated a scale-free topology model.Functional modules in the network were defined using the unweighted pair group method with arithmetic mean (UPGMA) based on a topological overlap matrix and dynamic dendrogram pruning based only on the dendrogram.
To annotate markers associated with SCMV resistance and locate them in the network, the de novo transcriptome assembly was aligned with BLASTn against the S.spontaneum genomic reference used for SNP calling, and the closest genes upstream and downstream of each marker at a maximum distance of 2 Mb were retrieved.The following parameters were used:a minimum of 90%identity,a minimum E-value of 1e-50,and best hit algorithm overhang and edge values of 0.1.Similarly,the CDSs of the causal genes at Scmv1 and Scmv2 were aligned against the transcriptome assembly using BLASTn with default parameters.
All genes present in the network modules containing genes associated with SCMV resistance were recovered and used for Gene Ontology(GO)[77]enrichment analysis with the topGO R package[78] in conjunction with Fisher’s test with Bonferroni correction with α=0.01.REVIGO[79]was used for the visualization and analysis of GO categories of genes associated with SCMV resistance and in enriched categories associated with the genes in the network modules.
3.Results
3.1.Panel phenotyping and genotyping
Ninety-seven sugarcane accessions were evaluated for the presence and severity of SCMV symptoms in two consecutive years.A skew in the distribution of the data toward an absence of symptoms was observed; despite normalization procedures, these data did not follow a normal distribution, as indicated by the Shapiro–Wilk test (P = 2.2e-16).Based on the occurrence of SCMV symptoms, the panel could be divided into two groups: 62 resistant genotypes, which did not present symptoms in any block or year,and 35 susceptible genotypes, which presented symptoms on at least one occasion.
Following the construction and sequencing of the GBS library,biallelic SNPs were identified using FreeBayes (3,747,524 SNPs),SAMtools (3,152,409 SNPs) and the TASSEL-4-POLY pipeline(569,360 SNPs).After filtering procedures were performed and the intersection between tools was examined, 37,001 of these markers were found to be called by TASSEL4-POLY and at least one of the other tools, constituting the final set of reliable SNPs.
3.2.Association analyses
3.2.1.Mixed modeling
Q–Q plots generated by mixed modelling genome-wide association analyses targeting SCMV resistance can be found in Fig.S2.Most models showed an appropriate profile of inflation of P values;exceptions disregarded for further analyses included the general model, which presented insufficient control of inflation, and the simplex dominant alternative model, which presented deflation.A stringent significance threshold was used to establish 20 significant marker–trait associations,some of which were highly significant (Fig.1); the R2values of associations ranged from 0.017 to 0.299 (Table S3).Most markers were associated with SCMV resistance by more than one model, and nine nonredundant markers were representative of all associations.
3.2.2.ML coupled with FS
Eight ML algorithms were tested to predict the attribution of sugarcane genotypes to SCMV-resistant or SCMV-susceptible groups based on genotypic data.In assessing the potential of these algorithms for performing this task using the full marker dataset,the predictive accuracies ranged from 52.8(DT)to 66.9%(RF),with a mean of 60.3%(Fig.S3;Table 1).The remaining metrics evaluated showed much inferior results,with means of 21%,26.8%and 20.7%for precision, recall and F1 score, respectively.GP performed particularly poorly, with the mean of measurements equal to zero for these three metrics (Figs.S4–S6; Table 1).
The employment of three FS methods enabled the identification of a 73-SNP dataset which led to considerable increases in all metrics of all models.With the reduced dataset, a mean accuracy of 90.2%, with a maximum of 99.7% using MLP, was obtained(Fig.S3; Table 1).Even more pronounced increases were observed for the other metrics: the mean precision was 79.6%,with a maximum of 100% with MLP (Fig.S4; Table 1); the mean recall was 91.4%, with a maximum of 100% with KNN and SVM (Fig.S5;Table 1); and the mean F1 score was 83.6%, with a maximum of 99.6 with MLP (Fig.S6; Table 1).ROC curves and their AUCs supported the promising results of FS in the predictive task.When all the markers were used, all the models presented ROC curves close to the level associated with chance alone,with AUCs ranging from 0.46 to 0.57(Fig.2a).However,when markers selected by FS were used, most ROC curves indicated much better model performance, with AUCs of up to 0.99 (Fig.2b).Only DT and GP did not show appreciable increases in the AUC, and could not be considered appropriate methods for genomic prediction in this case.
3.3.Marker validation
Two groups of sugarcane genotypes previously assessed for SCMV resistance were genotyped with MonsterPlex Technology to validate the markers identified in the association panel.The sequencing of the MonsterPlex library generated a total of 38,581,797 single-end reads, 99.8% of which presented a mean Q-value greater than 30; these values remained consistently high for the first 100 bases of the reads (Fig.S7a).These data encompassed 81 of the 92 samples sent for analysis;DNA from genotypes 4,5,18,68,69,70,71,73,76,77,and 79(Table S2)were not amplified well, and these samples were consequently absent in the sequencing results.Ten of these samples were represented by wild S.officinarum F1 accessions,with only genotype 18 representing an interspecific hybrid commercial variety.After trimming,38,574,693 reads were retained, 99.9% of which had a mean Qvalue greater than 30 (Fig.S7b).Using SAMtools and FreeBayes,53 of the 82 target SNPs (64.6%) could be called.
Seven of these SNPs were identified by GWAS as significantly associated with SCMV resistance.When associations involving these markers were tested using linear models,the R2values were generally lower than those of the original panel and were frequently close to zero.However, these values remained positive and were as high as 0.236(Table S4).The remaining 46 SNPs identified belonged to the reduced 73-SNP dataset identified by FS.These markers were applied to the eight ML models tested, which resulted in a mean accuracy of 61.6%,with a maximum of 69.1%by the RF model.This model was also among the top-ranking models in terms of precision(68.6%),recall(94.1%)and F1 score(79.3%)for the identification of resistant genotypes (Table 2).
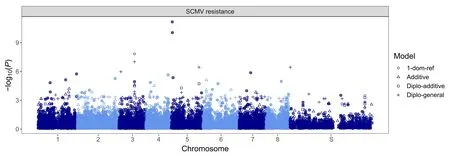
Fig.1.Manhattan plots generated from association analyses in which the best linear unbiased predictor(BLUP)values of sugarcane mosaic virus(SCMV)symptom severity were used.Four different models were used:additive,simplex dominant reference(1-dom-ref),diploidized general(diplo-general)and diploidized additive(diplo-additive)models.On the X-axis, S represents scaffolds not associated with any of the Saccharum spontaneum chromosomes.

Table 1 Metrics for the prediction of sugarcane mosaic virus (SCMV) resistance by machine learning (ML) models before and after feature selection procedures.
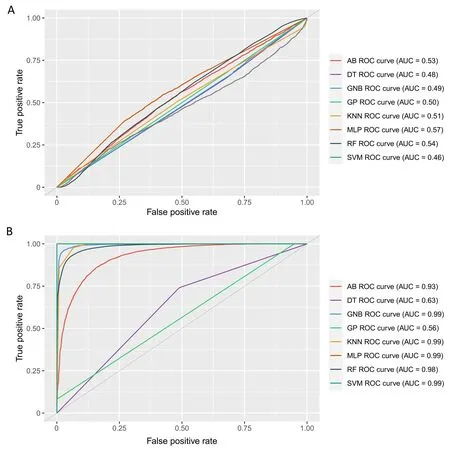
Fig.2.Receiver operating characteristic(ROC)curves and area under the curve(AUC)results for the performance of machine learning models in predicting sugarcane mosaic virus(SCMV)resistance using the full marker dataset(A)and markers selected by feature selection(B).AB,adaptive boosting;DT,decision tree;GNB,Gaussian naive Bayes;GP, Gaussian process; KNN, K-nearest neighbor; MLP, multilayer perceptron neural network; RF, random forest; SVM, support vector machine.
3.4.Synteny analyses
Despite the close phylogenetic relationship of maize and sugarcane,BLAST searches of Scmv1 in the S.spontaneum genome resulted in no hits,suggesting that this gene is absent in this species.Searches in the genomes of six further sugarcane accessions also returned no matches for this gene.The sequence of Scmv2, in contrast, produced a 373-bp alignment with 88.7% identity and an E-value of 4.92e-127.This match corresponded to the gene Sspon.02G0027920-1A,which, similarly to the causal gene at Scmv2, encodes an auxinbinding protein.It is located on chromosome 2A and is 1.7 kb from the marker Chr2A_103190628,which was identified as being associated with SCMV resistance by FS (Fig.3).
3.5.Coexpression network construction and marker annotation
To assemble a de novo sugarcane transcriptome for marker annotation and expression analysis, more than two billion(2,477,287,294) sugarcane RNA sequencing (RNA-Seq) reads were retrieved from the SRA, 76% of which (1.9 billion) were retained after trimming.The transcriptomic reference assembled using Trinity comprised 611,480 transcripts with an N50 of 1233 bp, represented by 212,076 longest isoforms (henceforth referred to as‘‘genes”)with an N50 of 2561 bp.The complete assembly contained 83.8%of conserved orthologs from green plants,as reported based on BUSCOs (Table S5).After quantification with Salmon, 131,615 genes were discarded for very low expression.The remaining geneswere used to construct a GWGCN.Using the UPGMA approach, 64 functional modules were defined in this network,with sizes ranging from 58 to 32,980 genes and a mean size of 1257.

Table 2 Predictive accuracy, precision, recall and F1 scores of machine learning approaches employed to predict SCMV resistance in the validation panel.
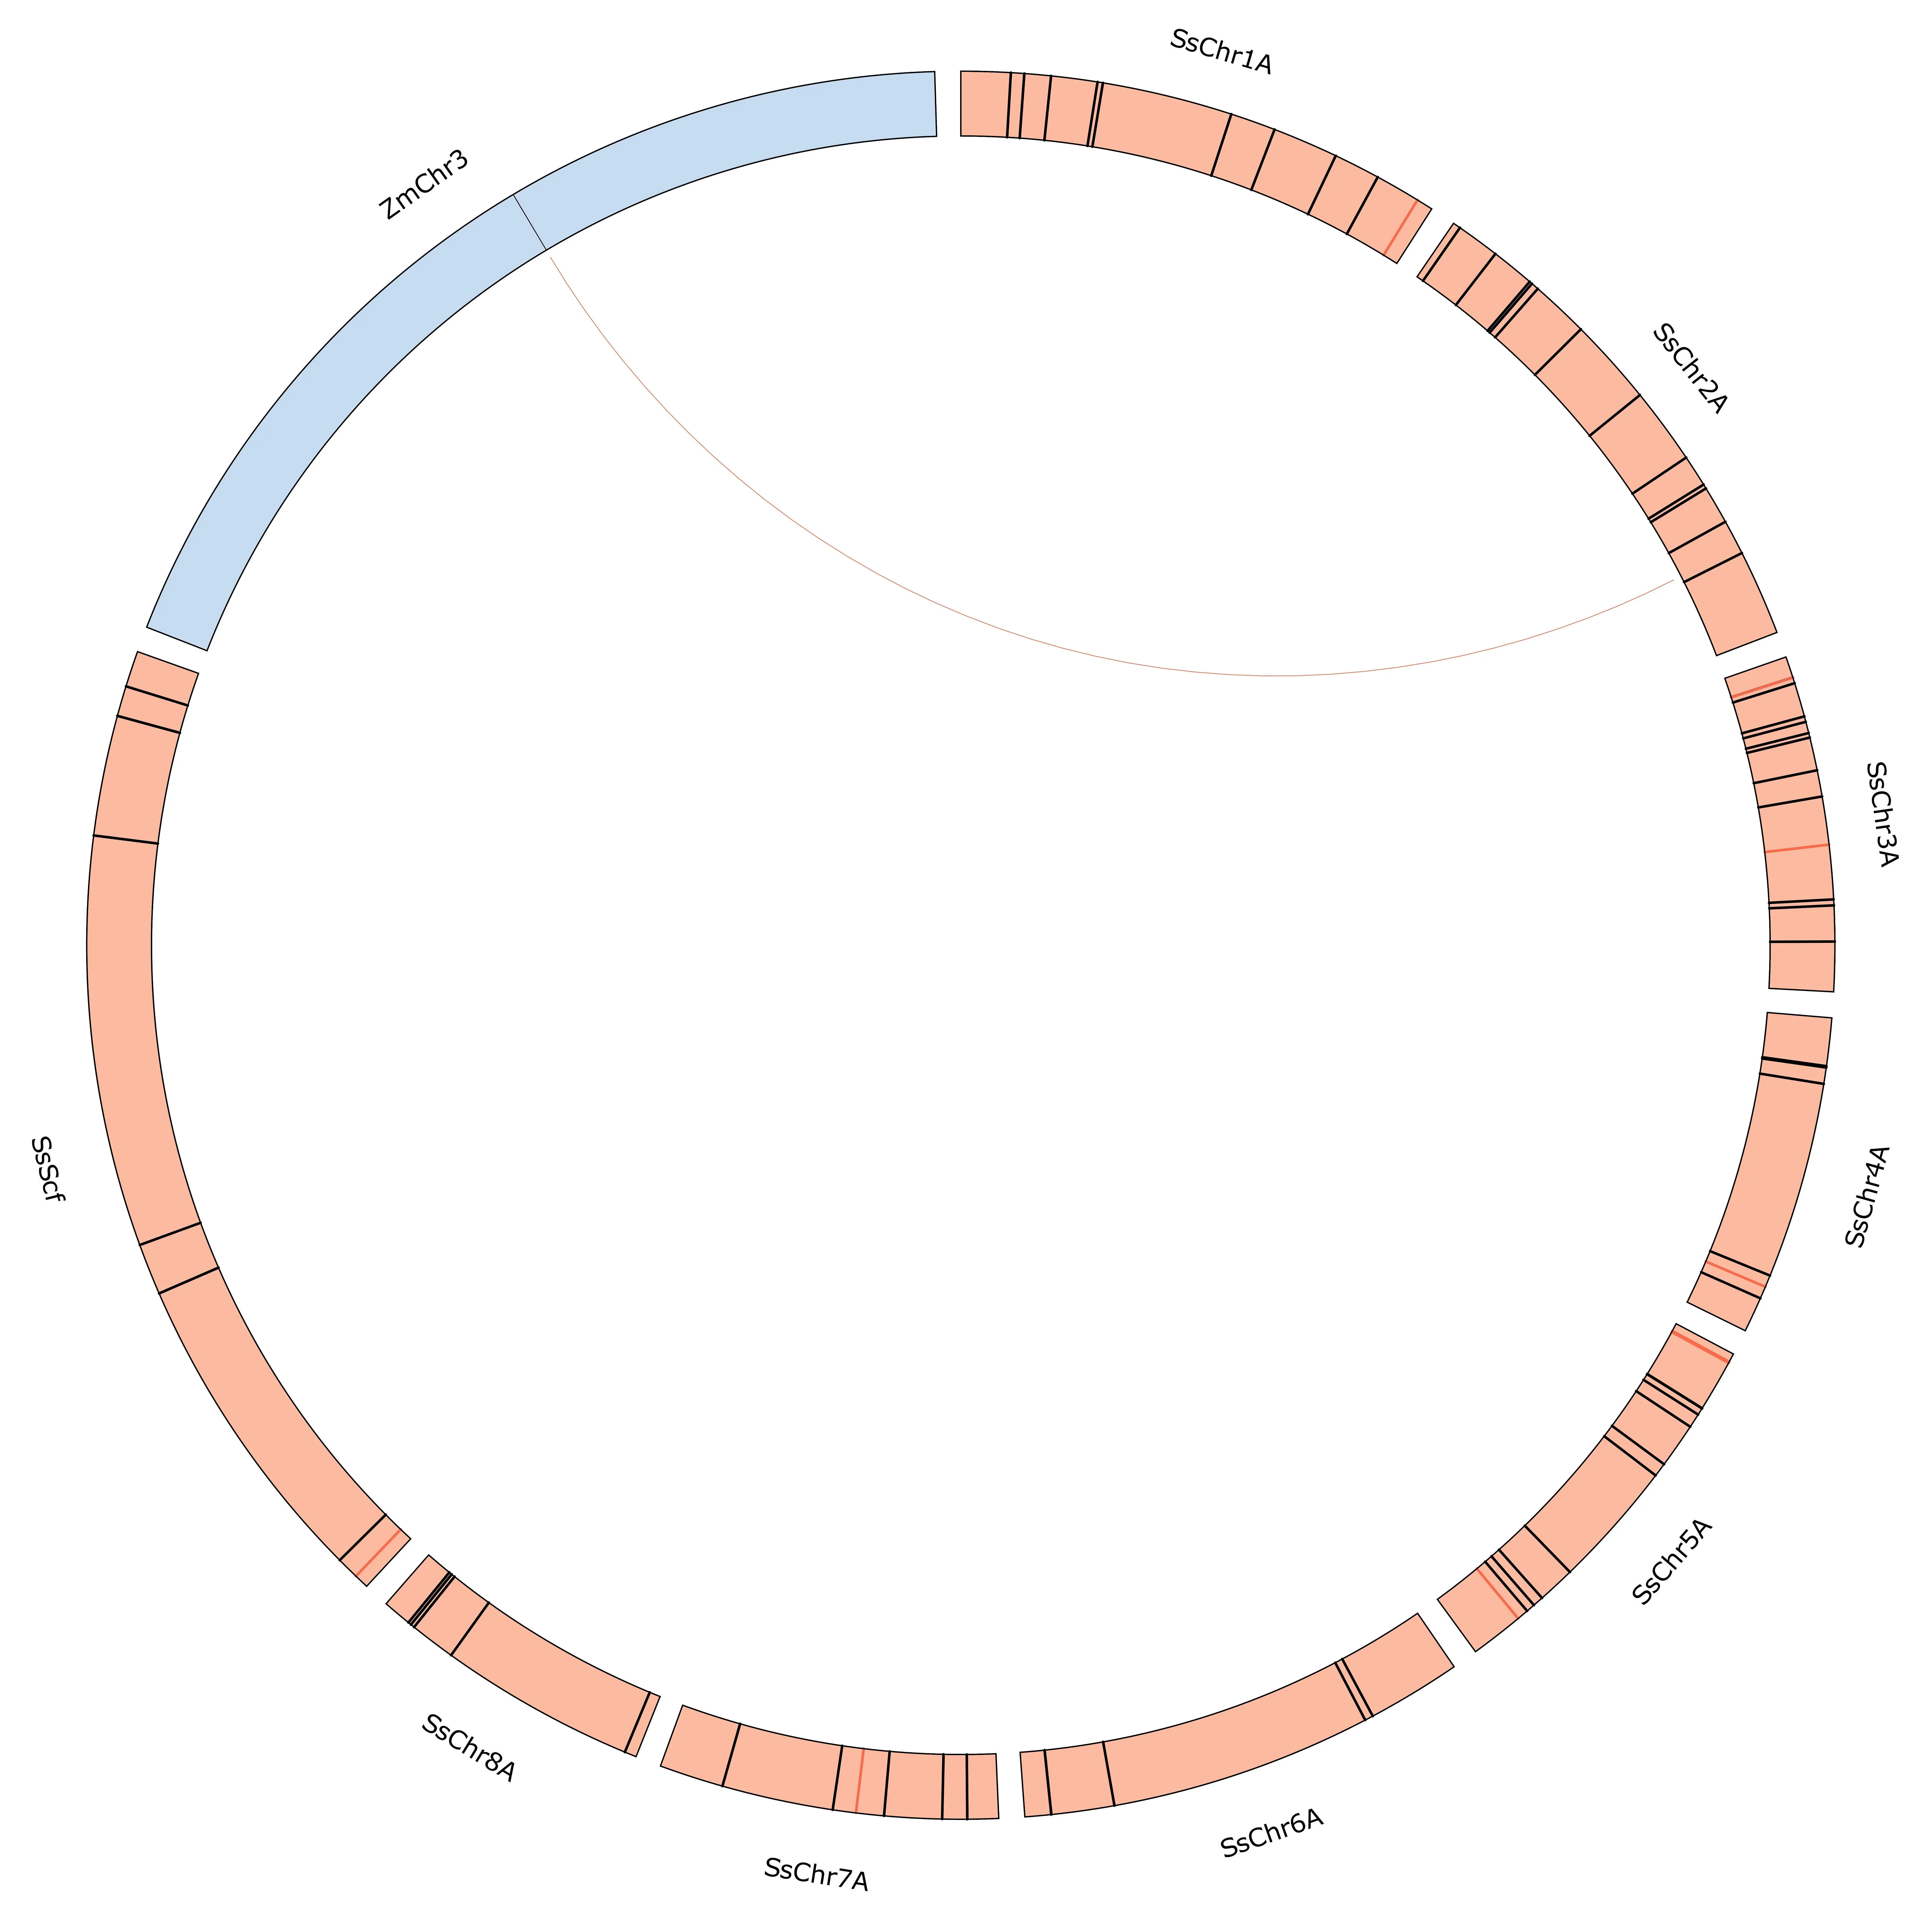
Fig.3.Synteny plot of Scmv2 on chromosome 3 of Zea mays (blue) and Saccharum spontaneum A chromosomes and unassembled scaffolds (red).Ticks represent markers associated with sugarcane mosaic virus (SCMV) resistance by association mapping (in red) and feature selection (in black).
The annotatation of markers identified as being associated with SCMV resistance by GWAS and FS based on the S.spontaneum genome enabled the association of 69 markers with 220 isoforms representing 84 genes.Of these genes,35 were located in 26 modules in the coexpression network.A summary of the alignment results is presented in Table S6.Among the annotated genes, a diseaseresistance protein associated with the Chr1A_90316612 marker was of particular interest.For better visualization of the biological processes associated with all the annotated genes, their GOassociated terms were retrieved and used to construct a network using the REVIGO tool (Fig.4).The most prominent terms identified were linked to the regulation of transcription and translation,stress responses, and organismal development.The ‘‘modulation by virus of host process”term,which is associated with a peroxisomal oxidase and the marker Chr6A_86163774,was also identified.
Alignment of the sequence of Scmv2 from maize against the transcriptome yielded several hits, the great majority of which were with TRINITY_DN5998_c0_g1.This gene was annotated as an auxin-binding protein and located in functional module 5 in the coexpression network,which also contained four genes located near SNPs associated with SCMV resistance.Among the hits with TRINITY_DN5998_c0_g1, the one with the highest E-value (1.07e-176) occurred in isoform 9, representing a 524-bp alignment with 88.1% identity.This and all isoforms of the gene also presented high-scoring alignments with the region containing Sspon.02G0027920-1A.
As a final strategy for investigating the biological processes involved in SCMV resistance,the GO terms of the 14,732 genes present in the 26 modules containing the genes associated with resistance were determined.Because these genes were initially associated with very many GO terms(3859 terms in the biological process category), a GO enrichment analysis using Fisher’s test with Bonferroni correction was performed.The 117 terms resulting from this analysis were used to construct a TreeMap in REVIGO(Fig.S8).The main identified terms included ‘‘response to salt stress”, ‘‘DNA integration”, ‘‘regulation of multicellular organismal process”, ‘‘photosynthesis”, and ‘‘seed germination”.
4.Discussion
Although our GWAS analysis did not reveal major loci controlling resistance to SCMV in sugarcane, it led to the identification of SNPs significantly associated with this trait, explaining a small(1.7%)to moderate(29.9%)percentage of the observed phenotypic variation.Compared to Scmv1, the major SCMV resistance QTL identified in maize, which alone explains 54%–56% of observed variation [14,16], these findings might seem modest.However,they fall within the upper range revealed by other mapping studies in sugarcane; markers explaining 10% or less of the phenotypic variation in traits of agronomic importance are common in this crop [27,28].Specifically, for resistance to SCMV, previous studies identified markers explaining 5%–14% of the observed variance as individual markers[20,21]or up to ~40%together[19].The apparent quantitative nature of resistance to SCMV in sugarcane attests to the limitations of conventional marker-assisted breeding in this crop and demonstrates the need for the deployment of highthroughput genotyping and specific methodologies for association analyses in sugarcane.

Fig.4.Network of Gene Ontology (GO) biological process terms associated with sugarcane mosaic virus (SCMV) resistance.
One finding of our study that contributes to understanding the quantitative nature of SCMV resistance in sugarcane is the absence in the S.spontaneum genome of a gene that is homologous to ZmTrxh, the causal gene underlying Scmv1.The expression of ZmTrxh, which encodes an atypical thioredoxin that acts as a molecular chaperone, is necessary to disrupt infection by SCMV[18].As in other Poaceae species [18], close orthologs of ZmTrxh are not present in S.spontaneum,resulting in the lack of this specific resistance mechanism in this crop.Given that ZmTrxh is absent even in several maize lines, its presence in other sugarcane genotypes cannot be completely ruled out.However, BLASTn alignments of its sequence were also performed against those of all other sugarcane genomes available to date,none of which returned significant alignments with the ZmTrxh sequence.Given the very narrow genetic base of sugarcane [22], this gene is likely to be absent in other genotypes of commercial relevance.
In addition to GWAS, ML algorithms coupled with FS were employed to predict genotype resistance or susceptibility to SCMV.Similarly to previous studies in which this genomic prediction methodology was applied to sugarcane to evaluate resistance to brown rust[41]and sugarcane yellow leaf virus[29],very promising values for several metrics were obtained.These values were considerably superior to those obtained by Barnes et al.[19],who predicted sugarcane resistance to SCMV with an accuracy of 76% based on random amplified polymorphic DNA markers.Our results arose from a highly restricted SNP set obtained by FS,none of which had been identified by GWAS.A similar joint learning methodology based on FS and ML and combining classification and regression strategies has recently been shown[80]to be highly suitable for the genomic prediction of several agronomic traits of sugarcane and polyploid forage grass species.
Unlike Scmv1, the causal gene at the second major SCMV resistance QTL from maize(Scmv2)has an ortholog in the S.spontaneum genome.One marker identified through FS (Chr2A_103190628)was found to be located close(1.7 kb)to this region.Linkage disequilibrium is high in sugarcane, persisting over physical distances of up to 2 Mb[29].Thus,it is possible that this marker is linked to Sspon.02G0027920-1A, the S.spontaneum gene syntenic to the auxin-binding protein gene at Scmv2[17].This finding is an indication of the potential suitability of FS methodologies for the identification of QTL,which is supported by other studies focused on the identification of QTL controlling highly quantitative traits [81].
To apply the findings of our study to sugarcane breeding,validation of the markers associated with SCMV resistance was performed.In sugarcane, the validation of individual SNPs has been successfully achieved only for resistance to orange rust [82].In the context of genomic prediction,SNP validation in sugarcane test populations was recently implemented by Hayes et al.[83], who employed single-dose markers obtained from a SNP chip and achieved mean predictive accuracies of 29%–47% for various agronomic traits.Owing to the relatively high cost of chip genotyping and the importance of including allele dose information in sugarcane genetic studies [41], MonsterPlex Technology was chosen to validate our GBS-based markers.However,a few issues arose with this method, including failure in the amplification of many sugarcane genotypes and loci.
To some extent, failings in the amplification were expected for the technique, which does not guarantee the successful amplification and sequencing of all targets.The nonamplification of some genotypes may have been a consequence of the genomic reference used for SNP calling:the genome of S.spontaneum,a different species from that contributing almost all the genotypes for which amplification failed (S.officinarum).Because most modern sugarcane cultivars likely to be targeted by marker-assisted breeding are hybrids of these two species[22],failure to amplify whole genotypes is expected to be minimized.The issues with target amplification possibly arising from the usage of a non-ideal reference highlight the importance of providing high-quality sequence data for genetically complex species such as sugarcane, which would advance research and breeding in this crop.Still,this low-cost targeted sequencing technology has the potential to be a viable approach for sugarcane marker-assisted breeding,especially if coupled with the ML-based genomic prediction approach used in this study,which effectively reduces the number of markers to be genotyped,contributing to the cost-effectiveness of the process.The predictive accuracy obtained with the RF model is a strong indicator that this approach can be adopted for other sugarcane traits.
To annotate the markers identified as being associated with resistance and further investigate biological processes linked to them, a gene coexpression network was constructed.Although RNA-Seq data from sugarcane plants infected with SCMV are available [84], these data come from only two biological replicates,affording a very low sample number for network modeling.WGCNA developers recommend a minimum of 15 samples to avoid noise and biologically meaningless inferences[85].The summarization of GO terms from genes located close to markers directly associated with SCMV resistance revealed a few general processes previously associated with responses to the virus,including stress responses and the regulation of transcription and translation [84,86].
A more detailed examination of marker annotations revealed several genes previously linked to resistance to plant viruses; in many cases, these associations were established by RNA-Seq or proteomics.This was the case for allantoinases [87], GLO oxidases[88], alpha-galactosidases [89], WD repeat-containing protein homolog genes[90],and pentatricopeptide repeat-containing proteins, which have also been associated by GWASs with resistance to SCMV in maize [91,92].Similarly, Shen et al.[93] identified a ribonuclease H protein gene at a QTL responsible for potyvirus resistance in soybean and showed that the expression of this gene was upregulated in resistant cultivars and influenced viral accumulation.
There is compelling evidence of associations with virus resistance in plants for other candidates identified in our study.Resistance-gene analogs with nucleotide-binding site leucine-rich repeat(NBS-LRR)motifs such as RGA5 have been shown to participate in recognition of and resistance to potyviruses [94].The preliminary evidence of associations between polymorphisms in NBSLRR protein genes and SCMV resistance in sugarcane[95]strengthens the hypothesis that RGA5 acts as a resistance protein opposing infection by this virus.
Several genes that may represent susceptibility factors to SCMV were also annotated.A chloroplast carbonic anhydrase has been identified [96] as a salicylic acid-binding protein that functions in the hypersensitive response of tobacco.An Arabidopsis homolog of this protein was shown [97] to interact with potyviral HC-Pro,weakening host defense responses and facilitating viral infection.A lower abundance of carbonic anhydrase was also associated with successful infection by Tobamovirus [98].In Arabidopsis, SCE1, a SUMO-conjugating enzyme, interacted with potyviral RNAdependent RNA polymerase, and SCE1 knockdown resulted in increased resistance to Turnip mosaic virus [99].This protein also interacts with the replication initiator protein of begomoviruses and interferes with their replication [100].
Three proteins that show chaperone activity and function in resistance to viruses were annotated.DNAJ and DNAJ-like proteins such as C76 and DNAJ 10 have been shown [101] to interact with the coat protein of potyviruses,promoting viral infection and replication.A heavy metal-associated isoprenylated plant protein was shown [102] to interact with the Pomovirus movement protein,affecting virus long-distance movement.Transcripts of two chaperones and a heavy metal-associated isoprenylated protein accumulated differentially in response to SCMV in sugarcane[86].Another protein annotated in the present study that has been shown to interact with the potyviral movement protein P3N-PIPO is a beta-glucosidase that may facilitate viral spread through the plant [103]; beta-glucosidase genes have also been found in a QTL region for resistance to SCMV [92].Yeast two-hybrid assays including these host proteins and SCMV coat and movement proteins could elucidate the involvement of these proteins in the replication and movement of SCMV.
Finally, the enrichment of GO terms associated with resistance by our GWGCN analysis sheds light on the complex network of biological processes involved in resistance to SCMV.The investigation of modules in coexpression networks can reveal sets of genes that are modulated together to execute specific functions.This approach is based on the ‘‘guilt by association” principle, which proposes that components(genes in our case)with correlated biological functions tend to interact in networks such as GWGCNs[104].According to the results of our analysis, the biological processes enriched in SCMV resistance-associated modules included stress responses, the regulation of transcription and translation,and a process—photosynthesis—that has long been known [105]to be affected by SCMV infection but has not been highlighted in analyses of genes directly associated with resistance.Recent transcriptomic and proteomic studies[84,86,106,107]have shown that infection by SCMV indeed affects the regulation of genes and proteins involved in these processes.Given that the expression of genes identified in the present study as being associated with SCMV resistance is also associated with the expression of genes controlling these processes,these genes may function in their regulation during viral infection.
The finding of our study that resistance to SCMV has a more quantitative nature in sugarcane than in maize is in accord with what has been observed for most traits in this crop.It also provides evidence that the ML-based strategy employed in our study represents a viable approach for marker-assisted breeding in sugarcane;this strategy should therefore be assessed for its efficacy in relation to other quantitative traits of economic importance.The annotation of the identified markers via transcriptomic assembly and the analysis of gene coexpression networks showed that associated genes participate in key mechanisms of resistance to SCMV.These findings also revealed strong candidates for the future investigation of resistance to the virus, which could help elucidate the molecular mechanisms involved.
CRediT authorship contribution statement
Ricardo José Gonzaga Pimenta:Data curation,Formal analysis,Investigation, Methodology, Software, Validation, Visualization,Writing – original draft, Writing – review & editing.Alexandre Hild Aono:Data curation,Formal analysis,Methodology,Software,Validation,Writing–review&editing.Roberto Carlos Villavicencio Burbano:Data curation, Investigation.Marcel Fernando da Silva:Data curation, Investigation, Validation.Ivan Antônio dos Anjos:Investigation, Methodology.Marcos Guimarães de Andrade Landell:Conceptualization, Resources, Funding acquisition.Marcos Cesar Gonçalves:Conceptualization, Methodology,Supervision, Writing – review & editing.Luciana Rossini Pinto:Conceptualization, Funding acquisition, Data curation, Investigation, Methodology, Resources, Supervision, Writing – review &editing.Anete Pereira de Souza:Conceptualization, Funding acquisition, Project administration, Resources, Supervision, Writing – review & editing.
Declaration of competing interest
The authors declare that they have no known competing financial interests or personal relationships that could have appeared to influence the work reported in this paper.
Acknowledgments
We thank Aline C.L.Moraes for assistance in constructing and sequencing the GBS library and Maicon Volpin for assistance with fieldwork.This work was supported by grants from the São Paulo Research Foundation (FAPESP), the Conselho Nacional de Desenvolvimento Científico e Tecnológico (CNPq), the Coordenação de Aperfeiçoamento de Pessoal de Nível Superior (CAPES, Computational Biology Program), the Littoral Polytechnic Superior School(ESPOL)and the Secretaría Nacional de Ciencia y Tecnología(SENESYT).Ricardo José Gonzaga Pimenta received an MSc fellowship from CAPES(grant 88887.177386/2018–00)and MSc and Ph.D.fellowships from FAPESP (grants 2018/18588-8 and 2019/21682-9).Alexandre Hild Aono received a Ph.D.fellowship from FAPESP(grant 2019/03232-6).Roberto Carlos Burbano Villavicencio received a Ph.D.fellowship from PAEDEx-AUIP.Anete Pereira de Souza received a research fellowship from CNPq (grant 312777/2018-3).
Appendix A.Supplementary data
Supplementary data for this article can be found online at https://doi.org/10.1016/j.cj.2023.06.009.
杂志排行

The Crop Journal的其它文章
- OsSPL10 controls trichome development by interacting with OsWOX3B at both transcription and protein levels in rice (Oryza sativa L.)
- Ectopic expression of OsNF-YA8, an endosperm-specific nuclear factor Y transcription-factor gene, causes vegetative and reproductive development defects in rice
- Mechanisms of autophagy function and regulation in plant growth,development, and response to abiotic stress
- ZmDRR206 functions in maintaining cell wall integrity during maize seedling growth and defense response to external stresses
- The plasmodesmata-associated β-1,3-glucanase gene GhPdBG regulates fiber development in cotton
- The MabHLH11 transcription factor interacting with MaMYB4 acts additively in increasing plant scopolin biosynthesis