Ensemble 1D DenseNet Damage Identification Method Based on Vibration Acceleration
2023-12-11ChunShaChaohuiYueandWenchenWang
Chun Sha ,Chaohui Yue and Wenchen Wang
1School of Civil Engineering,Chongqing Jiaotong University,Chongqing,400074,China
2School of Architecture and Art Design,Henan Polytechnic University,Jiaozuo,454001,China
3Zhong Yun International Engineering Co.,Ltd.,Zhengzhou,450007,China
ABSTRACT Convolution neural networks in deep learning can solve the problem of damage identification based on vibration acceleration.By combining multiple 1D DenseNet submodels,a new ensemble learning method is proposed to improve identification accuracy.1D DenseNet is built using standard 1D CNN and DenseNet basic blocks,and the acceleration data obtained from multiple sampling points is brought into the 1D DenseNet training to generate submodels after offset sampling.When using submodels for damage identification,the voting method ideas in ensemble learning are used to vote on the results of each submodel,and then vote centrally.Finally,the cantilever damage problem simulated by ABAQUS is selected as a case study to discuss the excellent performance of the proposed method.The results show that the ensemble 1D DenseNet damage identification method outperforms any submodel in terms of accuracy.Furthermore,the submodel is visualized to demonstrate its operation mode.
KEYWORDS Acceleration;damage identification;1D DenseNet;cantilever beam;ensemble learning
1 Introduction
Structural health monitoring(SHM)[1]is critical for extending the life of civil engineering structures,and damage identification is an essential component of structural health monitoring.Deep learning has been used to propose many damage identification methods[2]based on vibration signals(natural frequency and mode shapes[3-5],acceleration signals,and so on).Natural frequency and mode shapes necessitate the use of sensors to cover the structure,whereas using acceleration signals necessitates less.The deep learning algorithm based on vibration acceleration studied by predecessors is improved in this paper to improve accuracy,and the common cantilever beam damage in engineering is used as the research object,which also has some practical implications.
In the early stage,researchers have proposed various SHM approaches.Examples are the vision-based methods of Barile et al.[6] and Zaurin et al.[7] and the vibration-based methods of Kumar et al.[8] and Döhler et al.[9].In recent years,with the explosive growth of data scale,deep learning has become the mainstream of artificial intelligence[10],triggering extensive research in various disciplines,and it also plays a major role in the field of SHM.
Convolution Neural Network(CNN)is a deep learning algorithm,which was proposed at the end of the twentieth century[11],but it was not taken seriously due to limited computing power and a lack of databases at the time.Until AlexNet[12]demonstrated exceptional performance in the ImageNet Large-Scale Visual Recognition Challenge (ILSVRC) in 2012,2D CNN was widely used and became a representative deep learning algorithm,primarily used in image classification [13,14],natural language processing [15,16],speech recognition [17,18] and 1D signal (such as vibration) processing.Yu et al.[19] developed a 2D CNN model to locate damage in a five-story structure,combining 14 measured signals into 2D features.The trained model correctly identified the structural damage.Khoandehlouh et al.[20] conducted experimental tests on a laboratory structure of a reinforced concrete bridge,and the proposed 2D CNN model can identify the overall damage of the bridge.Gulgec et al.[21] used a 2D CNN model to accurately classify damaged and undamaged finite element modeling samples.
The main advantage of 2D CNN is that it does not require artificial feature extraction by combining feature extraction and classification tasks,and the features of local connection and weight sharing significantly reduce the number of parameters.When feature mapping is particularly complex,however,it is necessary to deepen the network,which may result in performance degradation,gradient disappearance,or explosion.CNN variants have been developed to address these issues.He et al.[22]created the Residual Network (ResNet),which realized another gradient flow mode by establishing jump connections between residual layers and extended the network’s depth,and won first place in the ILSVRC in 2015.Wang et al.[23] used this method to detect frame structure damage and achieved remarkable results.Huang et al.[24] created Densely Connected Convolutional Networks,DenseNet,which increased network width by reusing the characteristic graph,and achieved excellent results in ILSVRC in 2017.Practice has shown that this method is better suited for small sample data sets than ResNet.Wang et al.[25] successfully used this method to detect damage in simply supported beams.Using 2D CNN for damage identification requires merging data obtained from multiple sampling points into one sample.The data features obtained by each sampling point are different,which leads to a large number of features.The difficulty of model training is exponentially related to the number of features.So,it is necessary to increase the amount of data and model complexity.This problem has not been substantially solved in long-term research.
Kiranyaz et al.[26]proposed 1D CNN in 2015,which has the same basic theory as 2D CNN but has far fewer parameters and computational complexity,so it is widely used in 1D data processing.For the first time,Abdeljaber et al.[27] used 1D CNN in vibration-based SHM.Using a large frame experimental structure built by Qatar University as the experimental object,the acceleration data of each frame interface point was extracted and analyzed,and it was possible to determine whether or not each frame interface point was damaged.Avci et al.[28] used 1D CNN to analyze triaxial sensor signals and then integrate them,yielding good results in many damage scenes.Yang et al.[29] solved the problem of two types of steel truss structure damage using 1D CNN.Zhang et al.[30] tested three different beams and used 1D CNN to determine where the stiffness of the beams changed.Using 1D CNN for damage identification only requires identifying one type of feature,and the difficulty of model training and data demand are very low,but when studying some complex problems,its accuracy is often not as good as 2D CNN.
From the description of the current research situation,it can be seen that both 2D CNN and 1D CNN have certain limitations in the application of structural damage identification.The data volume requirement of 2D CNN model is high,the training difficulty is high,and the application difficulty in variable actual engineering is relatively high.The later emerging 1D CNN has greatly reduced both computational complexity and data acquisition difficulty,but its accuracy for complex problems cannot be guaranteed.Therefore,this paper proposes an idea of an ensemble 1D CNN model,which uses multiple sampling points to obtain submodels for ensemble voting to improve the accuracy of the 1D CNN model.The submodel algorithm used in this research process is a 1D form of DenseNet that has received rave reviews in recent years.I believe that according to different research problems,this algorithm can be changed at will.Using this ensemble model to independently model each sampling point’s features does not require too much data,and network training difficulty is also very small.
Chapter 2 introduces the principles of 1D CNN and DenseNet basic blocks,and proposes the network structure and ensemble 1D DenseNet damage identification method built in this paper.Chapter 3 gives a representative case,the problem of damage identification of cantilever beams,so as to explore the accuracy of the proposed method,and briefly introduces the idea of parameter adjustment of the model.Chapter 4 presents the results of the case,shows the results of each submodel and the results after ensemble,and visualizes the feature vectors of the submodels to explore their internal mechanisms.Chapter 5 summarizes the conclusions and shortcomings,as well as the future development direction.
2 Ensemble 1D DenseNet Damage Identification Method
The standard 1D CNN is divided into two layers:feature extraction and classification.The goal of this paper’s 1D DenseNet is to improve the feature extraction layer of the standard 1D CNN into the DenseNet basic block.The submodel of this paper is trained by 1D DenseNet.The following are examples:2.1 introduces the standard 1D CNN theory,2.2 introduces the DenseNet basic block,2.3 introduces the 1D DenseNet structure used in this paper,and 2.4 ensemble 1D DenseNet damage identification method.
2.1 1D CNN Theory
The convolution layer and pooling layer are part of the 1D CNN feature extraction layer,and the classification layer is a full connection network layer.Following the initial feature vector of 1D data input into 1D CNN,features are extracted by convolution layer and compressed by pooling layer,which are connected back and forth and stacked repeatedly to form new feature vectors.Fig.1 depicts the principle.The feature vector of the feature extraction layer’s final layer is expanded into one dimension and brought into the fully connected network layer for classification.
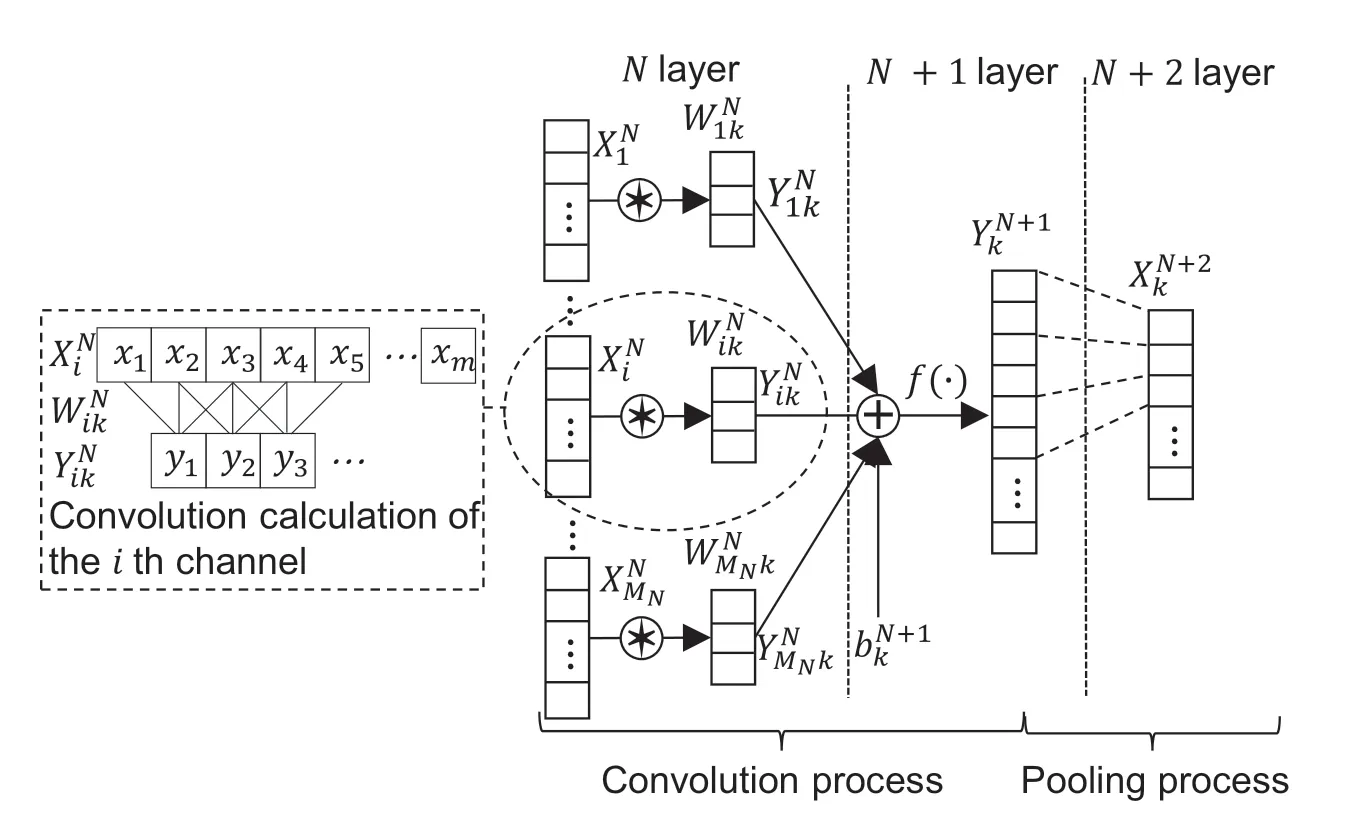
Figure 1:Convolution and pooling principle
2.1.1 Convolution Layer
Multiple convolution kernels with the same number of channels (equal to the number of eigenvector channels and one-to-one correspondence between them),the same size,and different weights are present on each convolution layer.To extract features,each convolution kernel performs convolution calculations with an eigenvector.
The convolution process is achieved by sliding the convolution kernels,each of which is nested with an ReLU-activation function at the end of the convolution.This alleviates the gradient disappearance problem to some extent,and the function expression is as follows:
The forward propagation formula from layer N to layer N +1 of the network is:
the convolution calculation formula in the dotted box is as follows:
where xt(j)denotes the j th weight value of the t th convolved region in the i th channel of the feature vector;ytthe convolution result of the t th convolved region.
2.1.2 Pool Layer
The features obtained by each convolution kernel in the convolution layer are compressed using the maximum value or average value principle,and the features are compressed while maintaining the relative position of the features,reducing the number of parameters and the amount of calculation.Fig.1 depicts the pooling of a convolution kernel following convolution.In the channel dimension,all pooled results in the same layer are connected to form a new feature vector.
2.1.3 Full Connection Layer Network Layer
The feature vector of the last layer is expanded into 1D form and used as the input to the fully connected network.As this paper is a classification problem,the softmax function is set at the end of the fully connected network and the expression is given in Eq.(4).Its function is to transform each output value into a probabilistic form,and the label corresponding to the output value with the highest probability is the category determined by the network.
where yi denotes the function input value;U is the number of input values;denotes the layer soft max output value.
2.2 1D DenseNet Basic Block
2.2.1 DenseBlock
DenseBlock is made up of DenseLayers with the same structure.Fig.2 depicts the Dense Layer structure.It can be seen that,in addition to normal forward propagation,there is branch propagation,which allows for the splicing of front and back features in the channel dimension.In the figure,C*L denotes the input feature vector (number of channels * feature length),BatchNorm denotes the normalisation of the features,xConv1d denotes a 1-dimensional convolutional kernel of size x,4k and k(growth rate) represent the number of convolutional kernels,and dropout reduces overfitting by randomly removing some neurons when training the network.Finally,the output feature vector is(k+C)*L.
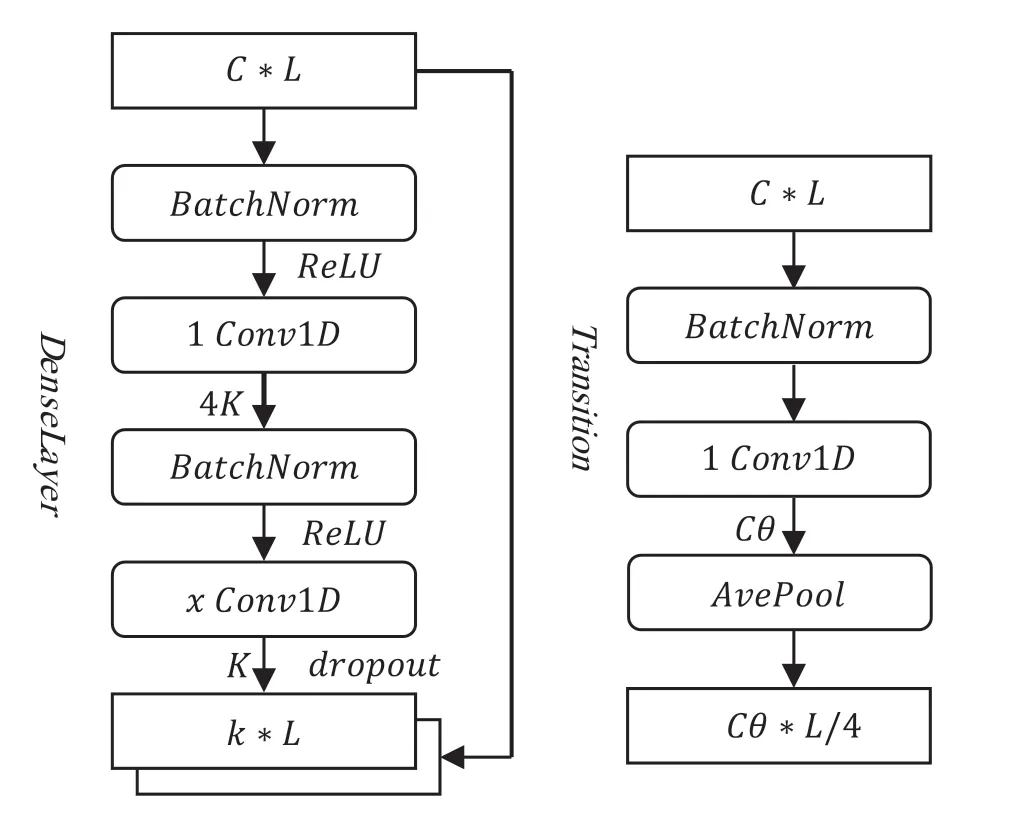
Figure 2:DenseNet basic block
2.2.2 Transition
The Transition joins two DenseBlocks,the structure of which is shown in Fig.2,and compresses the number of channels using a 1-dimensional convolution kernel of size 1.In the figure,θ is the compression factor (set to 0.5 in this paper),and the length of the feature vector is then compressed by an average pooling layer.
2.3 Network Structure and Super Parameter Setting
Table 1 depicts the network structure established in this paper.To suppress noise,the initial feature vector is extracted using a large convolution kernel,and then it enters the 1D DenseNet basic block to extract fine features using a small convolution kernel.Each DenseBlock block consists of 6 DenseLayers,with a total of 40 layers in the network and a growth rate of k=12.
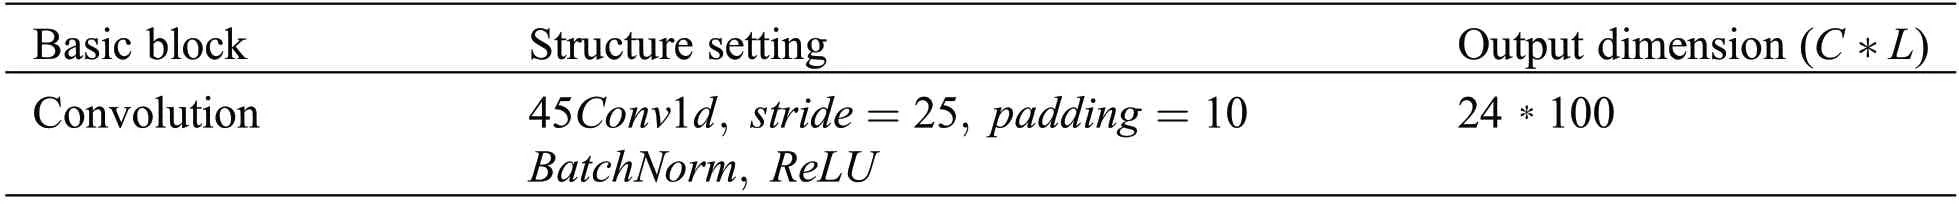
Table 1:Network structure
(Continued)

Table 1 (continued)
2.4 Ensemble 1D DenseNet Damage Identification Method
Aiming at the problem of damage identification,for the same form of damage,after the structure is loaded,different acceleration sampling points can obtain data with different characteristics.Many researchers combine the data obtained from different sampling points to establish 2D CNN model to solve it.However,we know that 1D CNN outperforms 2D CNN in processing sequence data because it has fewer network parameters and requires fewer samples.So in this paper,another idea is put forward.Carry out offset sampling on the data sets obtained from each sampling point,and bring it into 1D DenseNet introduced in 2.3 for training to generate a model,so that each sampling point corresponds to a submodel.When applying submodels to damage identification of structures,it is only necessary to obtain the data of each sampling point by the same method,and after the offset sampling,it is brought into each submodel to output the classification results.Each submodel is solved by voting method,and then the voting results are concentrated to improve the accuracy.See Fig.3 for ideas.
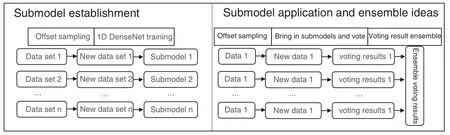
Figure 3:Ensemble 1D DenseNet damage identification method
3 Example:Damage Location of Cantilever Beam
3.1 Data Sets Establishment
Data sets are created to simulate the damage problem of cantilever beam in order to evaluate the method proposed in this paper.Create the cantilever beam model shown in Fig.4 using ABAQUS.The elastic modulus is set to 3e10,the Poisson’s ratio to 0.2,the density to 2551,the unit type to Plane182,and the structure size to 6 m × 0.4 m.The grid is divided into 8 horizontal sections and 120 vertical sections.To simulate the damage,the local elastic modulus reduction (random reduction of 30%~60%) is used.The damage size is fixed at 3 × 3 units,and the location of the damage on the beam is chosen at random.
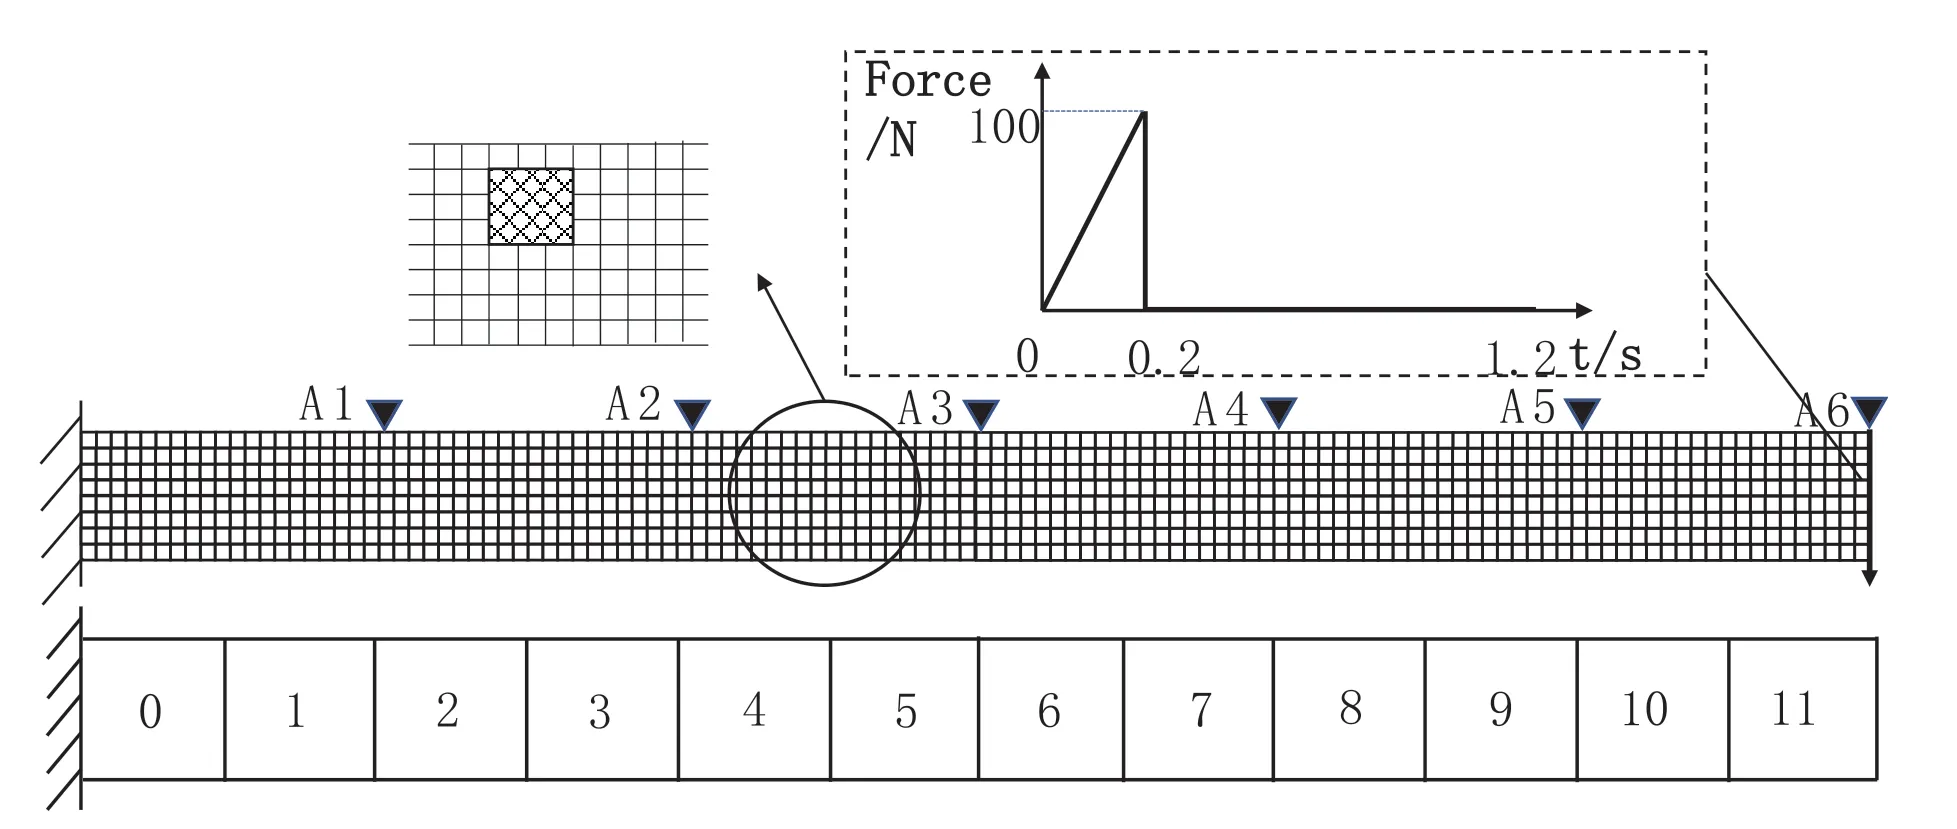
Figure 4:Cantilever beam model
A vertical downward transient load is applied to the upper right end of the cantilever beam,as shown in Fig.4,and six acceleration sampling point (A1-A6) are configured to obtain acceleration time history response data in the Y direction.The transient load’s first load step is set to 0.2 s,the number of substeps to 20,the load size to 100 N,the second load step is set to 2 s for sampling,and the number of substeps to 5,000(that is,the sampling frequency is 2,500 Hz).
Only one type of damage is considered in this paper,and 400 structural damage states are generated.The beam is divided into 12 areas labeled 0-11 based on the location of the damage.As shown in Fig.4,the damage at the intersection of the areas is classified based on its size.
Each acceleration sampling point can obtain one data set,but 400 sets of data in a single data set are insufficient for deep learning.As a result,offset sampling (see Fig.5) is used to improve the data,and a single set of data is divided into 21 segments.The benefits of this method are twofold:first,it expands the data sets,and second,it allows multiple sets of data to correspond to the same injury in order to prepare for subsequent voting.The data sets’s input is the acceleration time history response after offset sampling,and the data sets’s output is the category label.
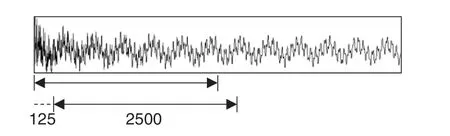
Figure 5:Offset sampling
Each data set is divided into train set and validation set in the ratio of 8:2.The train set is used to train the model,and the validation set is used to adjust the model and test its generalization ability.Such a validation set,however,can only test the set damage.To put the model’s extrapolation ability to the test,48 new damage states are chosen at random,and the data from 6 sensors is offset sampled to generate 6 sets of test set A,which are then added to 6 data sets.To discuss the voting method further below,a new damage is set in each category label,and test set B is generated and added to the data sets in the same manner.To verify the effectiveness of the method in this paper,the difficulty of identification needs to be increased,so all data sets are modified by adding-2 dB of super-large white Gaussian noise.
3.2 Model Establishment and Test Set Classification Ideas
All of the obtained data sets were standardized(mean 0,variance 1)before being fed into 1D DenseNet training to generate six submodels.During the training process,the parameters are constantly adjusted based on the loss of the training set and the accuracy of the validation set.The control variable method is used to adjust the parameters in this paper,and when adjusting one parameter,the other parameters are kept as constant as possible.The first step is to modify the network structure.The number of neurons in the final fully connected layer should not be too large,based on the experience of 1D CNN parameter adjustment.Based on this premise,the number of network layers and the structure of each layer are adjusted,yielding the network structure shown in Table 1.Then,one by one,adjust the following superparameters:(1) The training algorithm is Adam-optimized random gradient descent;(2) Set the batch size to 64;(3) Set the epoch to 50;(4) Set the initial learning rate to 0.01,then reduce it by 0.5 every 10 epoch;(5) Set 0.2 in each DenseLayer;and (6) Use L2 regularization with a parameter of 0.0005.In this paper,all of the data processing and neural network code is written in Python,and the neural network framework is Pytorch.Because the six data sets in this paper are very similar in sequence length and characteristics,the parameter adjustment results are essentially the same.
The loss of training set,the accuracy of validation set,and the accuracy of test set A can be obtained after six models are trained using six data sets.The voting method is investigated in test set B.Each damage corresponds to 21 groups of acceleration time-history response segments after offset sampling.Each loss has 21 results as 21 votes after being introduced into a single submodel,and the one with the most votes is considered the prediction result of a single submodel.The prediction results of multiple sub-models are then voted on collectively to achieve more accurate classification.
4 Result Analysis
4.1 Accuracy Evaluation of Submodels
Table 2 shows the evaluation results of data sets training submodels obtained by six sampling point.Under the influence of -2 dB white Gaussian noise,the accuracy of validation set and test set A is not high.Voting can help to solve these issues.
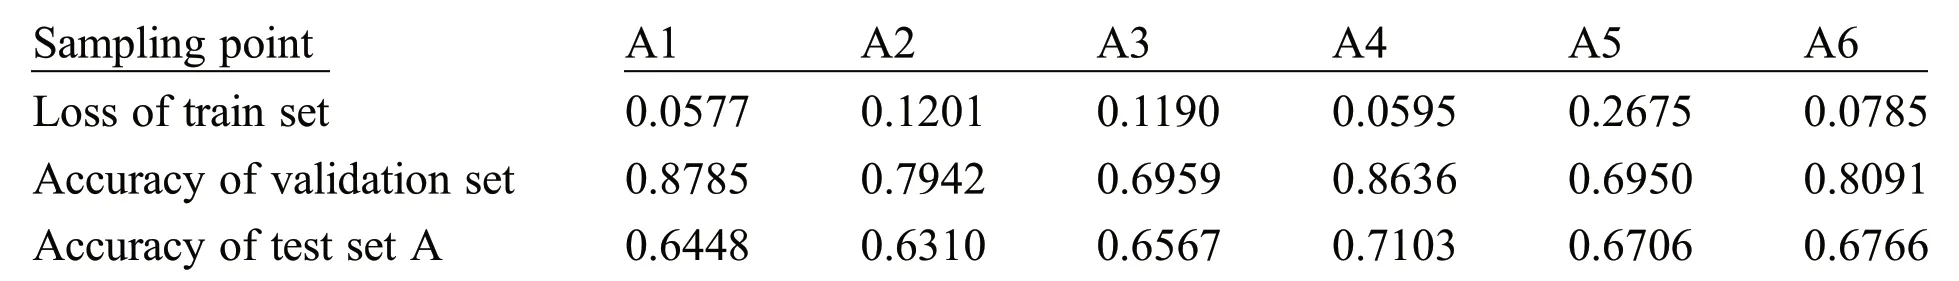
Table 2:Accuracy evaluation of submodel
4.2 Test Set B Voting Classification
Fig.6 shows the voting results of test set B corresponding to six sampling points (A1-A6),with the vertical axis representing the true label and the horizontal axis representing the predicted label.Each injury receives 21 votes;the label with the most votes is chosen as the prediction result,and the diagonal of the confusion matrix indicates the correct result.

Figure 6:Votes on test set B
As shown in Fig.6,for the test set B of each data set,each sub-voting model’s has a positive effect,but each submodel still has the incorrect label,and some of them are far from the true label.Then,in Fig.7,the ensemble voting results are shown.
In Fig.7,(A1-A2) shows the ensemble voting results of the first two submodels,and its recognition effect is roughly equal to that of a single submodel,which is not particularly prominent;(A1-A4) shows the ensemble voting results of the first four submodels,and its effect opinions are significantly improved,and it can be seen that even if the identification is incorrect,it is very close to the real tag;(A1-A6)shows the ensemble voting results of all models,and the results are slightly better than those of (A1-A4).It can be seen that the effect of ensemble voting is very significant,which can improve recognition accuracy,and the effect of this method improves as the number of submodels increases.
4.3 Network Visualization
CNN’s operating mechanism is difficult to comprehend because it is a black box.This paper takes the data set and submodel corresponding to sampling point A6 as an example.The test set A is brought into the submodel for damage classification,and the dimension is reduced using the t-SNE method,and the features extracted by each DenseBlock and finally input into the fully connected network are visualized.The features are depicted in Fig.8.
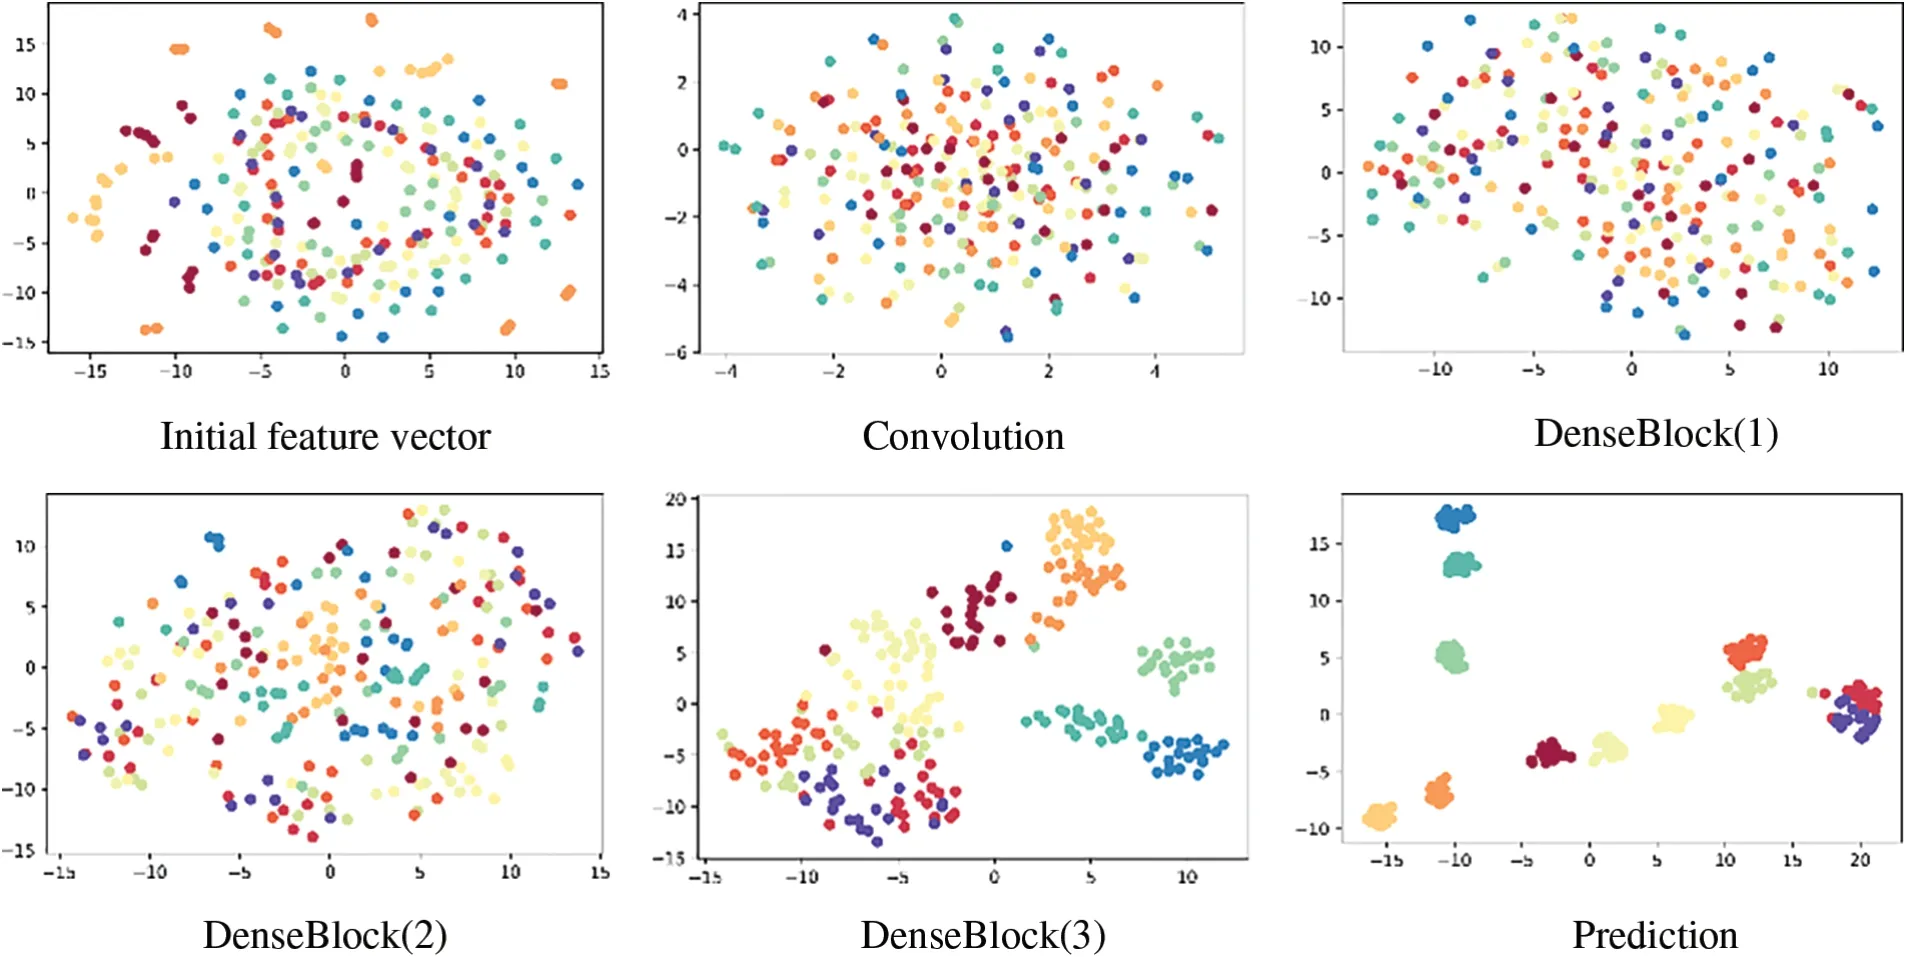
Figure 8:Visualize feature maps
Fig.8 shows that,first and foremost,as the network layers are deepened,the categories become increasingly better.The classification in each DenseBlock layer is initially poor,but improves dramatically in the full connection layer.Second,when we look at the Prediction,we can see that there are some overlapping areas between two labels,which will affect the accuracy,but there are also nonoverlapping areas,which provide a theoretical basis for the voting method.Third,the eigenvectors extracted by Convolution and DenseBlock (1) are very uniform when compared to the initial eigenvectors,and clustering begins only with DenseBlock (2),demonstrating that 1D DenseNet can decorrelate without any additional items.
5 Conclusion
Regarding to the structural damage identification problem related to vibration acceleration,this paper proposes a new method.First introduce the idea of building a 1D DenseNet as an algorithm for training submodels;then use data offset to enhance multiple acceleration sampling points’ acquired data features as a basis for submodel voting;finally introduce how multiple sampling points’ submodels form an ensemble model for ensemble voting.An ABAQUS simulated cantilever beam fracture damage case was listed;seemingly simple cases use ultra-large Gaussian white noise to increase training difficulty to verify this method’s effectiveness.In the end discussed submodel process visualization.
(1) In this paper,the offset sampling method is used to expand the data,which effectively solves the problem of insufficient samples in the data set.This offset sampled data can then be brought into the 1D DenseNet model for voting classification,and has achieved very good recognition effect.
(2)A set of 1D DenseNet submodels is created,and the voting results of each submodel are combined.The recognition accuracy improves significantly as the number of submodels increases,and even if the recognition is incorrect,the prediction results are very close to the real results.
(3) Investigate the internal mechanism of the submodel trained by 1D DenseNet by reducing the dimension and visualizing the feature map of each model,and conclude that the model can automatically decorrelate,and the classification effect will improve as the network layer is deepened.In the last layer of the model you can see classification results;after offset sampling samples will cluster according to their respective category labels;only a few will be identified with other labels;this can serve as a basis for submodel voting.
The submodel used in this paper is established by 1D DenseNet,because the author considers DenseNet to be a relatively novel CNN that has been shown in some studies to be an algorithm suitable for damage identification.In fact,the submodel of this method can be any algorithm or a different algorithm,and I believe that different results will be obtained after experimenting.The cantilever beam simulated by ABAQUS is used in this paper,and the proposed method is validated by increasing the difficulty of identification with white Gaussian noise,without considering more damage situations and experimental verification,but the author believes that the ensemble method proposed in this paper can be applied to these situations.
Acknowledgement:None.
Funding Statement:The authors received no specific funding for this study.
Author Contributions:The authors confirm contribution to the paper as follows:study conception and design:Chun Sha;data collection:Chun Sha,Wenchen Wang;analysis and interpretation of results:Chun Sha,Chaohui Yue and Wenchen Wang;draft manuscript preparation:Chun Sha,Chaohui Yue.All authors reviewed the results and approved the final version of the manuscript.
Availability of Data and Materials:The data that support the findings of this study are available from the corresponding author,upon reasonable request.
Conflicts of Interest:The authors declare that they have no conflicts of interest to report regarding the present study.
杂志排行

Structural Durability&Health Monitoiing的其它文章
- An Overview of Seismic Risk Management for Italian Architectural Heritage
- A Noise Reduction Method for Multiple Signals Combining Computed Order Tracking Based on Chirplet Path Pursuit and Distributed Compressed Sensing
- Quantitative Detection of Corrosion State of Concrete Internal Reinforcement Based on Metal Magnetic Memory
- Predicting Reliability and Remaining Useful Life of Rolling Bearings Based on Optimized Neural Networks