A novel multi-stable sinusoidal chaotic map with spectacular behaviors
2023-12-06AhmedAliAliSrideviSriramHayderNatiqAtefehAhmadiKarthikeyanRajagopalandSajadJafari
Ahmed M AliAli,Sridevi Sriram,Hayder Natiq,Atefeh Ahmadi,Karthikeyan Rajagopaland Sajad Jafari,8
1 Department of Electronics Techniques,Babylon Technical Institute,Al-Furat Al-Awsat Technical University,Babylon,51001,Iraq
2 Al-Mustaqbal University College,Babylon,51001,Iraq
3 Centre for Computational Biology,Chennai Institute of Technology,Chennai,600069,Tamil Nadu,India
4 Department of Computer Technology Engineering,College of Information Technology,Imam Ja’afar Al-Sadiq University,Baghdad,10001,Iraq
5 Department of Biomedical Engineering,Amirkabir University of Technology (Tehran Polytechnic),Tehran,Iran
6 Centre for Nonlinear Systems,Chennai Institute of Technology,Chennai,600069,Tamil Nadu,India
7 Department of Electronics and Communications Engineering and University Centre of Research and Development,Chandigarh University,Mohali,140413,Punjab,India
8 Health Technology Research Institute,Amirkabir University of Technology (Tehran Polytechnic),Tehran,Iran
Abstract Chaotic behavior can be observed in continuous and discrete-time systems.This behavior can appear in one-dimensional nonlinear maps;however,having at least three state variables in flows is necessary.Due to the lower mathematical complexity and computational cost of maps,lots of research has been conducted based on them.This paper aims to present a novel one-dimensional trigonometric chaotic map that is multi-stable and can act attractively.The proposed chaotic map is first analyzed using a single sinusoidal function;then,its abilities are expanded to a map with a combination of two sinusoidal functions.The stability conditions of both maps are investigated,and their different behaviors are validated through time series,state space,and cobweb diagrams.Eventually,the influence of parameter variations on the maps’ outputs is examined by onedimensional and two-dimensional bifurcation diagrams and Lyapunov exponent spectra.Besides,the diversity of outputs with varying initial conditions reveals this map’s multi-stability.The newly designed chaotic map can be employed in encryption applications.
Keywords: chaotic map,discrete chaos,sinusoidal map,multi-stability,dynamical analysis
1.Introduction
Chaos can also be seen in discrete-time systems [1–3].A chaotic map often illustrates how complex chaotic behavior can arise from simple nonlinear dynamical equations [4].A chaotic map is irreversible;it can be repeated in the forward time,but the reverse is impossible [5].By continuously doing repetitions,the map will show various behaviors [4].The map’s orbit is drawn through repeated iterations towards an equilibrium point or an orbit that is either periodic or chaotic.Discrete-time systems or maps can exhibit all kinds of dynamics from a one-dimensional equation;nevertheless,some higher-dimensional maps with more than one state variable have been studied recently [6–8].The main advantage of maps compared to flows is their simplicity and lower computation and implementation cost [9,10].Due to their discrete nature,they can also be utilized in digital scenarios [9].
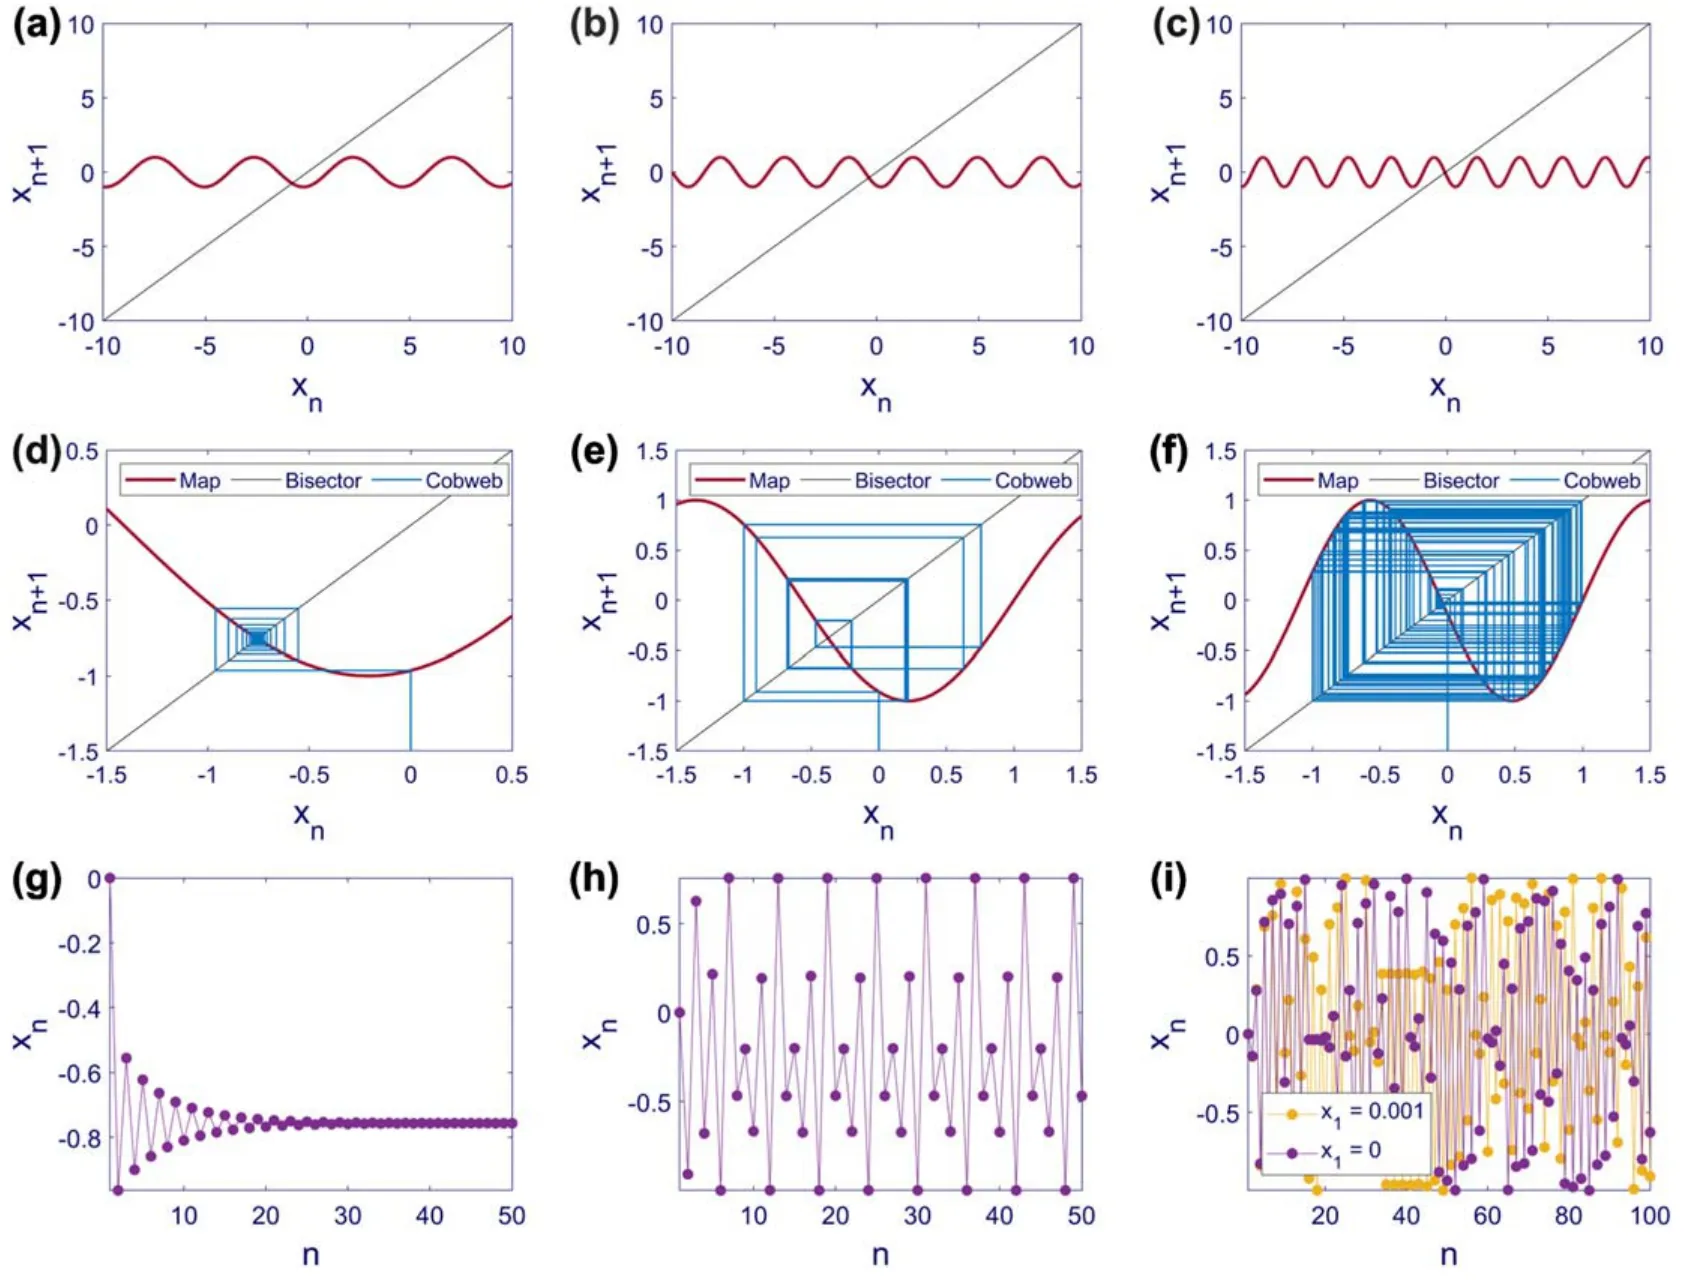
Figure 1.State space,cobweb diagram,and time series of Map (1) with A=1, φ=1,and initial condition x1=0.State space with (a)ω1=1.3,(b) ω1=2,(c) ω1=3,cobweb diagram with (d) ω1=1.3,(e) ω1=2,(f) ω1=3,time series with (g) ω1=1.3,(h) ω1=2,and (i)ω1=3.ω1=1.3,ω1=2,and ω1=3lead to equilibrium point,periodic (period 6),and chaotic behaviors,respectively.Sensitivity to the initial condition is represented by the time series of Map (1) with the initial condition x1=0.001shown in yellow in panel (i).Increasing the frequency of the sine function in Map (1) increases the oscillations’ frequency in state space,making the equilibrium point unstable and resulting in periodic or chaotic responses.
From the mathematical expressions point of view,several nonlinear terms can be used in chaotic maps’ design.The nonlinear terms can be logarithmic [11],sine powered [12,13],cosine polynomial [14],and higher-order polynomials[15].An endless and complicated intrinsic nonlinearity often exists in sinusoidal functions.As a result,chaotic maps have employed the sinusoidal function as a potential intrinsic nonlinearity.The sinusoidal function significantly impacts both pure and practical mathematics,as is widely recognized in the theoretical study.Sinusoidal functions also occur in science,physics,biology,engineering,and mathematics [16].Natural processes frequently exhibit repeated patterns that fit the definition of the sinusoidal function,as observed in light waves,ocean waves,sound waves,and other domains[12,13,17].
Moreover,chaotic maps can also be memristive,increasing complexity [18,19].Discrete memristors can be applied to one-dimensional and higher-dimensional maps with hyperchaos [20].A design technique for such maps with different dimensions was developed by Huang et al.in 2022[21].Such hyperchaotic maps have many applications and can exhibit attractive bursting oscillations [22] or various kinds of bifurcations [23,24].They have been successfully used in various fields like secure communication [25],reservoir computing [26,27],random signal generation[28],and temporal signal processing [29].Multi-stability is another feature that chaotic maps can possess [30].In multistable maps,the final result of a map with fixed parameters depends on the initial condition [31].In other words,the initial condition can control the map’s behavior and act as a bifurcation parameter [17].Hence,a minor disturbance in the initial condition can lead to a completely different outcome[32].This property enriches the map with more flexibility.
Chaos theory and cryptography constitute an essential field of information security [33].Chaos theory’s primary and critical motivation is the expression of order in disorder [34].An important feature that has caused this phenomenon to receive much attention in cryptography is the definability of the system in terms of its pseudo-random behavior,which makes the output of the system appear random from the attackers’ point of view,while it is definable from the point of view of the decryptor;therefore,it can be decoded [35].Chaotic maps are studied today as one of the most powerful tools in cryptography [36].Sensitivity to initial conditions and sensitivity to control parameters in chaotic maps are the main reasons for choosing these maps as the central pillar of encryption algorithms [37].
A newly designed one-dimensional chaotic map is reported in this paper.This map inherits its nonlinearity from trigonometric functions.Two versions of it are studied through the paper: with only a single sinusoidal function and a combination of two sinusoidal functions.The sinusoidal function is used in this work because it is one of the most often used nonlinear functions and is simple to create.Using a sinusoidal function is crucial since it ensures that the outputs of the suggested map are constrained for all parameter values.The rest of the paper is organized as follows: section 2 introduces the novel chaotic map and investigates the stability conditions of its equilibrium points.Different behaviors of the map are shown through time series,state space,and cobweb diagrams.Section 3 is dedicated to the comprehensive dynamical analysis of the map.The effect of parameters and initial condition variations on the map’s outcome are examined by one-dimensional and two-dimensional bifurcation diagrams and the Lyapunov exponent.The patterns in the two-dimensional bifurcation diagrams are highly spectacular and result from considerations made in the map’s design process.Finally,a brief conclusion of this paper’s main points and results is summarized in section 4.The numerical simulation results have been obtained by MATLAB R2021b software.
2.The proposed chaotic map
This section is divided into two distinct subsections concerning one version of the newly designed chaotic map.In each subsection,the map is introduced,the stability conditions of the equilibrium points are achieved,and its various dynamics are finally confirmed with time series,state space,and cobweb diagrams.
2.1.Chaotic map with a single sine function
The introduction of the novel chaotic map begins with a map with a single sine function.Its mathematical equation is as Map (1).In Map (1),A,ω1,andφrepresent the amplitude,frequency,and phase of the sinusoidal signal.
A map’s equilibrium points are its intersection points with the bisector of the first and third quarters.To ensure the stability of an equilibrium point in maps,the absolute slope of the map at that point must be less than one.This can be examined geometrically by observing the map’s curve and slope at the equilibrium point and by mathematical operations.The derivative of Map (1) toxnis as equation (2).This derivative indicates the slope of the map at every point.Since it includes a cosine function with an amplitude ofAω1,the value off′(xn)is always confnied between-Aω1andAω1.Applying the stability criteria of maps in equation (3),0 ≤Aω1<1ensures the stability of the equilibrium point.It should be noted that it demonstrates the worst case in which the value of the cosine function is equal to ±1.If its value is between ±1,the stability interval can be expanded.
Different dynamics of Map (1) can be achieved by changing the value ofAω1.In fgiure 1,the values ofAandφare kept fxied at one,and the value ofω1is the variable.The top,middle,and bottom panels depict state space,cobweb diagram,and time series of Map (1) with differentω1s.Red,blue,and black lines are the map,cobweb diagram,and bisector of the frist and third quarters.All initial conditions arex1=0.Withω1=1.3,as shown in panel (a),the slope of the map at the equilibrium point is negative and larger than-1,so as depicted in panels (d) and (g),the map’s dynamic converges to the equilibrium point.In this case,Aω1>1;however,the value of the cosine function at the equilibrium point is less than 1,thusAω1can exceed the limit mentioned earlier.By increasingω1,the sine function’s frequency also increases;consequently,there are more oscillations in any specific interval.Hence,when intersecting with the bisector,the map’s slope becomes steeper,making the equilibrium point unstable.The results of selectingω1as 2 and 3 are illustrated by panels (b) and (c).According to panels (e) and(h)ω1=2leads to a periodic (period 6) solution,and regarding panels (f) and (i)ω1=3results in a chaotic dynamic.By choosing another initial condition near zero asx1=0.001,the sensitivity to the initial condition can be detected in panel (i),in which yellow points demonstrate the new time series.
2.2.Chaotic map with a combination of two sine functions
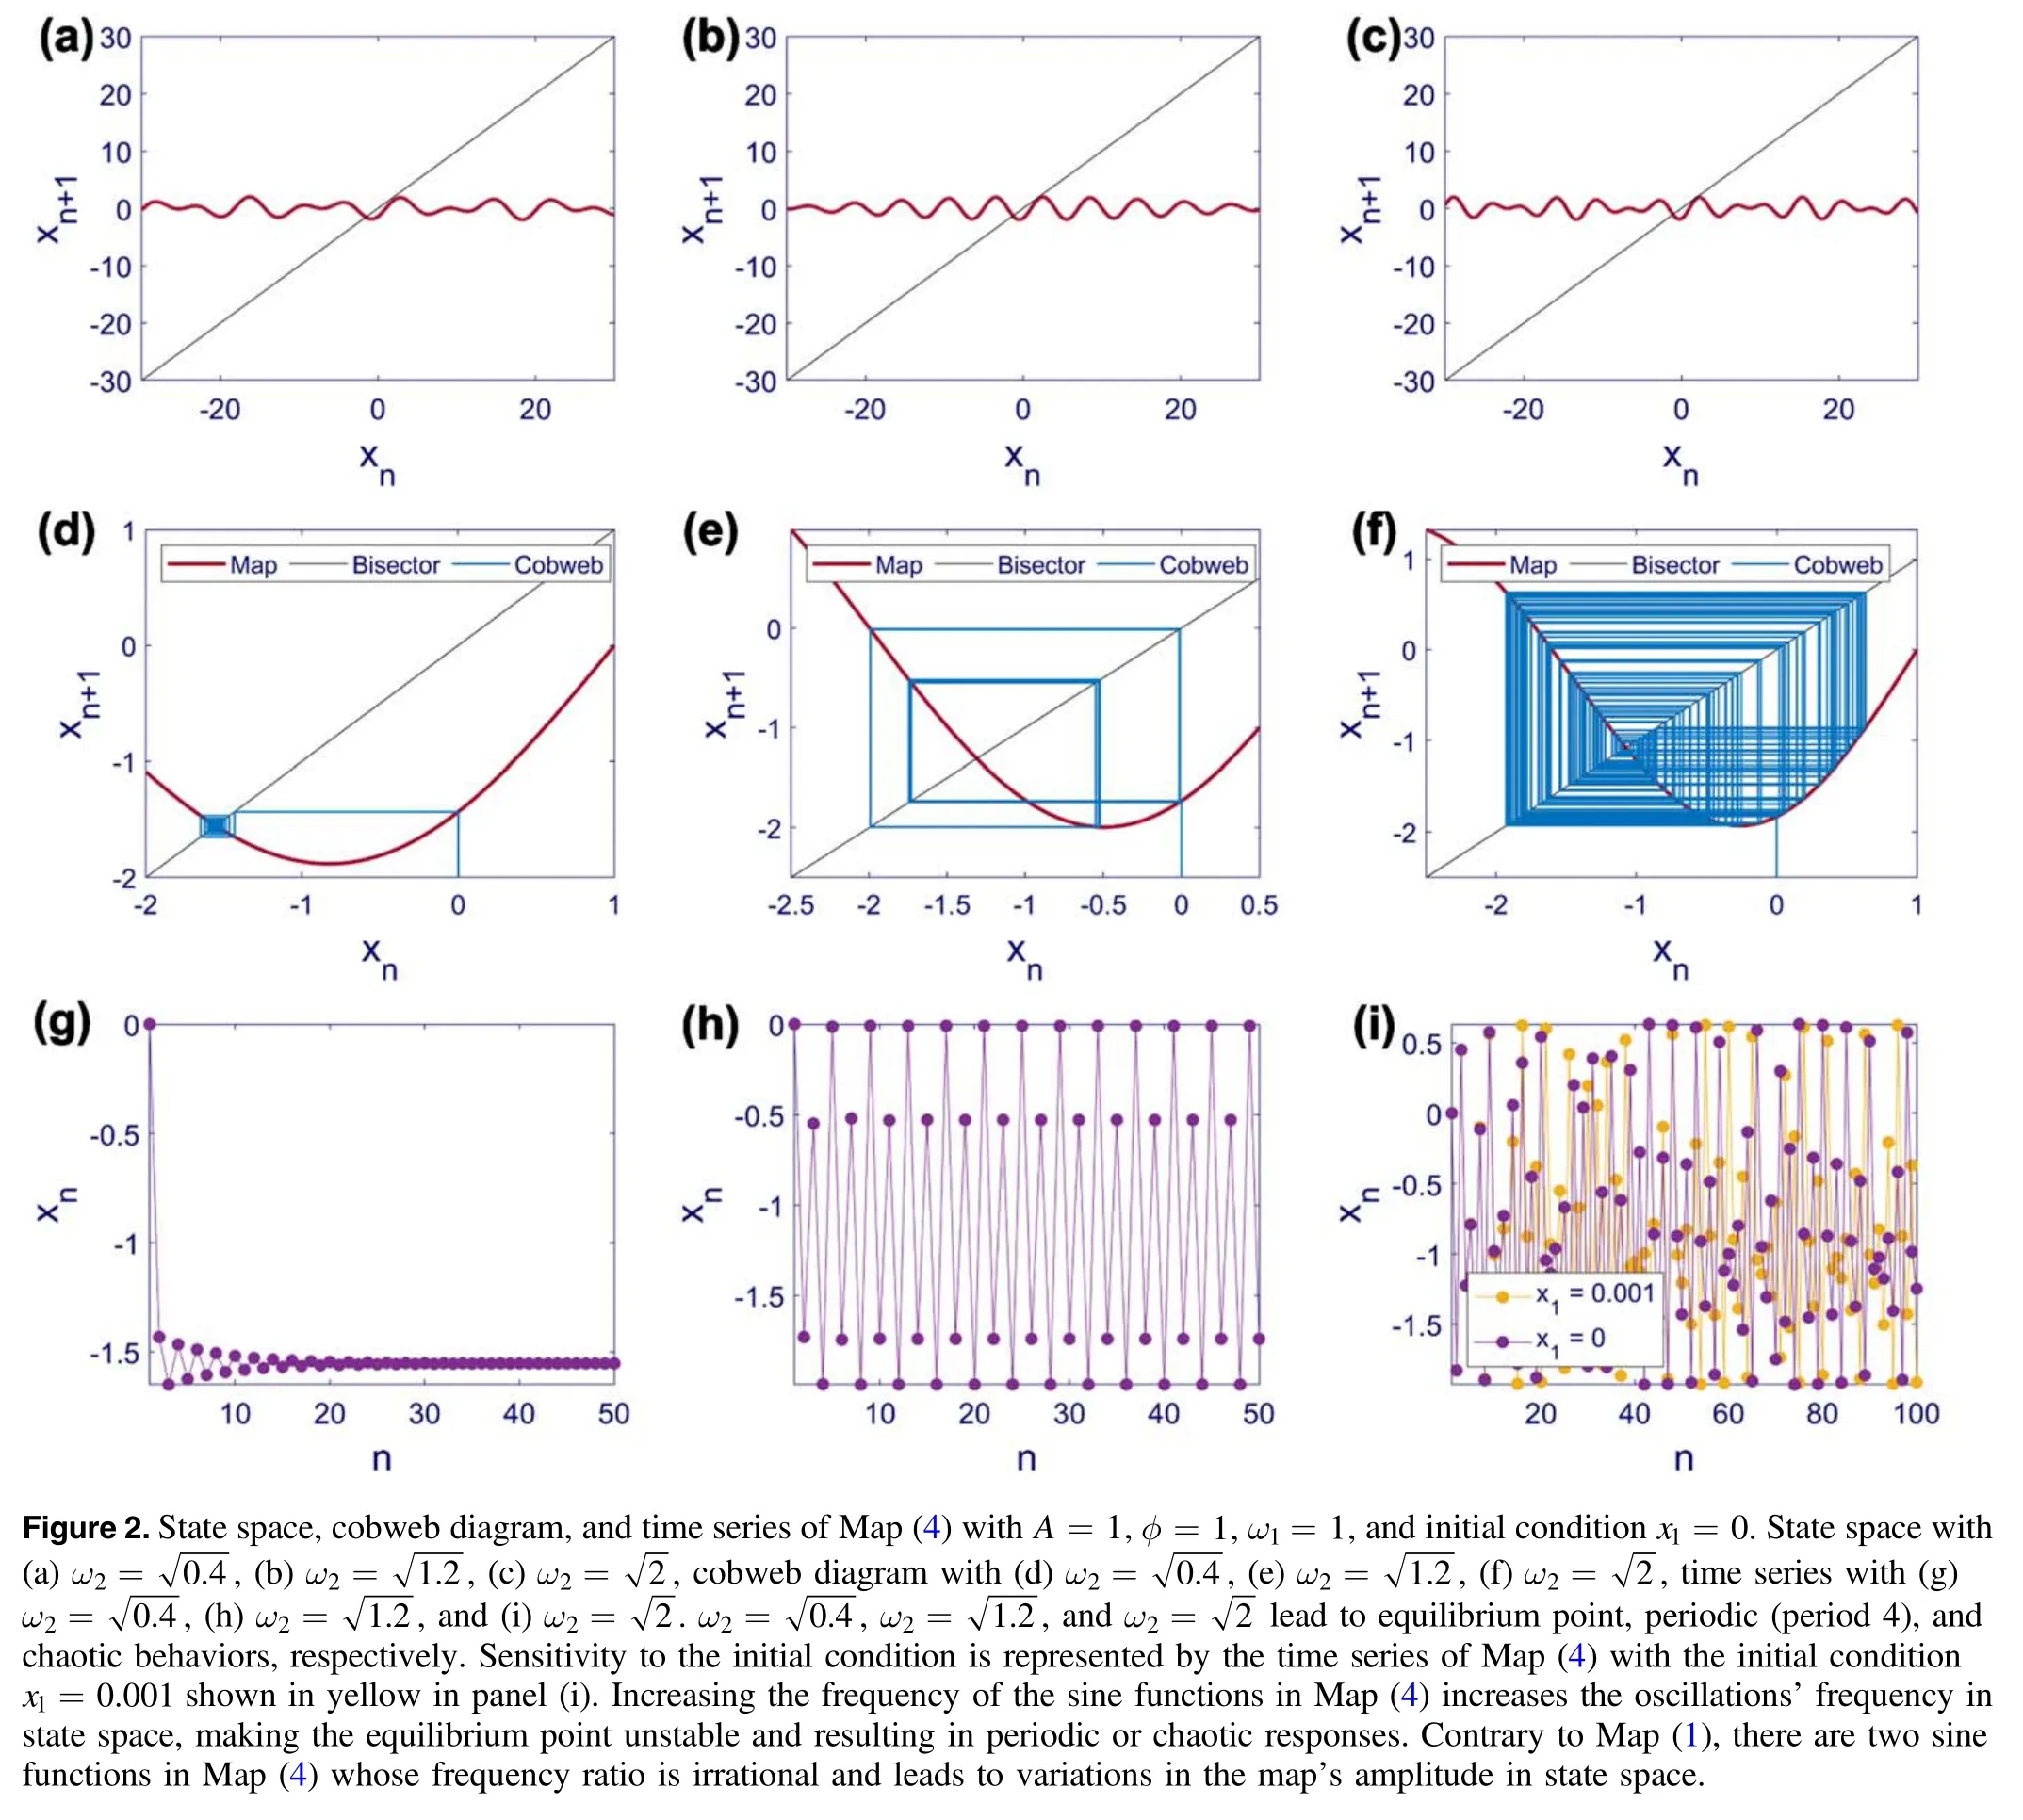
Combining two sine functions instead of one increases the map’s ability.The chaotic map combining two sine functions is written as Map (4).Map (4) is the sum of two sine functions with the same amplitude (A) and phase (φ),but their frequencies are different (ω1andω2).If the frequency ratio of the sine functions is irrational,the pattern of Map (4) is not periodic,and it is like a distorted signal.two cosine functions whose value can vary between-A(ω1+ω2)andA(ω1+ω2).Therefore,according to equation (6),selecting the parameters in the 0 ≤A(ω1+ω2)<1interval undoubtedly leads to a stable
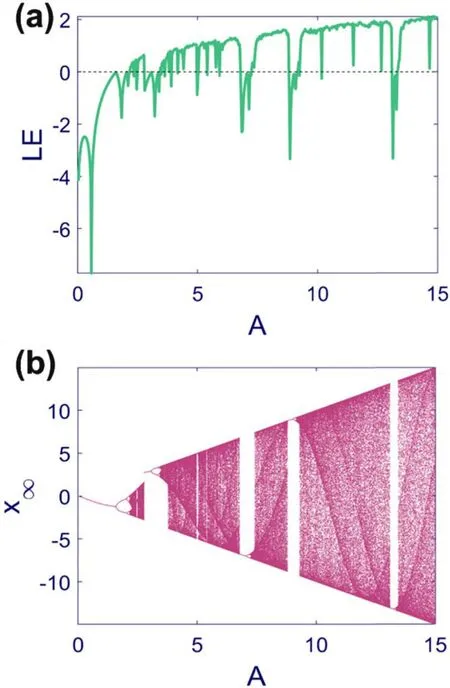
Figure 3.Lyapunov exponent spectra and bifurcation diagram of Map (1) with φ=1, ω1=1and initial condition x1=0in A ∈[0,15] .(a) Lyapunov exponent and (b) bifurcation diagram with the forward method.The map’s amplitude increases as the parameter A grows.Various equilibrium points,periodic and chaotic regimes are observed alongside periodic windows in the middle of chaotic regions.
Like Map (1),the stability conditions of Map (4) can be calculated.As equation (5),since there are two sine functions,the derivative of Map (4) toxnis the sum of equilibrium point.However it should be noticed that,like Map (1),this interval can be spanned depending on the value of the cosine functions.

Figure 4.Lyapunov exponent spectra and bifurcation diagram of Map (1) with A=1, φ=1,and initial condition x1=0in ω1 ∈[0,10] .(a) Lyapunov exponent and (b) bifurcation diagram with the forward method.The map’s frequency increases as the parameter ω1 grows but the map’s amplitude is confnied by the parameter A.Various equilibrium points,periodic and chaotic regimes are observed alongside periodic windows in the middle of chaotic regions.
The results of numerical simulations of Map (4) are portrayed in fgiure 2.The panels’ arrangement and colors are similar to fgiure 1.In this fgiure,the values ofA,φ,andω1are kept fxied at one,and the variable parameter isω2.All of the simulations are done by selecting the initial condition atx1=0,and the frequency ratio of the sine functions is irrational.Changing this ratio causes different dynamics in Map (4).Withω2=in panel (a),the map’s slope at the equilibrium point is negative but larger than −1,resulting in a stable equilibrium point.The convergence of Map (4) to the equilibrium point is shown in panels (d) and (g).As illustrated in panel (b),selecting a larger value forω2likeleads to a negative but smaller than -1 slope at the equilibrium point.This parameter makes the equilibrium point unstable and causes periodic (period 4) responses in panels (e) and (h).Eventually,Map (4),withω2=like panel (c),ends up with a chaotic dynamic in panels (f) and (i).The sensitivity to the initial condition in the chaotic oscillations is demonstrated in panel (i) by choosing another initial condition near zero atx1=0.001.It can be seen that although the initial conditions of both time series are very close,this minor difference causes diverse variations in time.
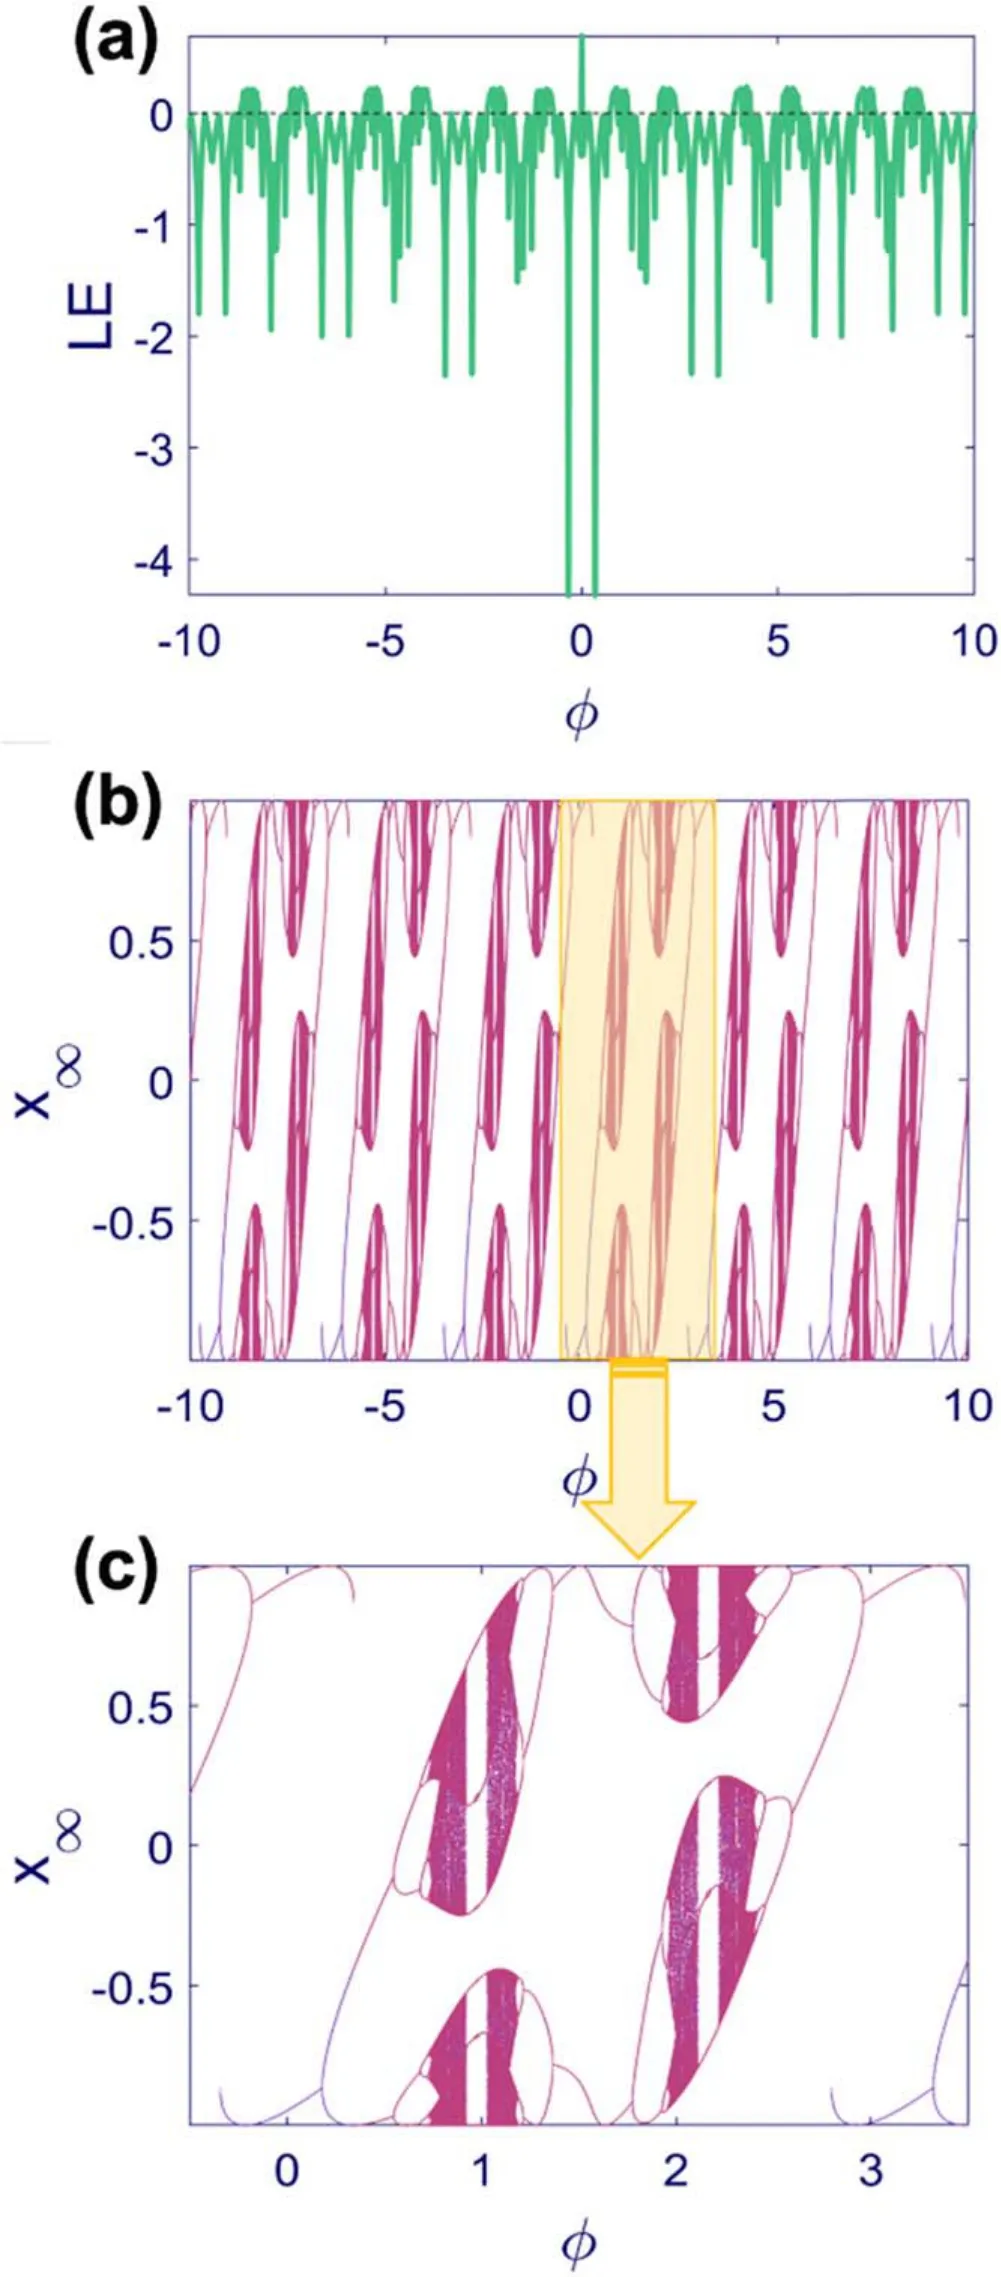
Figure 5.Lyapunov exponent spectra and bifurcation diagram of Map (1) with A=1, ω1=2,and initial condition x1=0.(a)Lyapunov exponent in φ ∈[- 10,10],(b) bifurcation diagram in φ ∈[- 10,10],and (c) bifurcation diagram in φ ∈[-0.5,3.5].The result of forward and backward methods in the bifurcation diagrams are represented by pink and purple points,respectively.The map shows a repetitive bifurcation diagram in which the pattern is repeated by changing the parameter φ and the map’s amplitude is confnied by the parameter A.One of the repeating patterns is depicted in panel (c).Such repetitive behavior affects the Lyapunov exponent as well.Various equilibrium points and periodic and chaotic regimes are observed alongside periodic windows in the middle of chaotic regions.
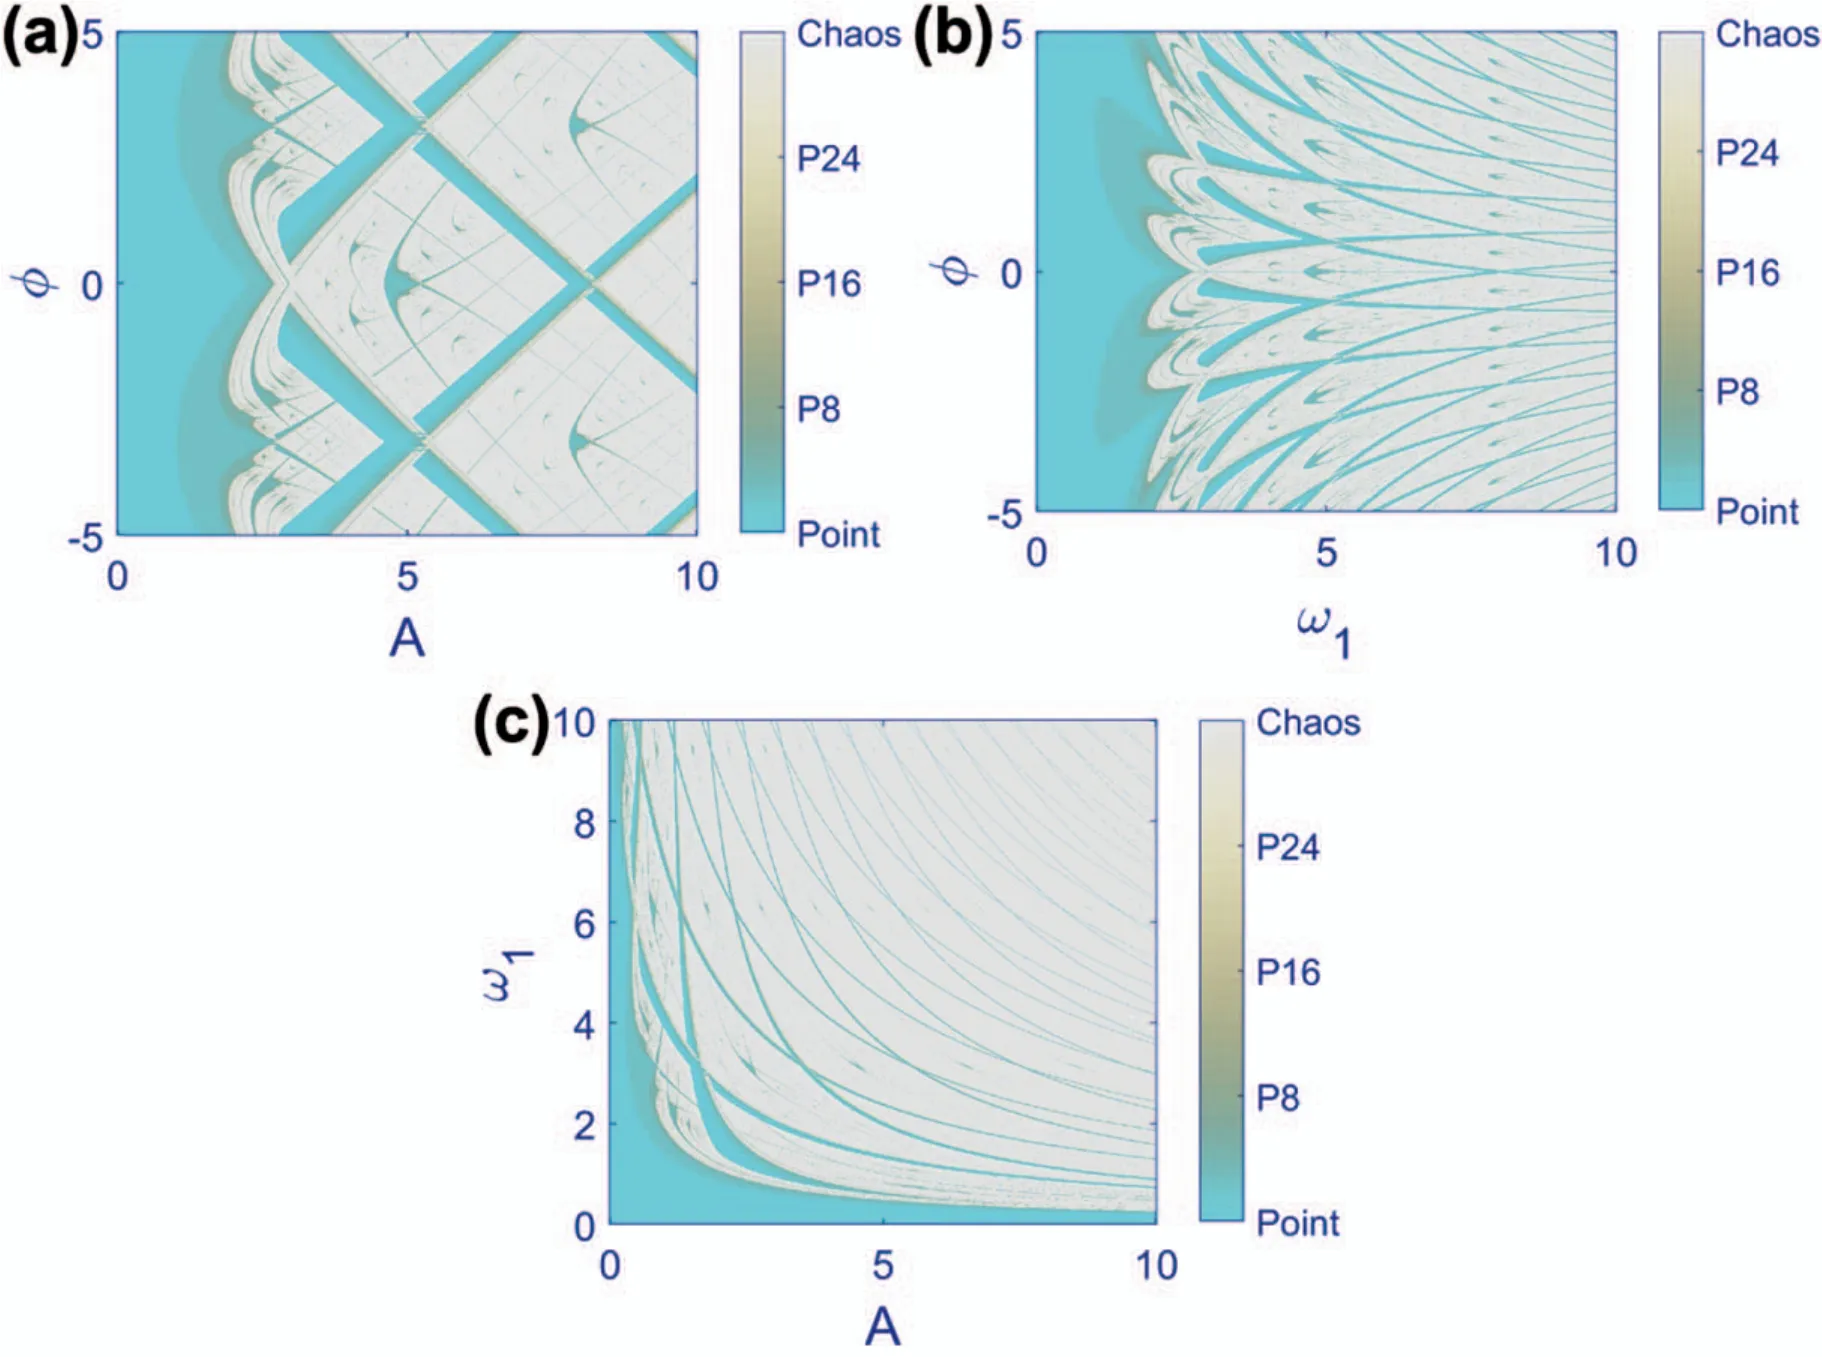
Figure 6.Two-dimensional bifurcation diagrams of Map (1) with initial condition x1=0.(a) ω1=1,A ∈[0,10],and φ ∈[-5,5],(b)A=1, ω1 ∈[0,10], and φ ∈[-5,5],and (c) φ=1,A ∈[0,10],and ω1 ∈[0,10].The results are obtained by simulating a 1000 ×1000 grid of parameters.Light blue and light gray points represent the fxied point and chaotic solutions.Colors in the middle of the color bar show periodic solutions.As the period of the periodic responses increases,the representative color tends to be less blue.
3.Dynamical analysis
This section entirely analyzes the dynamical behaviors of Map (1) and Map (4).The investigations involve onedimensional and two-dimensional bifurcation diagrams and the Lyapunov exponent spectra.The Lyapunov exponent of a one-dimensional map is calculated from equation (7) [38].In other words,its Lyapunov exponent is the limit of the average value for ln ∣f′(xn)∣overNiterations whenN→∞.Like the previous section,Map (1) and Map (4) are studied separately in the following subsections.
3.1.Chaotic map with a single sine function
Starting from Map (1),the parametersA,ω1,andφare studied individually and simultaneously.The Lyapunov exponent of a one-dimensional map is positive,zero,and negative in chaotic,period-doubling,and equilibrium point or periodic dynamics.Maps (1) and (4) can lead to different dynamics without changing none of their parameters and only varying their initial condition.These different dynamics are known as coexisting dynamics and symptoms of multi-stable behavior.Because of this characteristic,all used initial conditions are mentioned in the manuscript text and figure captions to ensure the reproducibility of the manuscript’s results.Additionally,as Maps (1) and (4) are multi-stable,a full bifurcation diagram is shown using both forward and backward approaches [39].The bifurcation parameter varies in the forward approach from minimum to maximum,and the initial condition of the following parameter is selected from the last sample of the previous parameter.The backward procedure is the term for the opposite approach.All bifurcation diagrams depict the forward technique’s results in pink while (if required) drawing the backward method’s results in purple.It should be mentioned thatx∞label on they-axis of bifurcation diagrams corresponds to the samples of the time series after convergence to the final dynamic.
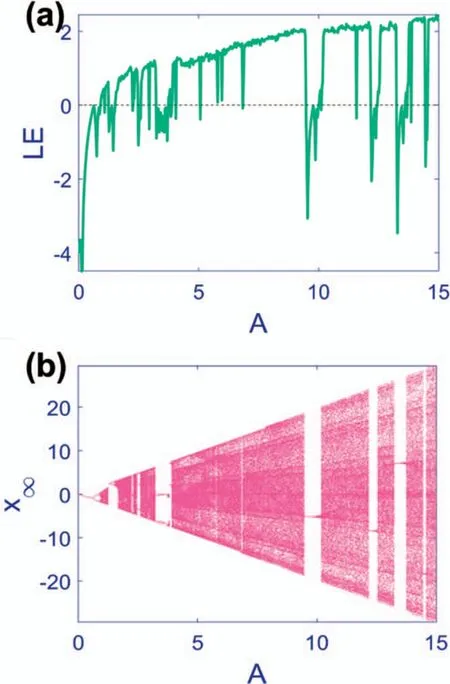
Figure 7.Lyapunov exponent spectra and bifurcation diagram of Map (4) with φ=1, ω1=1,ω2=,and initial condition x1=0 in A ∈[0,15].(a) Lyapunov exponent and (b) bifurcation diagram with the forward method.The map’s amplitude increases as parameter A grows.Various equilibrium points and periodic and chaotic regimes are observed alongside periodic windows in the middle of chaotic regions.
First,the amplitude of Map (1) is considered as the bifurcation parameter in [0,15] interval,and other parameters are fxied atφ=1 andω1=1.The Lyapunov exponent and the bifurcation diagram are depicted in figure 3.Because of the sine function in Map (1),the bifurcation diagram is confined between two values,and as the parameterAgrows,the amplitude of the map and hence the values of the bifurcation diagram increase.The period-doubling route to chaos can be detected.For small values ofAthe stability condition is satisfied,and the equilibrium point is stable.Nevertheless,after gradually growing parameterA,periodic and chaotic responses appear.Besides,periodic windows in the middle of chaotic regions are observable.The Lyapunov exponent is consistent with the behaviors discussed in the bifurcation diagram.
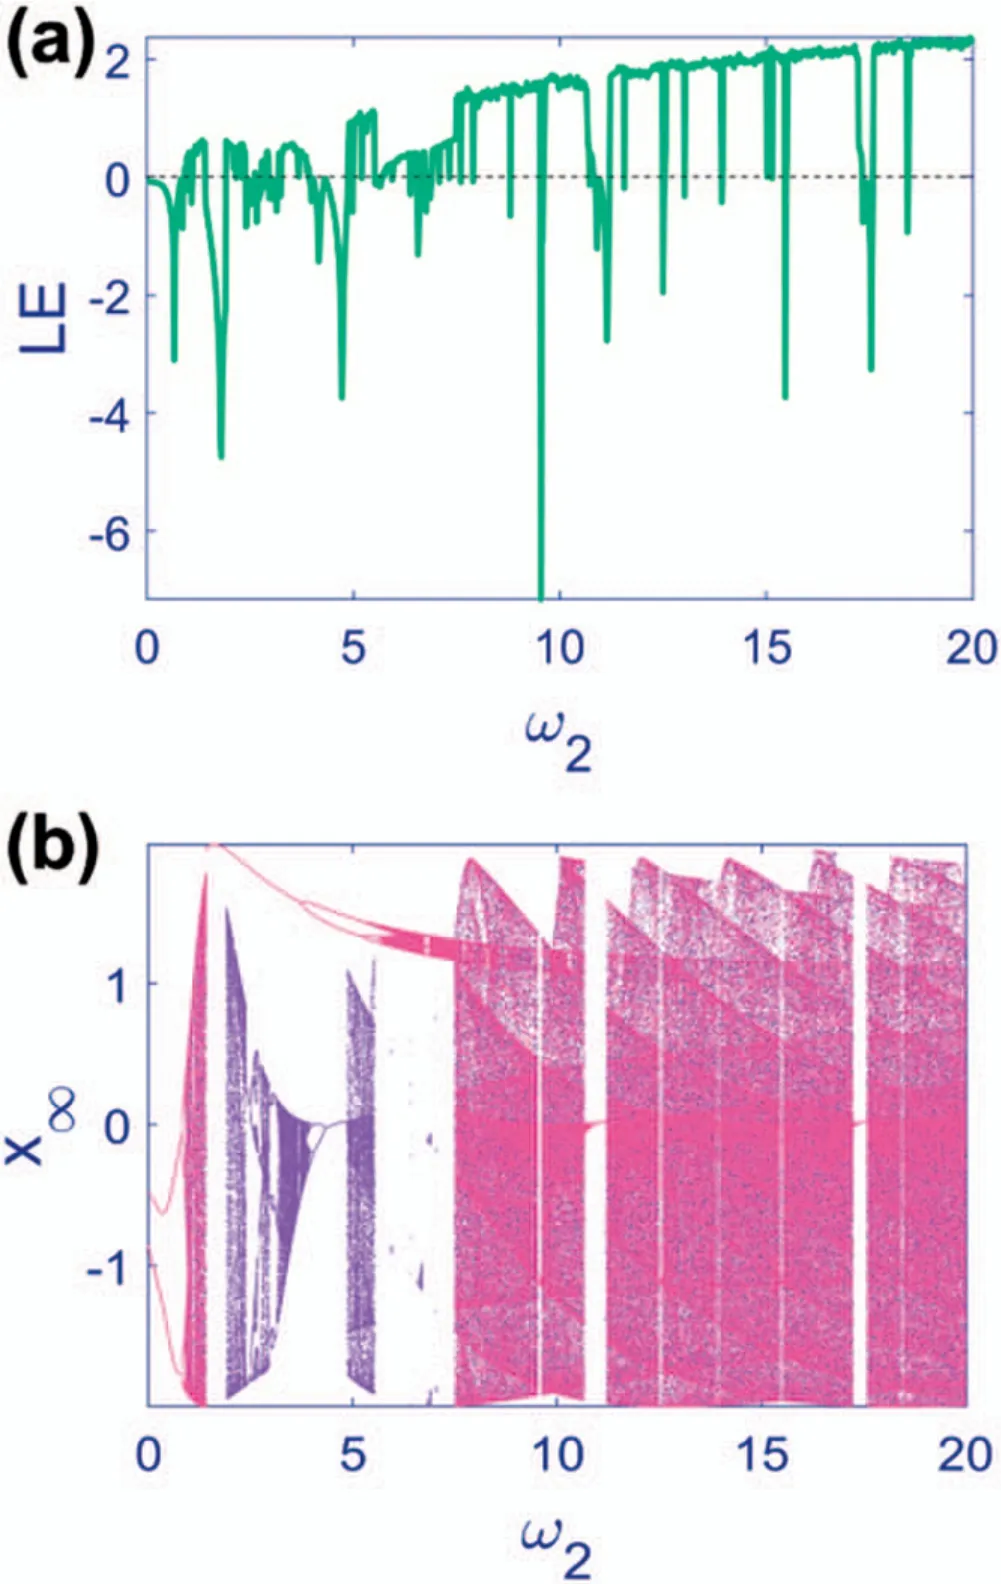
Figure 8.Lyapunov exponent spectra and bifurcation diagram of Map (4) with A=1, φ=1,ω1=and initial condition x1=0in ω2∈[0,20] .(a) Lyapunov exponent and (b) bifurcation diagram.Pink and purple points represent the result of forward and backward methods in the bifurcation diagram.The map’s frequency increases as the parameter ω2 grows,but the map’s amplitude is confnied by the parameter A.Various equilibrium points and periodic and chaotic regimes are observed alongside periodic windows in the middle of chaotic regions.
The Lyapunov exponent and bifurcation diagram of Map (1) while varyingω1in [0,10] and with constant parameters,A=1 andφ=1 are illustrated in fgiure 4.Contrary to fgiure 3,the amplitude of the samples in the bifurcation diagram is confnied with a fxied interval that does not change with the bifurcation parameter.Furthermore,in consistency with the results of fgiure 1,by increasing the value ofω1the period-doubling route to chaos occurs,and periodic windows in the chaotic zones are detectable.
The Lyapunov exponent and bifurcation diagram of Map (1) by changingφin [- 10,10] interval and constant parametersA=1 andω1=2are demonstrated in fgiure 5.Parameterφindicates the phase of Map (1) and acts as a shifting parameter.As shown in panel (b),a specifci repeating pattern of period-doubling and period-halving can be observed.One of these patterns is portrayed in panel (c),whereφ∈[- 0.5,3.5] .Panel (c) corresponds to the yellow box in panel (d).The Lyapunov exponent is also affected by this repetition.As can be inferred from panel (c),the coexisting dynamics shown in pink and purple are equilibrium points and periodic behaviors.
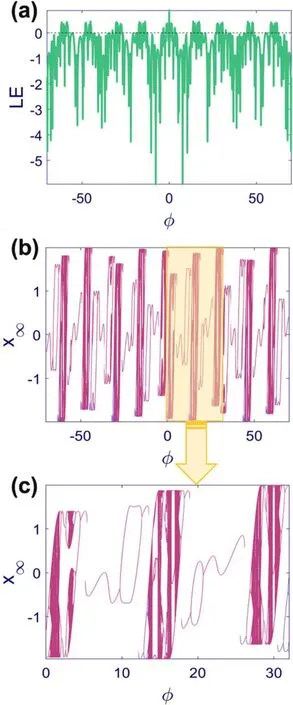
Figure 9.Lyapunov exponent spectra and bifurcation diagram of Map (4) with A=1, ω1=1,ω2=,and initial condition x1=0.(a) Lyapunov exponent in φ ∈[-7 0,70],(b) bifurcation diagram in φ ∈[- 70,70],and (c) bifurcation diagram in φ ∈[0,32].The bifurcation diagram’s forward,and backward methods results are represented by pink and purple points,respectively.The map shows a quasi-repetitive bifurcation diagram in which a pattern is repeated by changing the parameter φ,but the patterns are not similar.Three of these quasi-repeating patterns are depicted in panel (c).Contrary to Map (1),they are not identical,and their amplitude can vary.Such a quasi-repetitive behavior affects the Lyapunov exponent as well.Various equilibrium points and periodic and chaotic regimes are observed alongside periodic windows in the middle of chaotic regions.
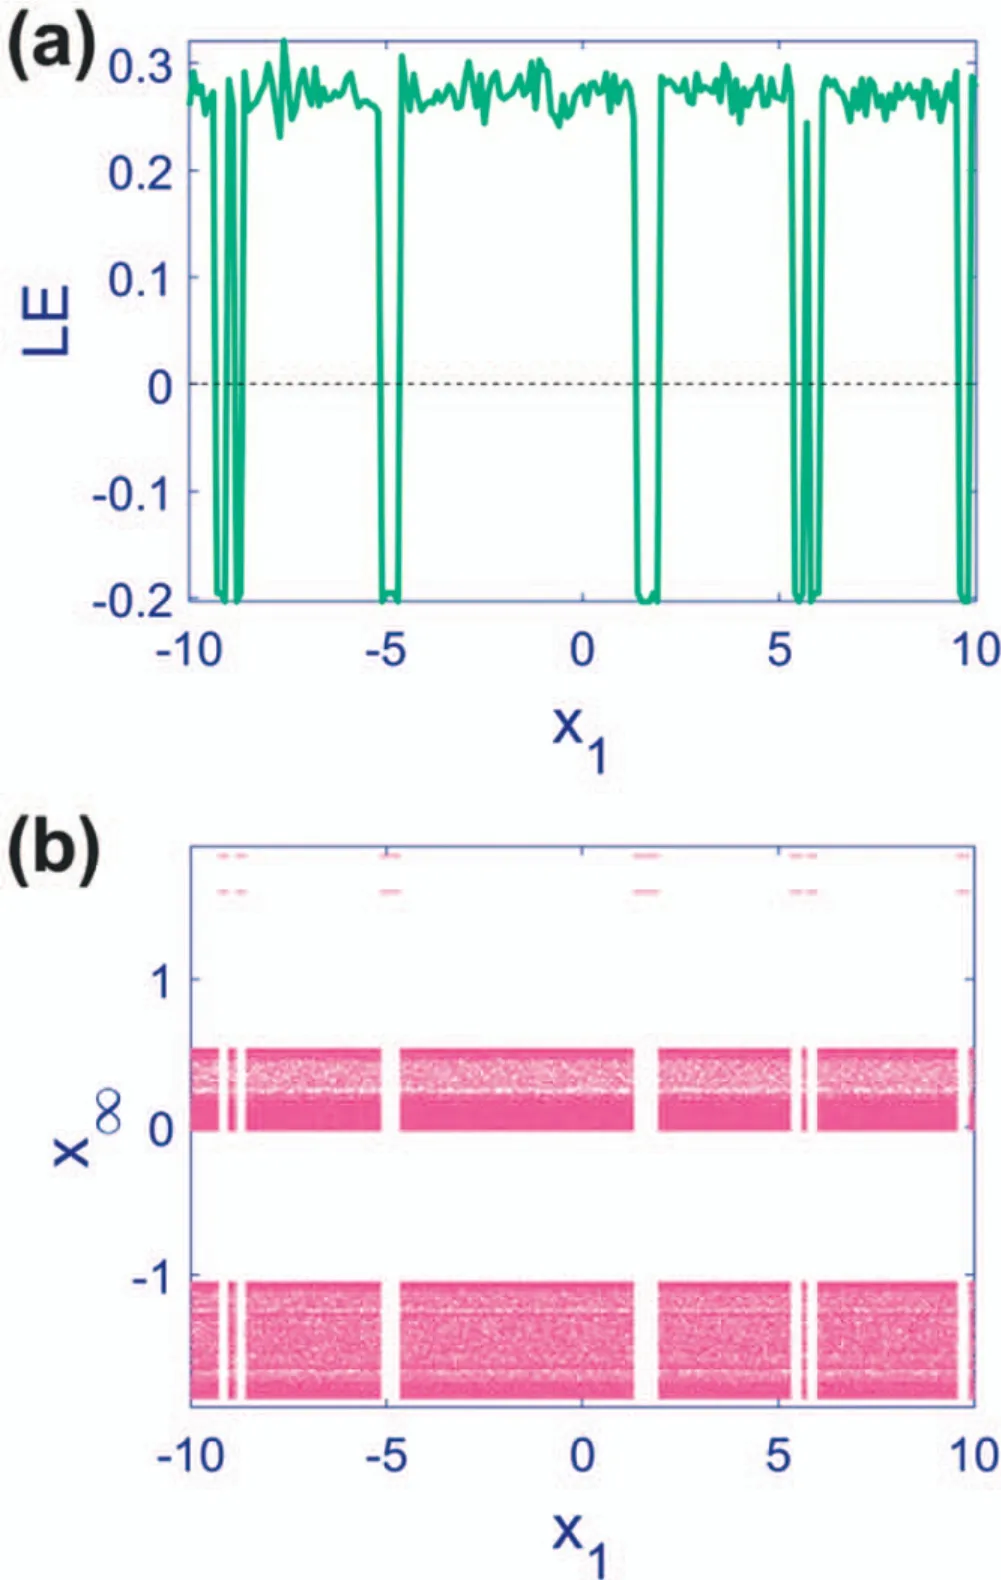
Figure 10.Lyapunov exponent spectra and bifurcation diagram of Map (4) with A=1, φ=1, ω1=3,ω2=,and initial condition x1 ∈[-1 0,10].(a) Lyapunov exponent and (b) bifurcation diagram.The map switches between coexisting periodic and chaotic solutions repetitively.The initial condition acts as the bifurcation parameter,the symptom of multi-stability.
A study of the mutual effect of parameters on Map (1) is worthwhile.The results of mutually changing two parameters are shown in figure 6.Due to the physical meaning of the parameters,Aandω1are always chosen at a positive value,butφcan be negative.In panels (a),(b),and (c),the constant parameter isω1=1,A=1,andφ=1.The initial condition is kept unchanged atx1=0,and a grid of 1000 ×1000 parameters is used to obtain this fgiure.Equilibrium points are plotted in light blue,and chaotic dynamics are drawn in light gray.Moreover,there are periodic results with different periods;their representative colors are in the middle of the color bar and depend on the period numbers.For small values ofAandω1,the resultant dynamic is convergence to the equilibrium point.However,by increasing these parameters,chaotic dynamics dominate.As discussed earlier,parameterφcauses similarity in the observed patterns that is detectable in panels (a) and (b).This effect makes the two-dimensional bifurcation diagrams more spectacular.

Figure 11.Cobweb diagrams and phase portraits of Map (4) with A=1, φ=1, ω1=3,andω2= .(a) and (c) chaotic behavior with x1=1and (b) and (d) periodic behavior with x1=1.5.The uncountable points in panel (c) correspond to chaotic outcomes,and the two points in panel (d) are associated with a period-2 dynamic.
3.2.Chaotic map with a combination of two sine functions
Combining two sine functions in Map (4) causes more flexibility and the emergence of exciting characteristics.Like the previous subsection,the parameters are changed one by one and then as a pair.Furthermore,by drawing a bifurcation diagram based on the initial condition,the multistability of this map is confirmed.The Lyapunov exponent and bifurcation diagram of Map (4) withφ=1,ω1=1,ω2=,and varyingAin [0,15]is depicted in fgiure 7.Like Map (1),the amplitude of the samples in the bifurcation diagram directly grows withA.Nevertheless,because of the distorted signal seen in fgiure 2,the map does not precisely act periodically,and this causes the darker lines in the bifurcation diagram.In Map (1),all these lines overlap on the maximum and minimum limit of the amplitude,but in Map (4),they are distributed between the limits.A stable equilibrium point is detected in small values ofA,and by choosing a larger value,the period-doubling route to chaos takes place.Also,periodic windows are observable.
The Lyapunov exponent and bifurcation diagram of Map (4) withA=1,φ=1,ω1=and changingω2in[0,20] are illustrated in fgiure 8.Since this bifurcation diagram showed a signifciant dependence on the initial condition,both techniques’ outcomes are shown in different colors in panel (b).For small values ofω2The equilibrium points or periodic solutions in the forward method correspond to the chaotic solutions in the backward method.The Lyapunov exponent diagram is consistent with the results of the backward method.Moreover,the frequency ratio is always irrational;consequently,the amplitude of the chaotic samples is not constant and seems distorted.
The Lyapunov exponent and bifurcation diagram of Map (4) withA=1,ω1=1,ω2=and varyingφin[- 70,70] are demonstrated in fgiure 9.Compared to figure 5,the patterns in the bifurcation diagram are not identical.For instance,three of these patterns corresponding to the yellow box in panel (b) are drawn in panel (c) withφ∈[0,32] .Besides,Map (4) acts as an odd function ofφ,and the results of negative values ofφare the results of the positive values with the reverse sign.It should be mentioned that there was a kind of symmetry in the repeating pattern of figure 5,which is now substituted by more complicated patterns.Both period-doubling and period-halving routes are detectable,and the Lyapunov exponent approves the bifurcation diagram.Like figure 5,different colors in the bifurcation diagrams highlight the coexisting equilibrium points and periodic dynamics.
After reporting the infulence of parameter variations on the map’s output,the effect of the initial condition should be studied too.Lyapunov exponent and bifurcation diagram of Map (4) withA=1,φ=1,ω1=3,ω2=and changingx1in [- 10,10] are portrayed in fgiure 10.The prior bifurcation diagrams revealed the signs of coexisting attractors and,consequently,multi-stability,which are confirmed.The coexistence of periodic and chaotic dynamics is switched in Map (4) with the same set of parameters and the initial condition changing.This switching can be observed in the abrupt changes of the Lyapunov exponent between positive and negative values.
To better visualize the multi-stability of Map (4),two different initial conditions are chosen asx1=1andx1=1.5 from the chaotic and periodic regions of fgiure 10.The phase portraits and cobweb diagrams of Map (4) withA=1,φ=1,ω1=3,andω2=are illustrated in fgiure 11.The frist and second columns of this fgiure correspond to the results ofx1=1andx1=1.5.The pattern of the cobweb diagrams and phase portraits completely agree with the results of fgiure 10.Forx1=1Map (4) behaves chaotically,represented by numerous purple dots in panel (c).On the other hand,forx1=1.5Map (4)’s periodic behavior is inferred from two purple points in panel (d).In other words,the number of points in the bottom row equals the intersections between the map and the cobweb diagram.
Finally,the dynamical analysis is completed by plotting the two-dimensional bifurcation diagrams of Map (4) in figure 12.Alongside the parameter planes of fgiure 6,theω1-ω2plane is added as panel (d).Initial conditions,number of parameter pairs,and the meaning of different colors are like fgiure 6.In each panel,there are two variables and two constant parameters.The constant parameters of different panels are (a)ω1=1andω2=,(b)ω1=andφ=1,(c)A=1 andω1=,and (d)A=1 andφ=1.The stability condition is satisfied for small amplitude and frequency values;therefore,most of the diagram is colored light blue in those values.Nevertheless,by increasing the value of each of them,chaotic behaviors dominate.The patterns seen in the two-dimensional bifurcation diagrams of Map (4) are more complex than Map (1),making them more attractive.
4.Discussion and conclusion
In this paper,a novel one-dimensional chaotic map was designed that consists of sinusoidal functions.First,the map was studied using only a single sine function,and then its abilities were expanded by adding another sine function with the same amplitude and phase but a different frequency.The irrational frequency ratio of the two sine functions resulted in the classic sinusoidal signal deformation and enriched its dynamics.Both maps’ stability conditions were obtained depending on the amplitude and the sum of frequencies.The equilibrium point was stable for small amplitude and frequency values,and by increasing their values,the perioddoubling route to chaos occurred.The amplitude of the maps was controlled byA,and the phase parameter (φ) acted as a horizontal shifting parameter.In the map with only a single sine function,the patterns in the bifurcation diagram regardingφwere identical.However,these patterns were not similar in the map consisting of two sine functions.The presence of coexisting periodic and chaotic attractors was proven by drawing a bifurcation diagram following the initial condition.Some spectacular two-dimensional bifurcation diagrams were observed for both maps,but the shapes were more complicated in the combined map.In conclusion,due to the multi-stability,unordinary behavior with irrational frequency ratio,and low simulation and computation cost,the newly proposed map can be applied in many engineering and digital fields like image encryption [1,2,8,9,11–14,36,37,40].Besides,since chaotic maps can be used as random number generators,their chaotic sequence can be taken as the latent variable instead of random noise.Consequently,the proposed chaotic map can also be applied to chaotic auxiliary classifier generative adversarial networks (ACGANs) [41].
Acknowledgments
This work was funded by the Centre for Nonlinear Systems,Chennai Institute of Technology,India [grant number CIT/CNS/2023/RP/008].
Declaration of interest statement
The authors declare that they have no known competing financial interests or personal relationships that could have appeared to influence the work reported in this paper.
ORCID iDs
杂志排行
Communications in Theoretical Physics的其它文章
- Graphical representations and worm algorithms for the O(N) spin model
- Insight into the magnetic behavior and magnetocaloric effect of a borophene monolayer
- Flocking and clustering in mixtures of selfpropelled particles with or without active reorientation
- Vibrational resonance in a multistable system with position-dependent mass
- Nonequilibrium kinetics effects in Richtmyer–Meshkov instability and reshock processes
- AC magnetic trap for cold paramagnetic molecules
