Least-squares reverse time migration in visco-acoustic media based on symplectic stereo-modeling method
2023-12-06LIJingshuangZHANGXiangjiaHEXijunandZHOUYanjie
LI Jingshuang, ZHANG Xiangjia, HE Xijun and ZHOU Yanjie
1. School of Science, China University of Mining and Technology, Beijing 100083, China;
2. School of Mathematics and Statistics, Beijing Technology and Business University, Beijing 100048, China
Abstract: The authors proposed a symplectic stereo-modeling method (SSM) in the Birkhoffian dynamics and apply it to the visco-acoustic least-squares reverse time migration (LSRTM).The SSM adopts stereo-modeling operator in space and symplectic Runge-Kutta scheme in time, resulting in great ability in suppressing numerical dispersion and long-time computing.These advantages are further confirmed by numerical dispersion analysis, long-time computation test and computational efficiency comparison.After these theoretical analyses and experiments, acoustic and visco-acoustic LSRTM are tested and compared between SSM method and the conventional symplectic method (CSM) using the fault and marmousi models.Meanwhile, dynamic source encoding and exponential decay moving average gradients method are adopted to reduce the computation cost and improve the convergence rate.The imaging results show that LSRTM based on visco-acoustic wave equations effectively takes into account the influence of viscosity can therefore compensate for the amplitude attenuation.Besides, SSM method not only has high numerical accuracy and computational efficiency, but also performs effectively in LSRTM.
Keywords: least-squares reverse time migration; visco-acoustic equation; Birkhoffian dynamic; symplectic stereo-modeling; dynamic source encoding
Introduction
Seismic exploration technology is at the central position in geophysical oil and gas exploration.The numerical simulation method is a crucial tool to study the seismic wave propagation law and image subsurface medium.With the increasing complexity of seismic exploration targets, the requirement of imaging accuracy of complex structures becomes higher.Data and experiments both demonstrate that the subsurface medium is fairly viscoelastic, especially when it contains holes, cavities, seams, or oil and gas accumulation zones.Conventional seismic imaging methods can no longer meet the current exploration needs.Because of the inherent viscosity of the earth medium, it is of great significance to develop the exploration methods and migration techniques based on viscous wave equations, which can simulate the seismic wave propagation more accurately and improve the resolution of seismic imaging.Least-squares reverse time migration (LSRTM) based on inversion theory is the development of seismic imaging theory from conventional geometric structure description to amplitude preserving imaging.By reducing the waveform mismatch between the synthetic and observed datasets, LSRTM provides the subsurface image with a higher resolution and more accurate amplitude attribute.It is the current trend and research hotspot in imaging technology.
Tarantola (1984) first proposed the idea of leastsquares migration.Lebras and Clayton (1988), Lambareet al.(1992) have refined it by using the steepest descent method to invert the velocity perturbation relative to the background velocity.Daiet al.(2011)introduce reverse time migration (RTM) into leastsquares migration based on the acoustic wave equation.In order to effectively account for the influence of viscosity, Dutta and Schuster (2014) recommended accounting for the migration results of medium viscosity using LSRTM.In view of the fact that underground media exhibit viscoelastic behavior, Dutta and Schuster (2014) proposed to use the LSRTM to compensate the migration results, which can effectively avoid the instability of the RTM and compensate the influence of the viscosity.Liet al.(2014) discussed LSRTM in visco-acoustic media,which can effectively suppress imaging noise and compensate for weak illumination regions.Quet al.(2019) corrected the viscoelasticity and anisotropy in LSRTM, and improved the accuracy of the migration results.
The key progress of LSRTM is solving the fullwave equations.Finite difference (FD) methods are widely used in geophysics because of its low memory requirement, fast computation and easy parallelism(Alfordet al., 1974; Kellyet al., 1976; Dablain,1986).The FD methods are applied to solve all kinds of wave equations including the acoustic and elastic wave equations (Robertssonet al.,1994; Blanch& Robertsson, 1997; Zhanget al., 1999; Takeuchi& Geller, 2000; Chang & Liu, 2013).However,traditional FD methods like Lax-Wendroffcorrection(LWC) method often generate severe numerical dispersion under coarse grids or in the medium having large velocity contrast (Feiet al., 1995).Usually, a high-order scheme or finer spatial grids can be used to suppress the numerical dispersion.Unfortunately, due to their large increases in computing cost and memory utilization, neither alternative is usually sufficient.Yanget al.(2003, 2006, 2012) developed the stereomodeling (STEM) methods to solve the acoustic and elastic wave equations.In contrast to the traditional approaches (Dablain, 1986; Blanc & Robertsson,1997), the STEM methods simultaneously use the displacement and its gradients to approximate the high-order spatial partial derivatives, which lead to the effective suppressing of the numerical dispersion.When applied to RTM, the STEM methods are proved to be more effective than the conventional FD methods(Liet al., 2013, 2015).
The symplecticity is an intrinsic structure of the Hamiltonian dynamics and is preserved while the dynamics evolve over time.The time integrators that preserve symplecticity during iterations are called symplectic methods (Feng & Qin, 2010; Liet al., 2011,2012).Conventional schemes that are not symplectic might accumulate large errors over a long period simulation, which cause the artificial dissipation and distortion of the system (Liet al., 2011).Feng and Qin(2010) developed a theory of numerical integration of Hamiltonian based on symplectic geometry.Qin and Zhang (1990) proposed the Hamiltonian formulation of the wave equation and suggested several multistage schemes in the time domain.Liet al.(2011, 2012)suggested another temporally third-order symplectic partitioned Runge–Kutta (SPRK) scheme.Maet al.(2010, 2011) combined the STEM method with SPRK schemes to obtain the NSPRK method for solving acoustic and elastic wave equations numerically.Wang(2012) applied the STEM method to the visco-acoustic wave equation within the framework of the Birkhoffian dynamics, which is a generation of the Hamiltonian dynamics.Yanget al.(2013) developed a symplectic stereo-modeling method (SSM) in Birkhoffian dynamics for solving elastic wave equations in porous media.
In this work, a new LSRTM based on SSM in visco-acoustic media is proposed.Firstly, the theory of LSRTM is derived from the constant density viscoacoustic wave equation in the time domain.Secondly,the construction of the SSM is presented and the properties of SSM are analyzed, including numerical dispersion analysis, computational efficiency comparison and long-time computing test.Finally, a few synthetic data examples are demonstrated, in which the dynamic source encoding method and the exponential decay moving average gradients method are utilized to improve the convergence speed.In the end, a short conclusion is provided.
1 LSRTM in visco-acoustic media
We use the commonly used two-dimensional visco-acoustic wave equation (Deng & McMechan,2007; Yan & Liu, 2013):
wherex= (x,z) indicates the spatial position,s(xs,t)represents a point source function atx=xs,u0(x,t) is the background wavefield,v0(x)is background velocity,is the absorption coefficient for dominant frequencyfdand quality factorQ(Futterman,1962).
In order to derive the Born approximation corresponding to the visco-acoustic wave equation (1), a small perturbationv0(x)δ v(x) is applied to the background velocityv0(x), and correspondingly, a small perturbationδ u(x,t) is generated in the background wavefieldu0(x,t).By replacing the backgroundv0(x),andu0(x,t) with the disturbed velocityv(x) =v0(x)+δ v(x) and wavefieldu(x,t) =u0(x,t) +δ u(x,t) in Eq.(1), and using Taylor’s approximation with the omitting of the higher order terms, the following equation can be obtained:
The Born approximation of the visco-acoustic wave equation (1) can be obtained according to Eq.(1) and Eq.(3) as follows
In LSRTM process, the Eq.(3) is commonly expressed as the matrix-vector operationdcal=Lm,wheredcalis the synthetic data andLis a linear modeling operator.For LSRTM, themis sought to minimize the misfit function (Dutta & Schuster, 2014):
wheredobsrepresents the observed dataset.
The back-projected wavefieldqcan be computed by reverse time propagation:
whered cal(xg,t;xs) andd obs(xg,t;xs) represent the synthetic data and observed data at the geophone locationx=xgfor a source atx=xs, respectively.
Finally, the reflectivity image can be iteratively estimated using the steepest descent method (Nemethet al.,1999):
wherekis the iteration index,dkandαrepresent the gradient and step length, respectively (Chen, 2020).
2 Symplectic stereo-modeling method
In this section, we briefly derive the SSM algorithm used in our LSRTM.For the sake of simplicity,we rewrite Eq.(1) as follows
we can get the following Birkhoffian dynamics:
We utilize the Lobatto IIIA-IIIB scheme (Sun,1997), a second-order symplectic partitioned Runge-Kutta method for solving the Birkhoffian dynamics(11):
where ∆tis the time step size,,L1,sis the spatial discretization ofL1.The detail construction of visco-acoustic wave equation (10) as Birkhoffian dynamics and the proof of symplecticity of Eq.(12) are presented in Appendix A.
We can obtain the SSM by using Eq.(12) and the fourth-order STEM to approximate the partial spatial derivatives inL1(Yanget al., 2006).For example, the fourth-order precision approximation ofis as follows:
For comparison, the conventional symplectic method (CSM) that has the same time marching scheme as the SSM is also proposed.It discretizes the spatial derivatives with the fourth-order scheme in the work proposed by Dablain (Dablain, 1986).The fourth-order precision format ofis as follows:
2.1 Numerical dispersion analysis and computational efficiency comparison
Numerical dispersion causes the numerical phase velocity varies with the frequency of seismic wave that do not actually exist.Following the analysis in Moczoet al.(2000), we investigate the numerical dispersion of SSM and CSM for solving the viscoacoustic wave equation.We measure the numerical dispersion with the ratio, in whichv0andvnumrepresent the real and numerical velocity, respectively.The closerRis to 1, the smaller the numerical dispersion.The numerical dispersion relation of SSM is in Appendix B.Fig.1 shows the numerical dispersion curves of the proposed SSM (Fig.1a) and CSM(Fig.1b) for different Courant numbersα=0.1, 0.2,0.3 and 0.4, with the parametersv= 4 km/s,Q= 80,∆x=∆z= 0.01 km, andfd= 20 Hz.From Fig.1 we could see that the maximum errors of phase velocity associated with SSM and CSM are approximately 9%and 26%, respectively.This suggests SSM can suppress numerical dispersion more effectively than CSM.
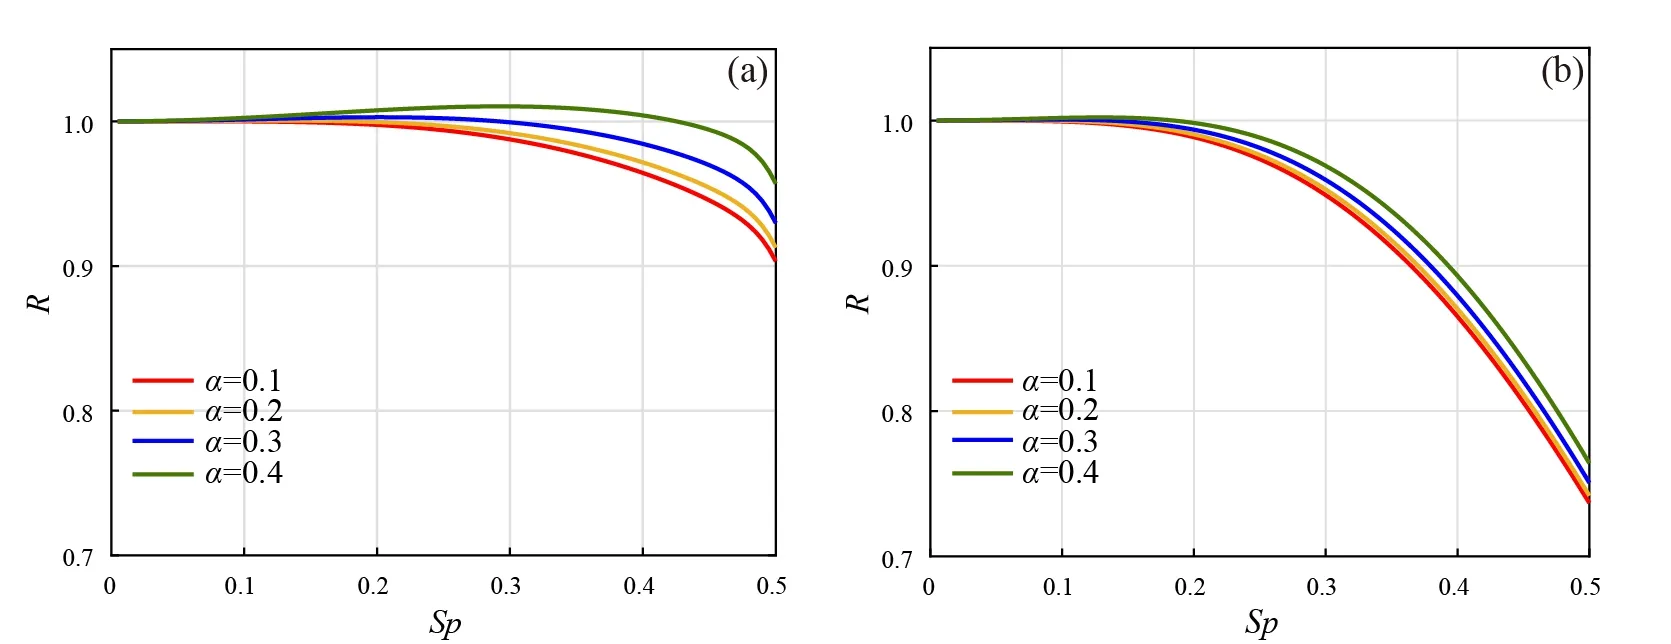
Fig.1 Numerical dispersion curves of SSM (a) and CSM (b) at different Courant numbers
Next, we investigate the numerical dispersion of the SSM and CSM by comparing the waveforms and snapshots.In this experiment, we use a simple homogeneous media case: the velocityv=4 km/s,Q=80, the Courant number, and the computing area is 0 ≤x,z≤ 10 km.The source with a central frequencyf0= 20 Hz is located at the center of the area.For all the experiments in this paper, the source wavelet formulated as Eq.(15) is used and the dominant frequencyfdin Eq.(1) is selected to be equal tof0.
Fig.2a,b show the snapshots at 1.08 s with coarse grids (∆x=∆z= 0.05 km).The snapshot obtained by CSM (Fig.2b) has serious numerical dispersion,while the snapshot obtained by SSM (Fig.2a) has almost no visible numerical dispersion.Fig.2d,e demonstrate the comparison between the waveforms extracted from Fig.2a,b with the analytic solution which was presented by Carcioneet al.(1988).As shown in the Fig.2d,e, the numerical solution obtained using SSM agrees very well with the analytical solution, whereas the one obtained by CSM does not.To eliminate the numerical dispersion, the grid size for CSM is refined to 0.025 km while the other parameters and the Courant number remain unchanged.In this case, we get Fig.2c that is a clear snapshot similar to Fig.2a.However, the CPU time and the storage space to get Fig.2a and 2c are totally different.To keep the computational area still, the grid number of Fig.2c is increased from 201×201 to 401×401.Considering the number of arrays that the two methods need to store, the storage requirement of SSM is approximately 75.4% of CSM for such a simple test.However, it takes 7.37 s and 15 s to obtain Fig.2a, c, respectively.Therefore, the computing speed of the SSM is approximately 2 times of the CSM for the same numerical accuracy.The detail comparison is shown in Table 1.

Table 1 Comparison of computational cost for SSM and CSM
2.2 Long-time computing experiments
To test the long-time computational ability of SSM, we choose a one-dimensional homogenous model and the parameters arev=4 km/s, ∆t= 0.002 s,x∆ = 0.02 km, and the record timeT= 80 s.The source wavelet withf0= 25 Hz is located at the center of the computational domain.In order to exclude other interference factors and retain time scheme as only one variable, we choose SSM and the STEM (Yanget al.,2006) which have the same spatial discretization for comparison.The relative energy defined by the following Eq.(16) is computed by the two methods and shown in Fig.3.
Fig.3a shows SSM that use a symplectic time scheme can maintain the energy stable after long-time computation.However, there is a significant energy fluctuation in Fig.3b obtained by STEM that uses fourth order Taylor expansion as time scheme after long-time computation.This test confirms the longtime computation ability of SSM.
3 LSRTM tests
In this section, we test the effectiveness of SSM and CSM for forward modeling and LSRTM using different models.In all the tests, the convolutional perfectly matched layer (CPML) absorbing boundary condition (Li & Matar,2009) is employed to absorb the reflections.
3.1 Fault model
We first use the fault model presented in Fig.4 to test the SSM and CSM methods.The grid number is 210×90, the quality factorQfor the first and second layer is 30 and 60, and the velocity is 1.6 km/s and 2.3 km/s, respectively.The spatial grid interval is 0.01 km,and the time step is 0.000 6 s.The source withf0= 30 Hz is located at (1.05 km, 0.02 km) and the recording time is 1.56 s.
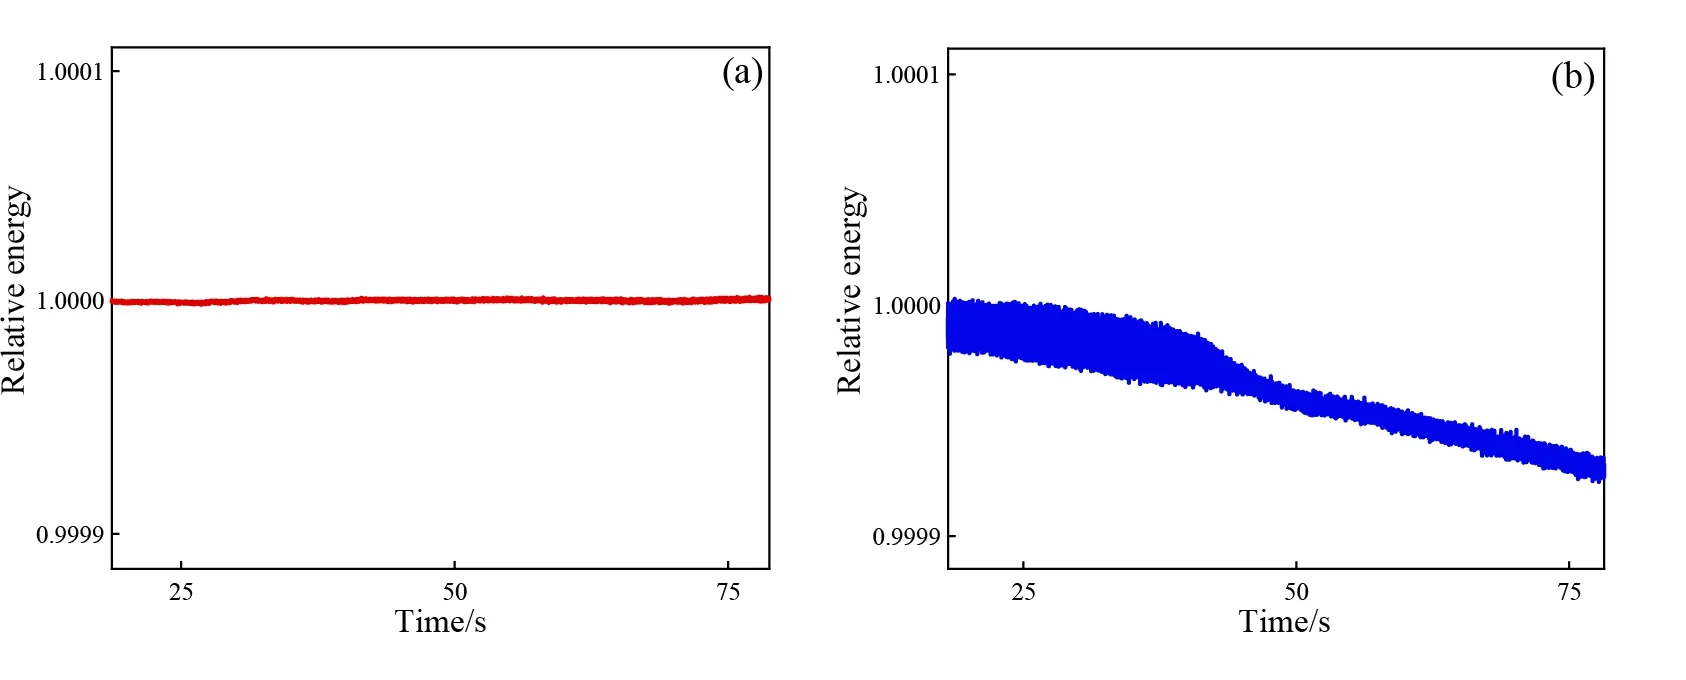
Fig.3 Relative energy in acoustic medium calculated with SSM (a) and STEM (b)
Fig.5 present the synthetic seismograms produced by the SSM and the CSM based on the acoustic and visco-acoustic wave equations.Fig.5b,d show the strong attenuation of the visco-acoustic wavefield compared with the acoustic wavefield in Fig.5a,c.Furthermore,we could observe serious numerical dispersion on Figs.5c,d generated by CSM, whereas the seismograms obtained by SSM (Fig.5a,b) have no visible numerical dispersion.We extract one trace at distance ofx= 1.75 km from each seismogram in Fig.5, with the results plotted in Fig.6a and the spectrum of the traces obtained by SSM plotted in Fig.6b.Fig.5,6 proves that the wavefield energy is strongly attenuated in the visco-acoustic media.At the same time, the SSM can suppress numerical dispersion more effectively than CSM.
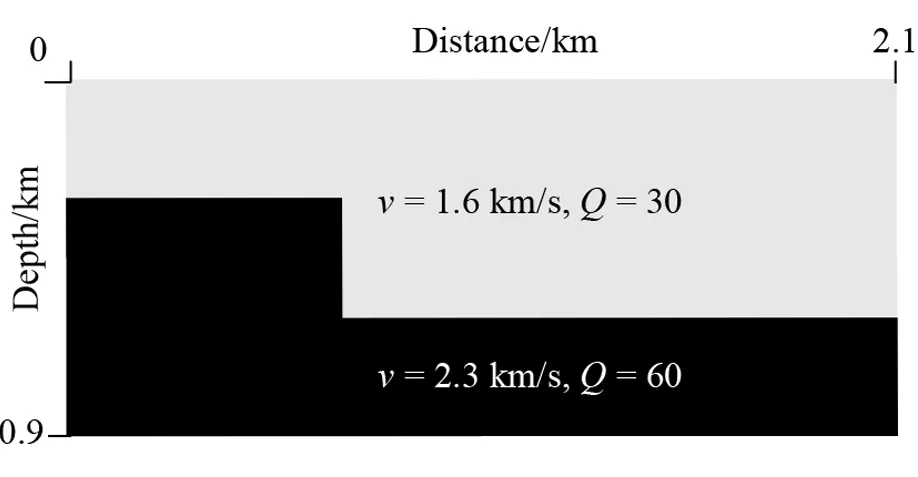
Fig.4 A fault model
Next, the LSRTM test based on SSM is performed using the fault model with the parameters unchanged, except that thef0is changed to 15 Hz.We use Gaussian smoothing to obtain the perturbed velocity model.There are 41 shots in total with an equal space of 0.05 km starting fromx= 0.56 km.The receivers are located on the surface grids for each shot.Fig.7 presents the images at 1st(Fig.7a,b) and 10th(Fig.7c,d)iterations for acoustic (Fig.7a,c) and visco-acoustic(Fig.7b,d) LSRTM.For both acoustic and viscoacoustic LSRTM, as the number of iterations increases,the amplitude increases significantly, and the data residuals decrease gradually and converge steadily (see the convergence curves in Fig.8b).Fig.7c and Fig.7d both clearly show a horizontal structure, a vertical fault, and an accurate stratigraphic position, whereas visco-acoustic LSRTM has larger amplitude (Fig.7d).This can be detected more clearly in Fig.8a, which shows the traces at the distancex= 0.74 km extracted from Fig.7c,d.According to Fig.8, the visco-acoustic LSRTM can get images with higher resolution, and the residuals go down even faster, compared to the acoustic LSRTM.
3.2 Marmousi model
The drawback of LSRTM is its large number of iterations and significant computation cost.In this test, we use the dynamic source encoding method to form a super shot from all shots.Besides, we apply the exponential decay moving average gradients method (ISGD) to correct the current gradient(Moghaddam, 2013), which can effectively reduce the computational effort of LSRTM and improve the convergence speed.The gradient at thekthiteration is modified by the history of the gradients taken into account as bellow:

Fig.5 Synthetic seismograms for shot in middle of surface

Fig.6 Traces extracted from Fig.5 (a) and spectrum from Fig.5a,b (b)
Whered(i)is the gradient obtained by direct calculation of Eq.(8) at theithiteration,nis the number of earlier steps.Taking into account both the effectiveness and efficiency,ntakes 10.The exponential weightingε= 0.4 (Li, 2016).
The LSRTM based on SSM is performed on the Marmousi model with the velocity andQparameters shown in Fig.9.The velocity ranges from 1.5 km/s to 5.9 km/s, andQis computed by the empirical relation as follows:
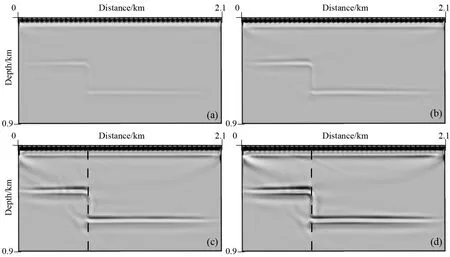
Fig.7 LSRTM image results of fault model

Fig.8 Comparison of trace records extracted from Fig.7c,d (a) and normalized data residues corresponding to number of iterations (b)

Fig.9 Marmousi model
Therefore, the range ofQis 34.2-688.4 for the Marmousi model.The grid number is 461×301, the grid interval is 0.01 km and the time step is 0.000 6 s.We placed 432 shots withf0= 15 Hz at a depth of 0.02 km, with a 0.01 km space interval starting from the location ofx= 0.15 km.The receivers are located on the surface grid for each shot.
Fig.10 show the LSRTM results based on acoustic and visco-acoustic wave equations for 1stand 80thiterations.Comparing the results for 1st (Fig.10a,b)and 80th (Fig.10c,d) iterations, we could see that the resolution is improved as the number of iterations increases.Comparing the acoustic (Fig.10a,c) and visco-acoustic (Fig.10b,d) LSRTM results, it can be seen that the visco-acoustic LSRTM image is clearer and has larger amplitude, because the viscous effect is compensated.In this experiment, compared with 80×432 iterations needed for LSRTM, only 80 iterations are needed for the LSRTM with source coding method, which greatly improves the computational efficiency.In addition, the LSRTM with source coding also saves computation, compared with 432 calculations of conventional RTM.
4 Conclusion
In this paper, we propose a finite difference method called SSM in the Birkhoffian dynamics and apply it to the visco-acoustic LSRTM.Compared with the CSM, the SSM that adopts STEM operator in space and symplectic Runge-Kutta scheme in time has higher numerical accuracy and computational efficiency.The numerical dispersion analysis demonstrates that the maximum errors of phase velocity associated with SSM and CSM are approximately 9%and 26%, respectively.For a simple test, the storage space of SSM is about 75.4% of CSM and the computation speed is 2 times of the CSM.Furthermore,the long-time computing experiment shows that the
SSM can conserve the energy.SSM performs effectively in LSRTM on Marmousi model and the visco-acoustic LSRTM achieves higher resolution images and faster drop of residuals than the acoustic LSRTM.Besides, using the dynamic source encoding in LSRTM greatly improves the computational effi-ciency.
APPENDIX A.Proof of symplecticity
The Birkhoffian system is formulated as (Sun &Shang, 2005):
wherez=[z1,z2,...,zn]T,F(z,t) =(F1(z,t),F2(z,t),...,F2n(z,t))T,B(z,t)is called Birkhoffian.Letbe the matrix in the system, Eq.(A1)can be transformed into
whereK(z,t) =(Kij(z,t))2n×2n, satisfiesK=KT.Eq.(A2) is a Birkhoffian system.
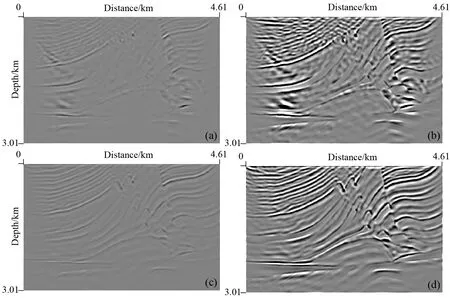
Fig.10 LSRTM image results of Marmousi model with dynamic source encoding
For the two-dimensional viscous-acoustic wave equation (Eq.(10)), with both sides of the equation multiplied byert, we can get Eq.(A3),
Extract the functionYfrom Eq.(A3),
According to integration by parts, we can get
Substitute Eq.(A5) into Eq.(A4),
Now constructB,z, which satisfies the Birkhoffian system form
From Eq.(A8), we can get
Then, we can get Eq.(A9),
Introducing the gradients ofu,pand defining, we can obtain a generalized Birkhoffian system containing gradient information
the i-th component ofp,uiis the i-th component ofu.
Applying the Lobatto IIIA-IIIB scheme (Sun, 1997),a second-order symplectic partitioned Runge-Kutta method to the system (A12), we get Eq.(12).
Now we prove scheme Eq.(12) is a symplectic scheme.Defining, and the recurrence equation can be obtained from Eq.(12):
Taking the partial derivative of Eq.(A13) with respect tozn, we get Eq.(14)
Then, we can get
Thus, Eq.(A15) satisfies the definition of symplecticity (Santilli, 1983), and Eq.(12) is a symplectic scheme.
APPENDIX B.Numerical dispersion relation
In this appendix, we present the numerical dispersion relation of SSM for the two-dimensional case.The harmonic solution is formulated as bellows(Yanget al., 2006):
Wherekx,kzare the components of the wavenumber vectork~,ωnumis the complex angular frequency.
whereϕrepresents the angle between the direction of wave propagation and the positivex-axis, ranging from 0≤ϕ≤2 π.kr,kiare the real part and imaginary part ofk~.Substituting Eqs.(B1) and (B2) into the numerical scheme of the SSM method (Eq.(12)), we can get:
whereGis the growth matrix.From Eq.(B3), we can get the numerical dispersion relation of SSM for solving the visco-acoustic wave equation:
From Eq.(B4), we could find that matrixGand matrixhave the same eigenvalues, so the eigenvalues of the latter can be obtained by calculating the eigenvalues of matrixG.Then, we can obtain the calculation result ofωnum, whileωnumhas the following relationship with the numerical wave velocityvnum.
For a determinedαandSp, the ratioRcan be obtained by findingωnum t∆.Eq.(B6) shows that ifRis 1, there is no numerical dispersion when using the format, while a larger |R-1| indicates a more severe numerical dispersion.
杂志排行
Global Geology的其它文章
- Exploring the first occurrence of Scincomorpha lizard from Nenjiang Formation (lower Campanian) of Jilin, Northeast China: a follow-up study
- Optimization design of conical reaction teeth of shear wave vibroseis vibration plate
- Characteristics and identification of weathering crust of Pennsylvanian volcanic rocks in Shixi area, Junggar Basin
- Geochemical characteristics of temperature and pressure of Paleozoic reservoir fluid inclusions in Xuanjing region,Lower Yangtze area
- Change of cultivated land area and effect on ecosystem service in black soil region in Northeast China:a case study of Lishu County, Jilin Province
