CFD analysis of a CiADS fuel assembly during the steam generator tube rupture accident based on the LBEsteamEulerFoam
2023-12-05YunXiangLiLuMengSongLiZiNanHuangDiSiWangBoLiuYouPengZhangTianJiPengLuZhangXingKangSuWeiJiang
Yun‑Xiang Li · Lu Meng · Song Li · Zi‑Nan Huang · Di‑Si Wang · Bo Liu · You‑Peng Zhang · Tian‑Ji Peng ·Lu Zhang · Xing‑Kang Su · Wei Jiang
Abstract Steam generator tube rupture (SGTR) accident is an important scenario needed to be considered in the safety analysis of lead-based fast reactors.When the steam generator tube breaks close to the main pump, water vapor will enter the reactor core, resulting in a two-phase flow of heavy liquid metal and water vapor in fuel assemblies.The thermal-hydraulic problems caused by the SGTR accident may seriously threaten reactor core’s safety performance.In this paper, the open-source CFD calculation software OpenFOAM was used to encapsulate the improved Euler method into the self-developed solver LBEsteamEulerFoam.By changing different heating boundary conditions and inlet coolant types, the two-phase flow in the fuel assembly with different inlet gas content was simulated under various accident conditions.The calculation results show that the water vapor may accumulate in edge and corner channels.With the increase in inlet water vapor content, outlet coolant velocity increases gradually.When the inlet water vapor content is more than 15%, the outlet coolant temperature rises sharply with strong temperature fluctuation.When the inlet water vapor content is in the range of 5–20%, the upper part of the fuel assembly will gradually accumulate to form large bubbles.Compared with the VOF method, Euler method has higher computational efficiency.However, Euler method may cause an underestimation of the void fraction, so it still needs to be calibrated with future experimental data of the two-phase flow in fuel assembly.
Keywords Steam generator tube rupture · CiADS · CFD simulations · Two-phase flow
1 Introduction
In 2002, six advanced nuclear energy systems including lead-based fast reactors (LFRs) were formally established as Gen-IV reactors [1].The structure of lead-based fast reactors has been significantly simplified compared to that of other reactors [2].Lead-based fast reactors have advantages,such as good nuclear fuel transmutation capability, excellent economics, and inherent safety [3].Therefore, many countries have invested significant research and development efforts.China approved the China Initiative Accelerator Driven System (CiADS) in 2015 [4].The CiADS consists of three subsystems: accelerator, spallation target, and reactor [5, 6].The reactor is a subcritical fast neutron reactor cooled by the liquid lead–bismuth alloy.The steam generator (SG) is the kernel component of the core heat transfer in reactor systems.LFRs usually adopt a pool structure design in which the core, main pumps, and steam generators are immersed together in the primary vessel coolant [7].This design separates the pressurized water in the secondary loop from the liquid lead–bismuth only through the wall of the heat transfer tube of the steam generator.Simultaneously,many tube bundles were implemented to enhance the heat exchange capability inside the tube bundles.Moreover,there are large pressure and temperature differences on both sides of the tubes, which may cause significant thermal and mechanical stresses on the tube wall.Owing to the vibration and corrosion of the coolant in the first and second circuits,the heat transfer tube may be the weakest part of the primary circuit system [8].Therefore, the possibility of steam generator tube rupture cannot be ignored.
When the steam generator pipe breaks, the high-pressure subcooled water in the secondary circuit is injected into the low-pressure and high-temperature liquid lead bismuth in the primary circuit.High-pressure subcooled water quickly vaporizes into steam, thereby forming a two-phase liquid metal-steam two-phase flow [9].Currently, international research on steam generator tube rupture (SGTR) accidents in lead-based reactors is at an early stage.Relevant experimental studies have been conducted on the interaction mechanism between water and liquid metals.Sibamoto et al.[10] designed a probe that can simultaneously measure the temperature and phase state of a liquid metal–water–vapor multiphase flow.The cavity formation process of water in liquid metal, cavity surface mode boiling, and temperature distribution of the multiphase flow were investigated.Sa et al.[11] built an experimental device for dripping molten liquid metal into water and studied the steam explosion reaction mechanism between water and a lead–bismuth alloy in an SGTR accident.Later, Sa et al.[12] used an alcohol solution to simulate a water medium and a fluorinated liquid working medium to simulate liquid lead–bismuth and conducted an experiment on alcohol injection into a hightemperature fluorinated liquid.They also simulated the boiling phenomenon of direct contact between water and hightemperature liquid metal in an SGTR accident.Dostal et al.[13] built a direct-contact boiling circuit for water and liquid lead–bismuth and studied the heat transfer behavior of twophase boiling.Huang et al.[14, 15] conducted experiments on the contact fragmentation of high-temperature lead–bismuth droplets and liquid columns with subcooled water on a platform where molten metal and water interact.Deng et al.[16] conducted numerous experiments to inject water lumps into a molten lead pool at the Sun Yat-sen University.
Owing to the radiation-shielding property of lead–bismuth, the image of the two-phase flow pattern detected by gamma rays is unclear [17].Therefore, numerical calculations were used to simulate two-phase and multiphase flow problems in SGTR accidents.Wang et al.[18] used the safety analysis program SIMMER-III to evaluate the pressure evolution of a steam generator tube rupture accident, the migration of water vapor in the primary circuit,and the possibility of entering the core.Ciampichetti et al.[19] used SIMMER-III to simulate the interaction between high-pressure water and liquid lead during an SGTR accident and conducted a preliminary assessment of the pressure change of the covering gas in the vessel and the possibility of water vapor entering the core after the accident.Zhixing et al.[20] simulated a breakdown accident of the upper and lower heads of a heat exchanger in a small forced circulation lead–bismuth cooled reactor.The results showed that a small amount of steam migrated into the core under the fracture condition of the lower head.Dinh’s study showed that when the steam generator is ruptured near the main pump, water vapor is bound to the core by lead–bismuth, and there is a large amount of water vapor in the active zone [9].Such conditions cause changes in the reactivity of the fuel rods in the core, leading to the deterioration of heat transfer and endangering the safety of the reactor.Therefore, it is important to study the two-phase flow in fuel assemblies during SGTR accidents.Because it is difficult to use X-ray devices to study the internal flow field characteristics of fuel assemblies in lead-based reactors [21], certain thermal-hydraulic parameters were obtained from numerical simulations.Gu et al.[22] developed the multi-physics field coupling program MPC-LBE, which can perform thermal-hydraulic analyses for LBE cooling-pool reactor types.Liu et al.[23]performed calculations for five turbulent Prandtl number models and accurately predicted the heat transfer characteristics of low-Prandtl number fluids in fuel assembly rod bundle subchannels.Yunxiang et al.[24] used thek-ω SST model to study single-phase flow fields in lead-based reactors.Zhou et al.[25] calculated the friction pressure drop inside a wire-wound rod bundle using eight different models, and the results showed that the friction coefficient was related to parameters such as the number of rod bundles and knot diameter ratio.Suzuki et al.[26] studied the two-phase bubble flow in a lead–bismuth alloy.Wang et al.[27] developed a thermal-hydraulic analysis program for lead–bismuth fast reactor ring fuel based on a closed parallel multichannel model and a quantum genetic algorithm.Lanting et al.[28]numerically calculated the bubble flow in liquid heavy metals in a tube and analyzed the morphological changes in the bubbles as they rose in the tube.Jeltsov et al.[21] studied the accumulation and flow of bubbles in a core during SGTR accidents, and the results indicated that small bubbles were more likely to remain in the core.
In the development of lead-based fast reactors, SGTR accidents are important for analyzing severe accidents.The two-phase flow of the fuel assembly during an SGTR accident is directly related to the safety of the lead-based fast reactor design.Currently, there are few studies on twophase flows in the fuel assemblies of lead-based reactors,and the experimental method is not ready for implementation.Therefore, the open-source OpenFOAM software was used to predict the two-phase flow of the fuel assembly under SGTR accident conditions.This calculation can provide technical support for subsequent experimental methods and validate the design and development of lead-based fast reactors.
2 Models and methodologies
2.1 Governing equations of the LBEsteamEulerFoam solver
The Euler method assumes that each phase is on a mutually permeable continuum.Thus, each phase has independent physical properties such as the pressure, temperature, and velocity.It is necessary to analyze the interphase force to seal the governing equation when simulating a gas–liquid two-phase flow using the Euler method.In a liquid metal gas–liquid two-phase flow, the interphase mass transfer between the gas and liquid phases is generally ignored, and the governing equation is
whereαi,ρi, anduirepresent the macroscopic volume fraction, density, and velocity of phasei, respectively, and Fijrepresents the interphase force of the gas–liquid phase.Fijis primarily used to represent the transfer of momentum between phases, which is the result of the combined action of various forces [29]:
where FDrepresents the drag force caused by the relative motions of the gas and liquid phases.FLrepresents the lift and lateral forces caused by the pressure difference perpendicular to the direction of bubble motion.FWLstands for wall lubrication, which is generated by the slip velocity near the wall.FTDrepresents the turbulent diffusion force, which is the traction force caused by the liquid turbulence on the bubble.FVMrepresents the virtual mass force, which is generated by changes in the relative acceleration.
The drag force on a single bubble can be expressed as[30]:
The shear-induced lift force of the bubble is [31]:

whereCD,ρ1,ur, andAdrepresent the drag coefficient of the bubble, liquid density, relative velocity of the two phases,and projected area of the gas phase, respectively.CLrepresents the lift coefficient.αgrepresents the volume fraction of the gas phase, andu1represents the velocity of the liquid phase.CWLis the wall lubrication force coefficient.urwis the tangential component of the relative velocity at the wall.nwis the unit normal vector of the wall.Prαrepresents the turbulent Prandtl number with a discrete volume fraction, andγ1represents the viscosity of the moving vortex in the liquid phase.CVMis the virtual mass–force coefficient.
The standardk-ε model [35] is the most simple and economical method for modeling turbulence; it has good convergence and can accurately predict the flow in the pipeline,shear flow, etc.The turbulent kinetic energykand turbulent kinetic energy dissipation rateεare expressed as follows:

whereμmis the dynamic viscosity of a laminar fluid;μtis the dynamic viscosity of a turbulent fluid;σkandσεrepresent the diffusion Prandtl numbers; the model constantsCμ,Cε1,andCε2are 0.09, 1.44, and 1.92, respectively.
The Prandtl number of liquid lead–bismuth is nonlinear.The turbulence effect was considered in subsequent calculations; therefore, the Prandtl number of liquid lead–bismuth was modified [36] as:
OpenFOAM provides users with many operators that can be used to solve partial differential equations.In this study,each physical quantity in the governing equation was first defined on the open-source platform, so that each quantity could be called for numerical calculation in the operation.Next, the governing equations of the physical quantities were combined using the OpenFOAM operators.OpenFOAM provides methods for explicit and implicit calculations that can be invoked in the conservation equations.The secondorder discretization method was used in OpenFOAM to discretize the physical quantities and ensure calculation accuracy.The improved governing equation was encapsulated in OpenFOAM as a self-developed solver called LBEsteamEulerFoam.This solver can be used for liquid lead/lead–bismuth and water vapor two-phase flows.
2.2 Meshing the CiADS Assembly
In advanced reactors of conventional design with a lead/lead–bismuth alloy as the coolant, the fuel rods are usually arranged in a triangular manner to form hexagonal assemblies.The subchannels of the assemblies are divided into three types: internal, edge, and corner.In this study, the CiADS subcritical reactor fuel assembly parameters [37]were used for the simulation.The simulation area was the active area of the fuel assembly.The axial height of the studied section was 720 mm.There were 60 fuel rods in the regular hexagonal fuel assembly, and one stainless steel rod was located in the center.A stainless steel rod used as a locking device was designed to prevent the assembly from floating in a liquid lead–bismuth alloy.The fuel rod diameter was 13.1 mm, and the pin pitch was 15.1 mm.
Considering the accuracy of the two-phase flow calculations, a structured grid was used to discretize the model.The grid partitioning results are shown in Fig.1a, and the boundary layer settings on the outer surfaces of the fuel rods are shown in Fig.1b.In OpenFOAM, the mesh was checked with the “checkMesh” command, and the results show that the mesh met the calculation requirements.The total number of cells was 2,303,680, and the maximum skewness was 0.544; the mesh orthogonal quality exceeded 0.7, and the Y-plus value was approximately 30.

Fig.1 (Color online) Grid delineation and sensitivity analysis.a Grid division of the assembly; b Grid division of the boundary zones
2.3 Boundary conditions setting and mesh-independent analysis
In numerical simulations, appropriate conditions must be set for each boundary according to the actual working conditions.The CiADS method [37, 38] was used to set the boundary conditions listed in Table 1.A transient mode was adopted to simulate the bubble behavior in the fuel assembly under different heating boundary conditions; the simulations were divided into three cases, as listed in Table 2.Currently,there are no reliable experimental data on the two-phase flow of lead-based reactor fuel assemblies.Therefore, the gas–liquid phase was assumed to be evenly mixed when the bubbles were transmitted through the main pump.The assembly inlet was set for uniform mixing of both the gas and liquid phases.The gas content is the fraction of the phase occupied by gas in the grid.The gas content rate was varied from 1 to 30%to verify the impact of the bubble distribution, the velocity,and other operational parameters.
To eliminate the influence of grids on the accuracy of the calculation results when solving partial differential equations, a grid independence analysis should be carried out.Five groups of grids with different degrees of densitywere divided according to the fuel assembly model.The maximum temperature and velocity at the fuel assembly outlet were selected for the grid independence analysis.Figure 2 shows the calculation results for the five groups of grids.The case with 2,303,680 grids yielded similar results to that with 2,786,670 grids, while there was a large deviation for 1,678,372 grids.The calculated results for 5,467,372 and 12,072,264 grids are similar to those for 2,303,680 grids.However, the calculation times for 5,467,372 and 12,072,264 grids were significantly longer.Considering the accuracy of the results and the calculation efficiency, the case with 2,303,680 grids was selected for subsequent calculations.

Table 1 Boundary conditions for the CiADS fuel assembly

Table 2 Setting of different cases

Fig.2 Grid convergence study

Table 3 Properties of liquid LBE
2.4 Coolant properties
A liquid lead–bismuth alloy was used as the coolant for the CiADS fuel assembly.Owing to the special thermal properties of Pb–Bi, the calculation process differed from that of conventional coolants.Therefore, the thermophysical parameters were experimentally measured and fitted to the correlations [40] listed in Table 3.The steam properties obtained from the international standard IAPWS-IF97 steam table[41] are defined in the OpenFOAM material database.
2.5 Simulation model verification
Owing to the opacity of liquid lead–bismuth and the difficulty in X-ray detection, experimental data on liquid lead–bismuth two-phase flows are scarce.To verify the accuracy of LBEsteamEulerFoam in the simulation of lead-based fast reactors, the single-phase flow of a liquid lead–bismuth cooled assembly containing spacer wires was simulated.The LBEsteamEulerFoam solver was verified by setting the inlet gas content to 1 × 10⁻⁶without closing the interphase force factor.This order of magnitude is attributed to the oxygen control level of the LBE loop.In 2016, KIT conducted a 19-rod bundle wire-wrapped positioning fuel assembly heat transfer experiment using LBE as a coolant.The experimental setup was installed in the vertical section of the THEADES loop.The specific boundary conditions used in the experiment were as follows: inlet temperatureTin= 473 K; inlet mass flow rateM= 19.18 kg/s; and total heating powerQ= 197.04 kW.The heating power was evenly distributed over the heating section of each rod.According to the MYRRHA reactor design, the experimental data from Pacio [42] and the calculated results of the experimentally checked SACOS-PB subchannel program [43]were compared under the same conditions.The SACOS-PB subchannel program is a necessary analysis tool for reactor thermal-hydraulic design and safety analysis.To enhance the calculation efficiency, the inlet and outlet boundaries were set as periodic flow boundaries according to the periodicity of the spacer wires.Pacio selected three measurement positions with different axial heights in the heating section.Because the gas–liquid two-phase flow was more affected by the change in the axial height, the experimental data at an axial height of 820 mm were selected for comparison.The measurement points were arranged in five subchannels:3, 14, 15, 29, and 39.The calculated results for the center positions of these five subchannels were extracted for comparison with the experimental results.A comparison of the coolant temperatures calculated for different subchannels at the axial height of the active zone of 820 mm is shown in Fig.3.

Fig.3 Coolant temperature distribution at an axial height of 820 mm in the active zone
As shown in Fig.3, the coolant temperatures in different subchannels on the same cross section are different.The coolant temperature in the inner channels near the central rod bundle was higher.The inner channel coolant temperature is higher than the edge and corner channel coolant temperatures.The coolant temperatures of the SACOS-PB and LBEsteamEulerFoam solvers in different subchannels in the same section were in good agreement under the same calculation conditions, and the maximum relative error was less than 1.13%.Compared to the experimental data, the maximum relative error of the LBEsteamEulerFoam solver was less than 4.17%.Therefore, the simulation results of the LBEsteamEulerFoam solver are accurate, and the calculation accuracy is high for 10–6gas content.Hence, this solver can be used for the subsequent simulation analysis of two-phase flows.
3 Results and discussion
3.1 Bubble gathering
Figure 4 shows the bubble distribution scenarios in Case 1 when the water vapor content at the fuel assembly inlet was 10%.Owing to the transient nature of the multiphase flow calculation, three typical bubble distribution scenarios were selected for analysis in the middle and outlet sections.Datafrom the three time points were extracted.Three sets of data from the same moment were normalized.The error bars represent fluctuations in the calculated data.As shown in Fig.4,the bubbles accumulated at the edge and corner channels of the fuel assembly.The fraction of bubbles in the edge and corner channels increased with time.The distribution results provide a reference for the aggregation analysis of liquid heavy metals in fuel assemblies.There is a large temperature distortion in the bubble-gathering area; therefore, it is necessary to further improve the high-temperature resistance of the fuel assembly box to cope with a SGTR accident.The degree of bubble aggregation in the edge channel of the outlet exceeded that in the middle section, which indicates that the bubbles aggregated when rising in the assembly.

Fig.4 (Color online) Bubble distribution in Case 1 with 10%inlet steam content
Because the corner channel consists of two walls at 120°,the flow in this region is influenced by both the walls of the fuel assembly cartridge and fuel rods.The heating area in this region was smaller than those in the other channels,complicating the flow characteristics in this region and resulting in uneven coolant velocity distributions in the same cross section.The coolant velocity was reported to be lower in the corner channels.As the coolant flowed through the fuel assembly, the bubbles were dragged by the coolant and gradually deflected from the high-velocity region to the lowvelocity region.Therefore, bubbles accumulate at the edge and corner channels of the fuel assembly.
3.2 Outlet section velocity
Figure 5 shows the maximum velocity of the two-phase fluid in the fuel assembly outlet section.Based on the three different cases, 30 sets of data with gas contents ranging from 1 to 30% were calculated.Because of the low density of water vapor and its expansion effect, the velocity of the two-phase flow is closely related to the imported water vapor content.The figure shows that the maximum velocity of the liquid metal at the fuel assembly outlet increased with the inlet water vapor content.When the inlet water vapor content was less than 15%, the fluid velocity fluctuation at the assembly outlet was small, and the growth rate was slow.When the inlet water vapor content exceeded 15%, the two-phase flow velocity fluctuated significantly, and the fluctuation range increased gradually.This phenomenon indicates that the presence and migration of the gas phase disturbed the coolant flow in the fuel assembly.A comparison with Fig.5 shows that the heating condition with a fixed temperature causes the component outlet to obtain a larger two-phase flow velocity under a high gas content.When the axial power distribution was set to a cosine shape, larger velocity fluctuations were observed at the outlet.
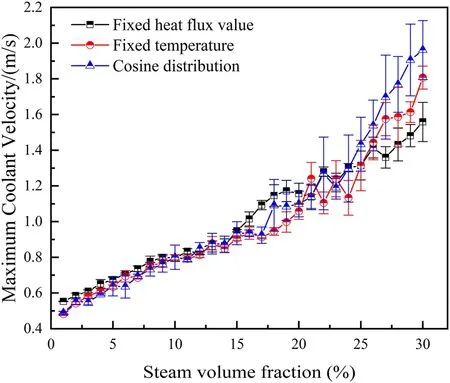
Fig.5 (Color online) Maximum coolant velocity at the assembly outlet section
Owing to the expansion of steam bubbles, the velocity of the two-phase flow is related to the inlet steam content.The gas phase is less intensive, and large bubbles form along the axial direction, occupying a larger cross-sectional area.Because lead–bismuth and steam bubbles may have no phase conversion, the cross-sectional area of the liquid phase may decrease.Owing to the continuity principle, the liquidphase velocity may increase.The velocities of these two phases increase by different magnitudes.The Euler method employs two sets of NS equations and can solve for both phases separately; thus, it is more suitable for simulations of high-gas-content two-phase flows.The lift force between the two phases may increase the velocity of the gas phase.However, the growth of the gas-phase velocity is smaller than that of the liquid phase because of the larger resistance.
3.3 Temperature distributions at the middle and outlet sections
During an SGTR accident, the coolant temperature in the fuel assembly is affected by the water vapor content.The design parameters of the fuel assembly, such as the material selection or geometrical design, may significantly depend on the anticipated operating temperature.Figure 6a shows the maximum coolant temperature change in the axial intermediate section of the fuel assembly when the inlet water vapor content changes from 1 to 30%.Because the temperature change of the coolant is not obvious for fixed temperature heating, heating conditions with a fixed heat flux and cosine distribution were selected for the analysis.When the inlet water vapor content increased from 1 to 15%, the maximum coolant temperature in the middle section increased slowly, and the water vapor content did not dominate the two-phase flow.When the imported water vapor content exceeded 15%, the coolant temperature increased significantly and obvious fluctuations occurred, which gives insight into the degree of heat resistance fatigue of the fuel rods.

Fig.6 Maximum temperatures.a Maximum LBE temperature at the assembly middle section; b maximum LBE temperature at the assembly outlet section; c Comparison of the maximum cladding temperature distribution along the axial direction of the fuel rods
Figure 6b shows the relationship between the inlet vapor content and temperature at the outlet section with fixed and cosine-shaped heat fluxes.When the inlet water vapor content was less than 15%, the coolant temperature in the assembly remained within the designed safety range of the fuel assembly.The coolant temperature fluctuation was small, indicating that the fuel assembly could tolerate small amounts of water vapor under normal operating conditions.When the vapor content at the inlet exceeded 15%,the maximum temperature of the coolant at the outlet section increased noticeably and the fluctuation became more significant.Thus, the fuel assembly can tolerate greater thermal stress and fatigue.
Figure 6c illustrates the temperature distribution of fuel rods 2 and 40 along the axial direction under heating with a cosine-distributed heat flow density.The difference between the single-phase flow temperatures of fuel rods 2 and 40 was minimal because there was no cross mixing of the spacer wires.In the two-phase flow of the fuel assembly, the axial temperatures of both fuel rods increased with the axial height.However, the maximum temperature increase on the cladding surface of fuel rod 2 exceeded that of fuel rod 40.The largest temperature growth rate of the cladding surface was observed atZ= 0.36 m, where the line power density reached its maximum.The temperature at the outlet was close to 850 K for fuel rod 2, which was considerably higher than the maximum temperature obtained by the CiADS calculations [37].This calculation was instantaneous, and the location of the grid with the maximum gas content changed as the calculation time increased.The contour results demonstrate that the bubbles gathered in the edge and corner channels.The hottest locations of the assembly outlet were typically distributed in the inner channels.
Owing to the relatively low specific heat capacity of steam, the cooling capacity of the cladding in the gas phase is much lower than that of liquid lead–bismuth,which may cause unexpected temperature increases in the fuel assembly.Simultaneously, owing to the narrow subchannel area within the fuel assembly, large bubbles may block the subchannel near the assembly outlet, causing heat transfer deterioration.When the heat flow density was distributed along the axial cosine, the maximum linear power rating was observed atZ= 0.36 m.Because bubbles may accumulate at this location, the heat transfer coefficient between the cladding surface and coolant may deteriorate significantly.Because of the relatively slim cladding wall, the heat capacity was limited, which may have caused partial overheating of the cladding.
3.4 Maximum steam volumetric fraction
Figure 7a–c shows the relationship between the maximum vapor content in the middle and outlet sections of the fuel assembly and the vapor content in the inlet section.The maximum gas holdup of the grid at the outlet section of the fuel assembly exceeded that in the middle section.According to the contours in Sect.3.1, the degree of bubble accumulation in the edge channels at the fuel assembly outlet exceeded that at the edge channels in the middle section.These results indicate that the bubbles accumulated during rising in the fuel assembly subchannels.When the gas content of the inlet was less than 2%, the maximum gas contents of the grid at the outlet and middle sections of the fuel assembly were slightly different.This indicates that the bubble accumulation phenomenon was not obvious at this time, and no large bubbles were generated.When the vapor content at the inlet increased from 5 to 15%, the grid gas holdup at the outlet section increased steeply, indicating that the maximum vapor content of the grid increased more rapidly during this process.Moreover, the gas holdup growth slope of the grid in the outlet section was higher than that of the grid in the middle section, indicating that large bubbles gradually accumulated in the upper part of the fuel assembly.When the inlet gas content exceeded 15%, the growth rate of the maximum gas content in the grid was modest, and the maximum gas content in the grid gradually reached its maximum value.When the gas content at the inlet exceeded 25%, there was little difference between the maximum gas content at the outlet and middle sections of the fuel assembly.This indicates that the bubble coalescence process in the upper part of the assembly became saturated at a higher gas content.The percentage of gas content in the grid increased owing to the presence of large air bubbles,and the maximum gas content of the grid increased with increasing axial height.
3.5 Comparison with the VOF model
At present, there are few studies on two-phase flows in the fuel assemblies of lead-based fast reactors, and the experimental method is not yet ready for implementation.Multiphase flow simulations are divided into an interface class model (VOF method) and a high-phase-fraction multiphase flow model.The VOF model is a surface-tracing method that can be used to determine the interface between a variety of mutually incompatible fluids.Sheng et al.[44] used the VOF method to simulate the two-phase flow of an ADS fuel assembly with different inlet water vapor contents, heating boundary conditions, and coolants.The results show that water vapor accumulated heat in the fuel assembly, and the temperature fluctuated significantly.Because of the lack of experimental data, the Euler calculation results were compared with the VOF calculation results.Figure 8a shows the accumulation of water vapor bubbles at the edge and corner channels calculated using the Euler and VOF methods.The gas bubbles in the corner channel of the fuel assembly accumulated into clumps.The degree of bubble aggregation in the corner channel exceeded that in the edge channel.According to the contour comparison, larger bubbles were formed in the corner channel using the VOF method, and the degree of bubble aggregation in the side channel exceeded that calculated using the Euler method.The degree of bubble aggregation significantly influenced the coolant speed and temperature.
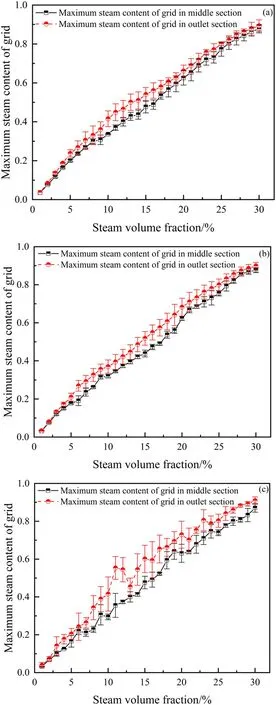
Fig.7 Maximum steam content of the grid.a Case 1; b Case 2; c Case 3
Figure 8b shows the maximum temperature of the fuel assembly outlet calculated using the Euler and VOF methods.The maximum temperature of the component outlet increased with the gradual increase in the inlet water vapor content.When the imported vapor content exceeded 15%,the coolant temperature increased significantly.The results of the two solvers agree well with the upward trend, and the maximum relative error of the temperature was less than 5.83%.The simulation time of the LBEsteamFoam solver 10 s after the accident was 42.3 h, whereas that of the LBEsteamEulerFoam solver was only 1.64 h with the same hardware resources.Compared with the VOF method, the Euler method has a higher calculation efficiency when dealing with two-phase flows in LFR fuel assemblies.There is a significant difference between the two methods in terms of the number of meshes required.The VOF method is a direct simulation of a multiphase flow, similar to the DNS.Because the VOF method must capture the boundary between the two phases, a finer mesh may be required.The Euler method,however, need not finely grasp the boundary between the two phases and therefore requires a smaller mesh.Thus, a higher calculation efficiency can be expected using the Euler method.

Fig.8 (Color online) Comparison with the VOF method.a Steam bubbles at the periphery regions; b Comparison of the maximum coolant temperatures at the outlet
The VOF method can capture the boundary between two phases and provide a good description of bubble accumulation in the corner and edge channels of the fuel assembly.Each phase in the Euler method has its own physical properties, which can better describe parameters such as the bubble diameter, interphase force model, and multi-scale distribution.The Euler method has a unique advantage for high-phase-fraction multiphase flow calculations.Owing to the deviation in the calculation results of the Euler and VOF methods, experiments are required for further verification.The fuel assembly test equipment requires assembly boxes because bubbles accumulate at the edge and corner channels.Simultaneously, measurement points were arranged in the corner and edge regions near the assembly box to monitor the water vapor phase in the two-phase flow.
4 Conclusion
Improving the safety of lead-based fast reactors is beneficial when studying pipeline rupture accidents in steam generators.In this study, the open-source computational fluid mechanics software OpenFOAM was used to calculate the two-phase flow of liquid heavy metal and water vapor in the fuel assembly.By changing heating boundary conditions,the bubble aggregation, velocity, temperature and maximum gas content of the cross-sectional grid in the fuel assembly under different working conditions were analyzed, and the conclusions were obtained as follows:
1.At the fuel assembly outlet, bubbles are more likely to accumulate in the edge and corner channels near the assembly box, and the degree of accumulation in the corner channels is greater than that in the edge channels.As the inlet water vapor content increases, the two-phase flow velocity at the fuel assembly outlet may increase.
2.As the inlet vapor content increases, the temperature inside the fuel assembly will gradually increase.Due to the weak heat-conducting capability of water vapor, the maximum coolant temperature that can be reached in the fuel assembly might increase.When the inlet water vapor content is less than 15%, the maximum temperature at the fuel assembly outlet is still within the design range.When the inlet water vapor content is more than 15%, the maximum temperature at the fuel assembly outlet rises sharply, which will easily reach the working limit of fuel rods and thus affect the safety behavior of fuel assemblies.At the same time, when the inlet vapor content is set higher than 15%, the temperature fluctuation may become larger, which will aggravate the thermal fatigue stress of the fuel rod and the assembly box.
3.With the increase in inlet steam content, the maximum gas content of the grid at the fuel assembly outlet also increases gradually.When the inlet water vapor content is less than 5%, the gas phase in the fuel assembly is not dominant.When the inlet water vapor content is in the range of 5–20%, the upper part of the fuel assembly will gradually accumulate to form large bubbles.A large number of bubbles coalesce and break, so the maximum gas content of the grid at the fuel assembly section increases significantly.When the gas content of the inlet is greater than 20%, the maximum gas content of the grid no longer shows an obvious upward trend.
4.Compared with the VOF method, the Euler method has higher calculation efficiency when dealing with the twophase flow in LFR fuel assemblies.In addition, each phase in Euler method has its own physical properties,which can be considered to provide better descriptions of parameters such as bubble diameter, interphase force model, and multi-scale distribution.However, the Euler method may cause the underestimation of the void fraction and lead to the underestimation of the positive reactivity feedback of the lead-based reactors, so it is still necessary to cross-check with two-phase flow experimental data in the future.
Author contributionsAll authors contributed to the study conception and design.Material preparation, data collection, and analysis were performed by Yun-Xiang Li, Lu Meng, Zi-Nan Huang, Song Li,Di-Si Wang, Bo Liu, You-Peng Zhang, Tian-Ji Peng, Lu Zhang, Xing-Kang Su, and Wei Jiang.The first draft of the manuscript was written by Yun-Xiang Li, and all authors commented on previous versions of the manuscript.All authors read and approved the final manuscript.
Data availabilityThe data that support the findings of this study are openly available in Science Data Bank at https:// www.doi.org/ 10.57760/ scien cedb.j00186.00220 and https:// cstr.cn/ 31253.11.scien cedb.j00186.00220.
Declarations
Conflict of interestThe authors declare that they have no competing interests.
杂志排行

Nuclear Science and Techniques的其它文章
- Applying the Kalman filter particle method to strange and open charm hadron reconstruction in the STAR experiment
- Novel algorithm for detection and identification of radioactive materials in an urban environment
- Lambda polarization at the Electron‑ion collider in China
- Measurements of absolute electron capture cross sections in He2+–He and Ne8+–O2, N2, CH4 collisions
- Production of neutron‑rich actinide isotopes in isobaric collisions via multinucleon transfer reactions
- Physics-constrained neural network for solving discontinuous interface K-eigenvalue problem with application to reactor physics