Rolling texture development in a dual-phase Mg-Li alloy: The role of temperature
2023-11-18XioynLiFeiGuoYnlongLuyoJingHonglingLiHiingLiuDingfeiZhngRishengPei
Xioyn Li, Fei Guo,∗, Ynlong M, Luyo Jing, Hongling Li, Hiing Liu,Dingfei Zhng, Risheng Pei
a College of Materials Science and Engineering, Chongqing University of Technology, Chongqing 400054, China
b Chongqing Materials Research Institute Co., Ltd, Chongqing 400707, China
c College of Materials Science and Engineering, Chongqing University, Chongqing 400044, China
d Institut für Metallkunde und Metallphysik, RWTH Aachen University, Aachen 52056, Germany
Received 25 July 2021; received in revised form 12 September 2021; accepted 4 October 2021
Available online 3 December 2021
Abstract Dual-phase Mg-Li alloys sheets were rolled at four different temperatures ranging from liquid nitrogen to 300 °C to explore effect of rolling temperature on texture and mechanical properties of the material. Crystal plasticity simulation was utilized to illustrate the influence of slip activity on rolling texture development. The results show that the rolling texture is largely depended on deformation temperature.Unlike commercial Mg alloys, the critical resolved shear stress of basal slip in α-Mg phase of Mg-Li alloy decreased more significantly by increasing temperature compared to that of pyramidal
Keywords: Magnesium-Lithium alloys; Dual-phase; Texture; Slip behavior; Mechanical properties.
1. Introduction
Magnesium-Lithium(Mg-Li)alloys attracted a lot of attentions from aerospace and transportation industry due to their low density and high formability [1–3]. By adding Lithium(Li) into Mg alloy, the crystal structure can gradually change from hexagonal close pack (hcp)α-Mg phase into body center cubic (bcc)β-Li phase. With Li content ranging from 5.7 to 10.3 wt.%, the alloys exhibited a dual-phase structure as bothα-Mg andβ-Li phases existed simultaneously in the matrix [4]. Previous studies had shown that the dual-phase alloys usually exhibited better mechanical properties compared to the two single-phase materials [5–8]. Therefore, the dualphase Mg-Li alloys received a high potential for further applications.
Rolling is one of the most important sheet-forming methods in the industry. Beside shape forming, rolling processing can also modify the microstructure and texture of Mg alloys to improve the mechanical properties [9–14]. Basal texture weakening is usually performed on Mg alloys to improve their plasticity [15–18]. Numbers of new rolling techniques, such as differential speed rolling [19,20], cross rolling [21,22],were utilized to weak basal texture or produce non-basal texture during deformation. Except for rolling techniques, rolling parameters, especially the temperature, had a strong influence on formation of rolling texture in Mg alloys [23–27].Cold rolling procedure usually caused a strong basal texture in commercial Mg alloys. By increasing rolling temperature,the basal texture became weaker and started to transmit to double peaks texture with the basal poles tilt towards the rolling direction (RD).
The change of the rolling texture with deformation temperature is not only induced by recrystallization, but also caused by the change of deformation modes during rolling.The basal slip and {10¯12} tensile twinning was responsible for the formation of strong basal texture during cold rolling [28]. At the elevated temperature,the critical resolved shear stress(CRSS)of non-basal slip systems, such as prismatic and pyramidal
Evolution of rolling texture of dual-phase Mg-Li alloys is different from the commercial Mg alloys [30,31]. First, the dual-phase Mg-Li alloys exhibited both hcp and bcc crystal lattices, which means texture of two phases should be independently considered. At the same time, it has been proved that slip behavior inα-Mg phase at room temperature is different from commercial Mg alloys as the activation of nonbasal slip systems were largely enhanced [32].{11¯22}{11¯23}secondary pyramidal slip (Pyr II slip) activated at ambient temperature and, at the same time, extension twinning behavior was inhibited [33–35]. Hence, the double peaks texture was usually observed inα-Mg phase of dual-phase Mg-Li alloys during cold rolling [33]. Compared toα-Mg phase,texture evolution of theβ-Li phases attracted less attention in the previous studies [36]. Several studies revealed that{001}<110> texture is the dominant component during cold rolling of dual-phase Mg-Li alloy [33,37]. More investigations are needed to further explore the origin for this texture component.
Competition of basal slip and non-basal slip resulted in different rolling texture development at various rolling temperature in commercial Mg alloys.It is reasonable to presume the temperature should also affect rolling texture evolution of bothα-Mg andβ-Li phases. Unlike pure Mg, the competition of various slip systems is different in Mg-Li alloys as their non-basal slips had already exhibited a high mobility at room temperature. A greatly decrease of CRSS of pyramidal slip was confirmed by crystal plasticity simulation in a single hcp phase Mg-Li alloy [34]. Beside the pyramidal
In order to explore the rolling texture development of dualphase Mg-Li alloy at various temperature, a dual-phase LZ91 Mg-Li alloy sheets were rolled at cryogenic, room temperature, 200 °C and 300 °C with 70% reduction, respectively.Marco-texture for both two phases of all rolled samples was carefully analyzed. The difference of rolling texture at various temperature was comprehensively investigated. Crystal plasticity simulation for rolling texture was performed to assist the illustration of slip behavior in bothα-Mg andβ-Li phases. The relationship of various slip systems on rolling texture development was discussed. Effect of rolling temperature on mechanical properties of the as-rolled sheets was also investigated.
2. Experiment
A hot extruded dual-phase LZ91 Mg-Li alloys with a dimension of 50 × 5 × 5 mm in length, width and thickness, respectively, which was utilized as the initial material for this study. To release deformation strain, a prior annealing at 300 °C for 2 h was carried out before rolling. The extruded sheet was rolled along the RD at various temperature. All the sheets were rolled by 10 passes to reach a total reduction of 70%. For cryogenic rolling (CR), the sample was immersed in liquid nitrogen (LN) at -196 °C for 20 min before rolling.After each rolling pass, the sample immediately immersed in LN again for another 5 min prior to the next rolling pass.For 200 and 300 °C rolling, the sheets were heated to those temperatures for 20 min before the first rolling pass, and for 5 min between two rolling passes.
The microstructure was characterized by optical microscope (OM). The rolling direction-transverse direction (RDTD) plane of samples were first ground and then etched by 5% nitric acid and picric acid to obtain a clear contrast for dual-phase structure.The samples for further observation were electropolished by AC2 solution at 20 V and 0.09 A for 90 s.The samples were characterized by a Field emission scanning electronic microscope (Zeiss sigmaHD) to observe the microstructure of the RD-ND (nominal direction) surface of the material.
The PANalytical Empyrean X-ray diffraction with a resource of Cu-Kαradiation at 40 kV and 40 mA was used to identify the crystal structures of two phases. The rolled samples were grinded to their mid-layer for texture measurement,four incomplete pole figures of (0002),(10¯10),(01¯11)and(10¯13)were recorded for the calculation ofα-Mg phase pole figures. Forβ-Li phase, (002), (011) and (112) pole figures were measured. The free MTEX toolbox [39] was utilized to reconstruct the orientation density functions (ODF). The mechanical properties of samples rolled at different temperatures were measured by MTS E43 universal testing machine. Dogbone specimens with gauge length and width of 20 mm and 2 mm were used for the tensile test. The specimens were carried out with an initial tensile strain rate of 0.001 s-1along the RD at room temperature. The tensile test for each sample were repeated at least three times to guarantee its reliability.
3. Results
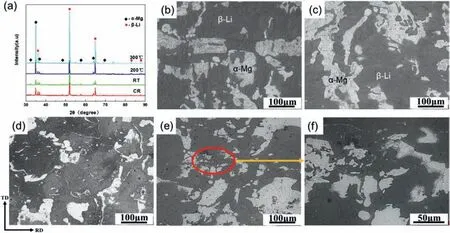
Fig. 1. (a) XRD patterns of all rolled samples, microstructure of the samples on the RD-TD plane rolled at (b) liquid nitrogen temperature, (c) RT, (d) 200 °C,(e) 300 °C and (f) high magnification of (e).
According to the XRD patterns of as-rolled sheets(Fig. 1a), all the rolled sheets were composed ofα-Mg andβ-Li phases, which indicated that no new secondary phase was precipitated during rolling process at all temperatures.The c/a ratio ofα-Mg phase was ∼1.605, which is calculated through distance of (0002) and(10¯10)lattice planes.Microstructure of the samples rolled at different temperatures is shown in Fig. 1b–e. Some deformed substructures can be clearly observed in theβ-Li phases of CR rolled and room temperature (RT) rolled samples, which means low rolling temperature gave rise to severely deform microstructure in dual-phase Mg-Li alloy. When the rolling temperature increased above 200 °C, the substructure was almost eliminated as shown in Fig. 1d and e. When the temperature increased to 300 °C, some equiaxed grains appeared in theβ-Li phase(Fig. 1f), which is a signal for the dynamic recrystallization inβphase during rolling process.
Fig. 2 shows the high magnification of the microstructure for rolling samples rolled at different temperatures.α-Mg phase exhibited a light color compared toβ-Li phase in the SEM.α-Mg phase was elongated along the RD and their thickness became thinner. There are large numbers of needlelike structures in theβ-Li phase in the CR and RT samples.These needle-like structures are regarded as hcp structure phases formed in theβ-Li phase due to strain induced phase transformation [40]. These phases exhibited a width around several hundred nanometers to a few micrometers.At the temperature higher than 200 °C, few needle-like phases can be observed in rolled samples, which means the formation of these phases is largely depended on deformation temperature.
Strain-stress curves and strain hardening rate of all samples are plotted in Fig. 3. As shown in Fig. 3a, the yield strength (YS), ultimate tensile strength (UTS) and elongation(EL) of the Mg-Li alloys rolled at various temperature are listed. CR samples had the highest strength as its YS, UTS are 194 MPa and 222 MPa, respectively. The YS and UTS of rolled Mg-Li alloys decreases with the increase of rolling temperature. For the 300 °C rolled sample, the YS and UTS are reduced by ∼33% and ∼26% compared to CR rolling.The ductility of 200 °C sample is 16.7%, which is the best among all four samples. Fig. 3b shows the strain hardening rate curves of samples rolled at different temperatures. The strain hardening behavior of all samples can be classified into Stage III and Stage IV. In the Stage III, the material hardening rate decreases uniformly. It is believed that the decrease was caused by cross slip of screw dislocation during dynamic recovery [41]. At the large strain, a low and constant hardening rate is considered to be Stage IV. In order to find the transition point of Stage IV, the end of linear decline of Stage III is designated as the transition point of Stage III to Stage IV. More details on relationship of microstructure and strain hardening behavior were discussed in following section.
Texture ofα-Mg phase of the LZ91 Mg-Li alloy rolled at different temperatures is displayed in Fig. 4. The (0002)pole figures of unrolled and all rolled samples are shown in Fig. 4a–e. Before rolling, theα-Mg phase exhibited a weak double peak texture as the basal pole tilt from the ND towards the RD [33]. In the CR and RT rolled samples, the rolled texture was also double-peak texture. Except for the RD split double peak texture, an orientation spread along the TD was also observed in 200 and 300 °C rolled samples. Fig. 4f and g are the texture intensity distribution in the (0002) pole figure from the ND towards the RD in TD//[10¯10](ϕ2=0◦)fiber and TD//[11¯20](ϕ2=30◦)fiber. The RD split texture components can be clearly seen in these two figures. The peak of the split angle along the RD is ranging from 12°to 16° in rolled samples, and the angle is decreased compared to the undeformed sample. TD//[10¯10](ϕ2=0◦)fiber exhibited a stronger RD split texture component compared to TD//[11¯20](ϕ2=30◦)fiber. Fig. 4h and i shows the texture intensity distribution of basal pole tilt from the ND towards the TD. For the RD//[10¯10](ϕ2=0◦)fiber, TD split texture components had a maximum intensity at ∼30° for 200 °C and ∼15° for 300 °C rolled samples. It worth noticed that those grains with their RD//[11¯20](ϕ2=30◦)are seldom split along the TD in all deformed samples, as shown in Fig. 4i. To describe the texture quantitatively, the tilt angle along the RD and TD directions under different temperatures rolling is shown in Table 1.
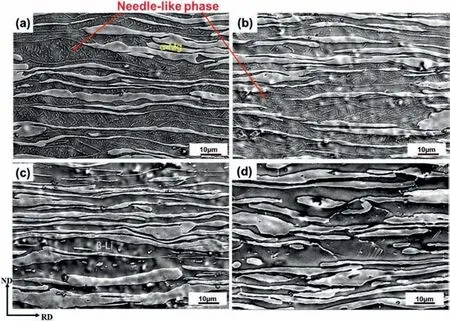
Fig. 2. SEM microstructure of samples rolled at (a) CR, (b) RT, (c) 200 °C and (d)300 °C on the ND-RD plane.
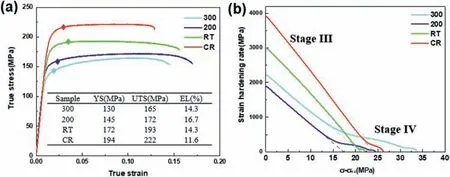
Fig. 3. (a) True strain-stress curves, (b) strain hardening rate of rolled samples at different temperatures.
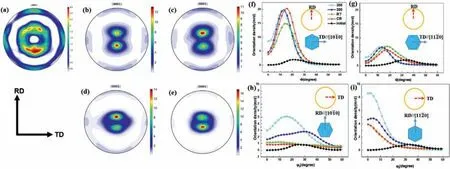
Fig. 4. Texture of α-Mg phase in dual-phase Mg-Li alloy of (a) unrolled [33], (b) CR, (c) RT, (d) 200 °C, (e) 30 °C and ODF intensity of fiber texture of(f) TD//[10¯10], (g) TD//[11¯20], (h) RD//[10¯10] and (i) RD//[11¯20].

Table 1 Texture intensity and tilt angle of the peak of the basal poles along the RD and TD directions under different rolling temperature.

Fig. 5. ODF of β-Li phase in dual-phase Mg-Li alloys measured by XRD of the samples rolled at various temperature (a) CR, (b) RT, (c) 200 °C, (d) 300 °C,(e) schematic figure of typical texture components of bcc structure phases in (φ2= 45°) section and evolution of texture intensity of β-Li phase aligned in (f)α-fiber and (g) γ-fiber.
Fig. 5 shows the texture ofβ-Li phase at different rolling temperatures. The 45° sections ofφ2of the ODF of all samples was selected for texture analysis for the bcc phase, as shown in Fig. 5a–d. Fig. 5e shows the typical texture components of bcc structure atφ2= 45° section of the ODF.α-fiber andγ-fiber contain the main rolling texture components ofβ-Li phase. Hence, orientation density ofα-fiber andγ-fiber was further analyzed. For theα-fiber, the texture components rolled at different temperatures are all stronger than those in the undeformed samples. The texture of CR sample is similar to RT one. Their {001}<110> (R-cube) was stronger compared to 200 °C rolled sample. {211}<110> (inverse brass) became weaker in CR and RT samples compared to 200 °C rolled sample. For 300 °C rolled sample, the texture is much different compared to other rolling procedures. Rcube component is much stronger and a new 12°-RD rotated{100}<110> texture component appears. For theγ-fiber, the{111}<110> (E component) of all rolled samples is larger than the undeformed sample. E component was enhanced by increasing rolling temperature to 200 °C.
4. Discussion
4.1. Effect of temperature on rolling texture development in α-Mg phase
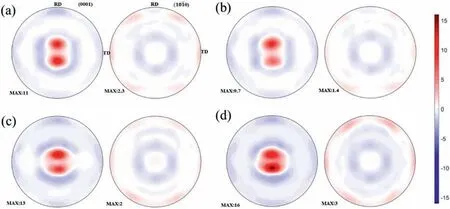
Fig. 6. Orientation transition of α-Mg phase during different rolling temperature (a) CR, (b) RT, (c) 200 °C, (d) 300 °C reductions displayed in (0002), (10¯10)pole figures (For interpretation of the references to color in this figure, the reader is referred to the web version of this article).
Fig. 6 shows the rolling texture difference before and after rolling in (0002) and(10¯10)pole figure of the samples rolled at various temperature. The texture transition was calculated from the difference of texture intensity between rolled and initial samples. The orientations in red color represent they were enhanced during the rolling,while in blue indicates these orientations existed in unrolled material and became weaker during the rolling. The difference of rolling texture ofα-Mg phase at various temperature can be summarized into the following three points: (1) The split angle of the basal pole along the RD of all rolled samples was decreased by increasing rolling temperature. The blue orientations with a split angle around 22° are distributed closed to the red ones with a split angle around 12–16°. It indicates the blue orientations in unrolled sample gradually transformed to red ones by the rotation of the basal poles back to the center of (0002) pole figure during rolling. (2) intensity of<10¯10>//RD fiber was reduced during CR and RT rolling, while the<11¯20>//RD fiber was enhanced. It is indicated that some<10¯10>//RD fiber orientated grains rotated ∼30° around the
The formation of texture is closely related to the deformation mechanism of the material in the plastic deformation process. For theα-Mg phase, both slip and twinning can cause a transition of the crystal orientation. In our case, the change of split angle along the RD during the rolling is mainly caused by slip rather than twinning. It mainly because misorientation was relatively small and the twinning behavior was largely limited in Mg-Li alloy [35]. At the same time, the addition of Li element greatly improved the slip ability ofα-Mg. Slip behaviors of HCP structure materials are largely dependent on their c/a ratio, which is also influenced the texture development during deformation [42]. When c/a= 1.633, basal slip shows a great advantage at room temperature, hence, rolling texture is usually basal texture. Cold rolling of conventional Mg alloys, such as AZ31, usually induced a strong basal texture. When c/a<1.633, prismatic slip replaced the role of basal slip and gradually became the most important slip system. Ti and Zr alloys are representative of such structural metals, the typical cold-rolled texture of those materials is a double peak texture with the basal poles tilt towards the TD({0002}<10¯10> ±40◦TD) [43,44]. When c/a>1.633 (such as Zn and Cd), the enhanced pyramidal
In our study, RD tilt double peak texture components were observed at the four different rolling temperature, which proved that {11¯22}<11¯23> Pyr II slip provides an important contribution to deformation. Fig. 4f shows that the RD tilt angle decreases from 15.2° to ∼12.0° (Table 1) as the rolling temperature increases from CR to 300 °C. The change of the RD tilt angle is the result of competition between the basal slip and the pyramidal

Fig. 7. Schmid factor distribution of basal , pyramidal
The basal slip and Pyr II slip are not only affected the change of tilt angle in (0002) pole figure, but also affected the texture in(10¯10)pole figure. In the Fig. 6, TD//[11¯20]texture component slightly decreased and TD//[10¯10] texture increased in CR and RT samples.The TD//[10¯10]is more stable compared to TD//[11¯20]. Fig. 7c and d shows a schematic figure for lattice rotation of TD//[10¯10] and TD//[11¯20] orientations by basal slip and the Pyr II slip during rolling, respectively. The slip direction of basal slip and Pyr II slip only had the RD and the ND slip components in TD//[10¯10]orientation. The RD component gave rise to the extension of the material along the RD. The deformation along the ND was constrained by compressive strain during rolling,which had to induce lattice rotation to compromise deformation strain. ND component forced by basal slip rotated the
The last question for rolling texture development ofα-Mg is the remarkable orientation spread along the TD in 200 °C and 300 °C rolled samples. The maximum intensity of the TD tilt angle in the 200 and 300 °C sample is at 30° and 15°, respectively (Fig. 4h and i). The double peak texture of TD tilting is a typical texture during cold rolling of pure Ti,which is caused by prismatic slip [43,47]. Since the prismatic ̼a> slip cannot provide deformation along the
Through the analysis of the rolling texture, the characteristics of the slip behavior of theα-Mg phase in the Mg-Li alloy at different temperatures can be preliminarily obtained.When the temperature is at RT and below, the most important slip mechanism of theα-Mg phase is basal slip and Pyr II slip. When the temperature reaches 200 °C or above, the activation of prismatic slip is significantly promoted. In order to further explore the CRSS changes of each slip system under different temperatures conditions, we use visco-plastic self consistent (VPSC) to simulate the rolling texture of theα-Mg phase after the rolling deformation process[33,48].The relationship of the CRSS of various slip systems is considered as the input for the calculation. The simulate (0002)pole figures are shown in Fig. 8, which are correlated well with experiment results. The specific CRSS used for calculation is shown in Fig. 8b. For simplicity, we do not consider the difference in the hardening effect of each slip system as the strain increases. The simulation results of CR and RT rolling textures are typical RD tilting double peak textures.With the decrease of RD tilt angle, the CRSS ratio of basal slip to {11¯22}<11¯23> Pyr II slip decreases, indicating that the CRSS of basal slip reduced significantly with temperature increased. As the temperature rises from RT to 200 °C, the CRSS of prismatic slip is significantly reduced, the ratio of CRSS of prismatic slip and basal slip is 2.9. When the temperature continually raised to 300°C,the CRSS ratio between the non-basal slip system and the basal slip system continues to increase. It is proved that the basal slip played a more important role in theα-Mg phase of the Mg-Li alloy during the middle and high temperature deformation.
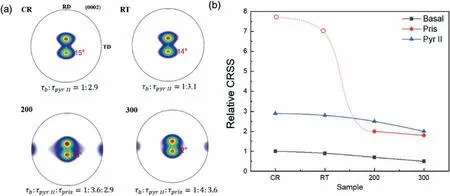
Fig. 8. Simulation results of the rolling texture of α-Mg phase (a) with four rolling conditions and (b) the specific critical resolve shear stress used in the simulation.
4.2. Effect of temperature on rolling texture development in β-phase
The formation of rolling texture in theβ-Li phase is closely related to the slip system during deformation.{110}<111> was main slip system in most of bcc structural material. With the change of temperature or stacking fault energy may also lead to the activation of {112}<111>and {123}<111>. To further explain the formation ofβ-Li rolling texture at various temperature, it is necessary to understand the influence of different slip systems on the formation of rolling texture. We simulated the rolling texture development during 70% reduction rolling ofβ-Li phase by those slip systems based on the initial texture using VPSC,respectively (Fig. 9a–c). The main texture components of the three simulated results are mainly distributed onα-fiber andγ-fiber. Therefore, the simulated texture intensity distribution onα-fiber andγ-fiber are plotted in Fig. 9d and e.
It can be found that the type of rolling texture produced by {110}<111> slip is quite different from the texture produced by the other two slip systems. The {110} 〈111〉 slip systems produced a strong inverse brass and {111}〈1¯12〉 (F texture component). On the other hand, the {112}<111> and{123}<111> slip systems produced stronger R-cube and E component.It can be seen from Fig.5 that the textures of CR,RT and 200 °C rolling are relatively similar. The intensity of R-cube texture and E component are higher,which proves that{112}<111> and {123}<111> slip system played an important role during the rolling ofβ-Li phase. As the rolling temperature increases from CR to 200 °C, the inverse brass and F component gradually increased, which means the contribution of {110}<111> slip gradually improved by elevating temperature. In summary, as the rolling temperature rises, the CRSS of {110}<111> slip will decrease more significantly compared to the other two slip systems.
The texture characteristics of 300 °C rolling are quite different from the other three rolled samples. The texture exhibited a high-strength of R-cube and 12°-RD rotated{100}<110>texture component.From the microstructure observation in Fig. 1, it can be found that there are large numbers of equiaxed grains in theβphase in the 300 °C sample, indicating that theβphase had already recrystallized.Therefore, the formation of the 300 °C rolling texture may be related to the recrystallization. Studies have shown that the texture characteristics of bcc structural steel during rolling and subsequent recrystallization are closely related to alloy composition and deformation temperature. For low carbon steel,the recrystallized texture after rolling is distributed on theγfiber, and the RD-rotated texture component is also formed on theα-fiber from the R-cube to the inverse brass texture[49]. When the Cr content reaches 0.5 wt.%, the RD-rotated texture component became the main part of the recrystallized texture [50]. This recrystallized texture component exhibited a RD rotation from Cubic component and it is very similar to the dominant texture component in 300 °C rolled Mg-Li alloy. Therefore, it can be inferred that theβ-Li phase texture development under 300 °C rolling is greatly affected by the dynamic recrystallization behavior.
4.3. Effect of rolling temperature on mechanical properties of a dual-phase Mg-Li alloy
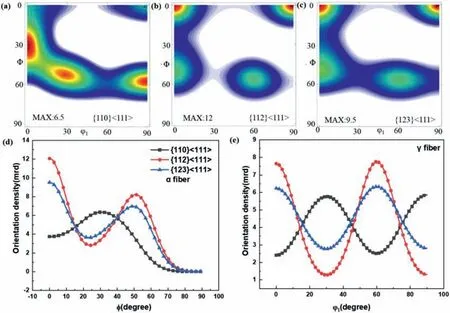
Fig.9. Rolling texture(φ2=45°)under the condition formed by several slip systems individually(a){110}<111>,(b){112}[111]and(c){123}[111];evolution of texture intensity of β-Li phase aligned in (d) α-fiber and (e) γ-fiber.

Table 2 The end point of linear decline of Stage III and the slope of Stage III.
The difference of mechanical properties of samples is mainly caused by the difference in microstructure and work hardening during the rolling process. All the samples had a two stages (Stage III and Stage IV) work hardening rates during room temperature tension. It is generally believed that the decrease in hardening of Stage III is mainly caused by“dynamic recovery” during the deformation process. The dynamic recovery came from the dislocation annihilation caused by the movable dislocations encountering with the opposite one to reduce dislocation density. Cross-slip is an important way to enhance the dynamic recovery. Cross-slip can promote screw dislocation to exchange its slip plane when its movement is blocked, which greatly increased the probability of dislocation annihilation. The three typical slip systems ofβ-Li phase with bcc structure share the {110} slip direction,making it easier to cross slip.Table 2 shows the softening rate of different samples in Stage III stage. It can be found that the dynamic recovery of CR rolled and RT samples are more effective compared to the 200 and 300 °C ones. The dynamic recovery efficiency has an important relationship with the annihilation of the dislocations formed in theβ-Li phase. The rate of dislocation annihilation is controlled by the possibility of the cross-slip in the material. The limitation of dislocation movement triggers the cross slip. The cross slip changed the slip plane and induce the transformation of the planner slip to wavy slip. Theβ-Li phase of CR rolling and RT rolling samples contains a large amount of strain-inducedα-Mg phase.The distribution of strain-induced phase transformation phases is relatively dense, which reduced the free path of the dislocations. At the same time, the dislocation density is relatively high in CR and RT samples. The high dislocation density not only reduces the free path of dislocations, but also increases the possibility that for dislocation annihilation. Therefore, the dynamic recovery of the CR and RT rolled samples is more obvious.
The lower work hardening rate in Stage IV indicates that the work hardening and the dynamic recovery softening almost reach balance. Estrin et al. [51] used the virtual "dualphase" structure to explain hardening behavior in Stage IV.The cell interior is regarded as soft phase and cell walls is designated as hard phase. In the Stage IV, dislocations concentrated mainly in cell walls(hard phase)to form dislocation tangle,resulting in a decrease of dislocations in the soft phase.Relatively low dislocation rate in cell interior gave rise to a low strain hardening rate [52]. Our previous study shown that the strain transfer between two phases in Mg-Li alloys may be an important reason for the obvious Stage IV of the alloy[53]. The transition from Stage III to Stage IV is a gradual process. The beginning of the transition indicates that start of strain transition from the soft phase to the hard one,which reduced the dislocation density inside the soft phase. The back stress generated at the phase boundary triggered the strain transition by generating new dislocation sources on the hard phase side. When the strain transfer phenomenon between the soft and hard phases became more frequent, the hardening rate might stabilize at a low value due to softening effect producing by strain transition.
The transition points of Stage III and Stage IV are set as the end of linear deviation points of Stage III. The stress of transition points for CR and RT samples are ∼21 MPa, and 200 and 300 °C samples are ∼12.6 MPa. It means the strain transmission in CR and RT sample is inhibited compared to 200 and 300 °C rolled samples. The increment of stress is related to the external stress field conditions required for strain transmission. The condition for strain transfer is that the back stress generated by the strain accumulation in the soft phase meets the requirement for stress of dislocation gliding in the hard phase, which is usually regarded as heterogeneous structure strengthening [4,6]. Our previous study showed that the hardening rate ofα-Mg was higher than that ofβ-Li phase,which leads to a remarkable difference of hardness betweenα-Mg andβ-Li with increasing deformation strain [30]. The dislocation density of CR and RT sample are relatively high due to the lack of recovery and recrystallization during the rolling. In this case, the difference of mechanical properties betweenα-Mg phase andβ-Li phase are much higher than those in 200 and 300 °C samples. The large difference of mechanical properties between two phases delayed strain transfer at the phase boundary. Secondly, because of the relatively high dislocation density in the CR rolled and RT rolled samples, the dislocation movement in the subsequent tensile deformation was hindered, which increasing the possibility for cross slip. Hence, dynamic recovery during the tensile deformation was promoted and then limited the dislocation plip up at phase boundaries which further inhibits strain transmission. In the end, the microstructure in Fig. 2 shows that there are large numbers of strain-inducedα-Mg phases in theβ-Li phase in CR and RT samples. The appearance of these phases greatly increases the number of two-phase interfaces.It reduced the efficiency of dislocation accumulation at the phase boundary, which inhibited strain transmission.
5. Conclusions
Dual-phase LZ91 Mg alloys were rolled by 70% thickness reduction at various temperature ranging from liquid nitrogen to 300 °C. The relationship of rolling texture, mechanical properties with deformation temperature were carefully analyzed and the following conclusions can be obtained:
(1) Mechanical properties of dual-phase Mg alloys were largely influenced by rolling temperature. Cryogenic rolling gave rise to a high yield and ultimate tensile strength with moderated ductility.The ductility of rolled sheets was enhanced by increasing rolling temperature because most of theβ-Li phase was recrystallized at high rolling temperature.
(2) Strain hardening behavior of as-rolled materials can be separated to two stages as Stage III and Stage IV for all samples.The transition of Stage III to Stage IV required a higher stress level in CR and RT samples probably because the inhabitation of stress transition betweenα-Mg andβ-Li phases.
(3) The rolledα-Mg phase exhibited double-peak texture with its basal pole tilt from the ND towards the RD at all temperatures. Competition between basal slip and{11¯22}<11¯23> Pyr II slip is influenced by the temperature as basal slip is more favorable at higher temperature.
(4) A remarkable spread of basal poles along the TD was observed in the samples rolled at 200 and 300°C,which indicates the prismatic 〈a〉 slip was enhanced at the elevated temperature.
(5) {001}<110> is the dominant texture component ofβ-Li phase of CR, RT and 200 °C rolled samples.As the temperature increased to 200 °C, {211}<110>and {111}<211> texture components were enhanced,which is regarded as the signal of the activation of{112}<111> or {123}<111> slip modes. Dynamic recrystallization largely affected texture of 300 °C rolled sample.
Declaration of competing interest
None
Acknowledgment
F. Guo thanks for the support of Chongqing Research Program of Basic Research and Frontier Technology Scientific Research (cstc2019jcyj-msxmX0111), University Innovation Research Group of Chongqing (CXQT20023)and Scientific Research Foundation of Chongqing University of Technology (2017ZD35). L.Y. Jiang is sponsored by Science and Technology Research Program of Chongqing Municipal Education Commission (Grant No.KJQN201901127).
杂志排行
Journal of Magnesium and Alloys的其它文章
- NaH doped TiO2 as a high-performance catalyst for Mg/MgH2 cycling stability and room temperature absorption
- Microstructure, mechanical properties and fracture behaviors of large-scale sand-cast Mg-3Y-2Gd-1Nd-0.4Zr alloy
- Enhanced initial biodegradation resistance of the biomedical Mg-Cu alloy by surface nanomodification
- Elucidating the evolution of long-period stacking ordered phase and its effect on deformation behavior in the as-cast Mg-6Gd-1Zn-0.6Zr alloy
- Effect of long-period stacking ordered structure on very high cycle fatigue properties of Mg-Gd-Y-Zn-Zr alloys
- The mechanism for tuning the corrosion resistance and pore density of plasma electrolytic oxidation (PEO) coatings on Mg alloy with fluoride addition
