The mechanism for tuning the corrosion resistance and pore density of plasma electrolytic oxidation (PEO) coatings on Mg alloy with fluoride addition
2023-11-18ZhuLujunLiHongzhnQingmeiLuJingoLiZhengxin
Zhu Lujun, Li Hongzhn, M Qingmei, Lu Jingo, Li Zhengxin,∗
a School of Physics and Information Technology, Shaanxi Normal University, Xi’an 710062, China
b Northwest Institute for Non-ferrous Metal Research, Xi’an 710016, China
Received 16 June 2021; received in revised form 2 September 2021; accepted 20 October 2021
Available online 6 December 2021
Abstract Here we prepared PEO coatings on Mg alloys in silicate–NaOH–phosphate electrolyte containing different concentrations of NaF addition.The detailed microstructural characterizations combining with potentiodynamic polarization and electrochemical impedance spectra(EIS)were employed to investigate the roles of fluoride in the growth and corrosion properties of PEO coating on Mg. The result shows the introduction of NaF led to a fluoride-containing nanolayer (FNL) formed at the Mg/coating interface. The FNL consists of MgO nanoparticles and insoluble MgF2 nanoparticles (containing rutile phase and cubic phase). The increase in the NaF concentration of the electrolyte increases the thickness and the MgF2 content in the FNL. When anodized in the electrolyte containing 2 g/L NaF, the formed FNL has the highest thickness of 100–200 nm along with the highest value of x of ∼0.6 in (MgO)1-x(MgF2)x resulted in the highest corrosion performance of PEO coating. In addition, when anodized in the electrolyte containing a low NaF concentration (0.4–0.8 g/L), the formed FNL was thin and discontinuous, which would decrease the pore density and increase the coating’s uniformness simultaneously.
Keywords: Mg alloys; Plasma electrolytic oxidation; Corrosion; Pore density; Fluoride.
1. Introduction
Magnesium (Mg) alloys are attractive materials because they decrease the weight of structures in aircraft, automobile industries, and biomedical implants. Nevertheless, the poor corrosion resistance of Mg alloys limits their applications,therefore necessitating the use of a low-cost and effective surface treatment [1]. Plasma electrolytic oxidation (PEO) is a novel surface treatment that forms a thick, anti-corrosion coating on Mg alloys, combining the advantages of electrochemical oxide and plasma discharge modifications [2]. Also,considered an eco-friendly and easy accessibility technique,the PEO has gained increasing attention as one of the most versatile methods for improving corrosion resistance [3], thermal barrier [4], wear resistance [5], as well as photocatalytic[6], antibacterial [7] and biocompatible activities [8] of Mg alloys.
Electrolyte composition applied in the PEO process is one of the main factors affecting the corrosion resistance of oxide coating on Mg alloys. Weak alkaline electrolytes(such as silicate and phosphate systems) that can promote metal passivation to generate plasma discharge were common base electrolytes [9]. Many studies addressed the introduction of additives, such as C3H8O3[10], polytetrafluoroethylene [11], K2TiF6[12], La(NO3)3[13], and NaAlO2[14],into the base electrolyte to improve the coatings’performance.Among them, fluorides are promising additives for PEO coatings [11,15,16]. Liang et al. [16] shown the introduction of KF would decrease the pore diameter, increase compactness,and tune the phase composition of PEO coating. Duan et al.[17]exhibited the PEO coating anodized in the containing KF solution had lower reactivity and higher corrosion resistance.Beside, adding fluoride would increase the uniformness of coating corrosion resistance and suppress the pitting-corrosion[15]. Liu et al. [18] also revealed that KF couldin-situseal the pore in PEO coating during the oxidation process.
Although many studies had already concentrated on technology studies and electrochemical processes on fluoride addition, the controllable growth of PEO coatings with desirable corrosion resistance for applications remains open, and the mechanism of tuning of fluoride is not yet understood.Liu et al. [18] considered MgF2particles would form when PEO process with fluoride addition. They could deposit into the superficial pores, therefore suppressing coating porosity.Duan et al. [17] suggested the high corrosion resistance also comes from the stable and insoluble MgF2content in PEO coating. However, Kazanski et al. [19] showed the addition of fluoride resulted in fewer pores, but pore diameter become larger in their work. Wang et al. [15] prepared PEO coatings under different KF concentrations and found that coating’s corrosion resistance and the pore density significantly improved with the introduction of 2 g/L KF, whereas the XRD results revealed no MgF2in the PEO coating. Kazanski et al.[19] suggested no fluorine-containing crystalline phases could be identified with confidence using XRD patterns, deducing the fluorine-containing material mainly exist in the amorphous phase. Moreover, Nˇemcová et al. [20] shown adding fluoride would reduce the growth rate of PEO coating only at the initial phase, then accelerated to the same level as that without fluoride. Liang et al. [16] suggested fluoride additives would increase the electrolytic conductivity, affecting the spark discharge at the electrolyte/coating interface,eventually changing the porosity and corrosion of PEO coating.
To synthesize application-driven PEO coatings on Mg alloys in a controllable manner, the mechanism for tuning of fluoride on coating’s porosity and corrosion needs to be understood. A comprehensive study is therefore carried out to investigate the composition, morphology, and structure of PEO coatings formed in the containing sodium fluoride(NaF)electrolyte, by employing spherical aberration-correction transmission electron microscope (AC-TEM), scanning electron microscopy (SEM), electrochemical impedance spectroscopy(EIS) and potentiodynamic polarization experiments. A commonly constant current mode was used to prepare the PEO coating on AZ31 magnesium alloy, and the base electrolyte contained Na2SiO3, Na3PO4, and NaOH. By investigating the microstructural characteristics of as-formed PEO coatings at different NaF concentrations,the presence of a containing fluoride nanolayer is revealed and its role in tuning the pore density and corrosion of PEO coating is discussed.
2. Experimental
AZ31 Mg alloy samples with dimensions of 50 × 50 × 1 mm and the surface roughness of Ra≈0.5 μm were used in this work. The PEO treatment was carried out in a 15 L stainless tank equipped with a stirrer and a watercooling apparatus to keep the electrolyte temperature below 27 °C. In the experiment, the sample and the tank’s wall were used as the anode and the cathode, respectively. The base electrolyte contained 12 g/L Na2SiO3, 6 g/L Na3PO4,and 1 g/L NaOH. Concentration of NaF varied from 0 to 2.0 g/L. The coating growth was carried out under a constant current of 3A, with a pulsed unipolar squared waveform,a duty cycle of 10% and frequency of 100 Hz, using a homemade 60 kW PEO station. The oxidation time of all samples was 6 min.
For the SEM surface observation, the specimen was ultrasonically cleaned in ethanol and dried under nitrogen flux.For the SEM cross-sectional observing sample, two bulk specimens were bonded face to face using M-bond 610 epoxy resin glue. And then, the cross-sections of the face-to-face bonded samples were mechanically polished. A precision ion polishing system (PiPS 691, Gatan) with a 5 KeV Ar ion beam was finally employed to mill the cross-sectional surface at a tilt angle of 6°. For the TEM observing sample, the face-to-face bonded samples were cut slice, and then were mechanically thinned, polished, eventually ion etching by 5 keV Ar+ ions.
SEM observations were performed with an FEI Nova NanoSEM 450 using secondary electron mode. Spherical aberration-corrected (Cs-corrected) high angle annular darkfield scanning transmission electron microscopy (HAADFSTEM) and energy-dispersive X-ray spectroscopy (EDS)mapping were performed using an FEI Titan Themis 60–300 kV microscope equipped with a Super-X detector and operating at 300 kV.
Electrochemical tests were performed using a CHI660E electrochemical workstation to evaluate the electrochemical behavior of the oxide coatings. A typical three-electrode cell,including a working electrode with an exposed area of 1 cm2,a graphite counter electrode,and an Ag/AgCl electrode as the reference electrode,was used for measuring the working electrode. A saline (0.1 M NaCl) solution is used as the corrosive electrolyte. After an initial delay of 30 min to stabilize the open-circuit potential, the potentiodynamic polarization tests were conducted from -2.1 to -0.8 V (vs. SCE) at a scan rate of 1 mV/s. The electrochemical impedance spectra (EIS)were acquired over the frequency range between 100 mHz and 200 kHz with an AC signal amplitude of ±10 mV with respect to the open circuit potential (OCP). The fitness of the curves was estimated with the ZSimpWin software.
体验式教育实践模式,就是以师范生职业技能和职业品格培养为核心,以技能训练、教育见习、教育实践、顶岗实习等实训为生长点,形成校内和校外实训相结合,合作培养未来教师的有效机制,促进师范生一体化的培养。这种模式的构建,以学生体验为中心,校内实训和校外实习相配合,是知能一体化的开放式教育实践模式。
3. Results and discussions
3.1. Voltage-time responses and coating morphologies
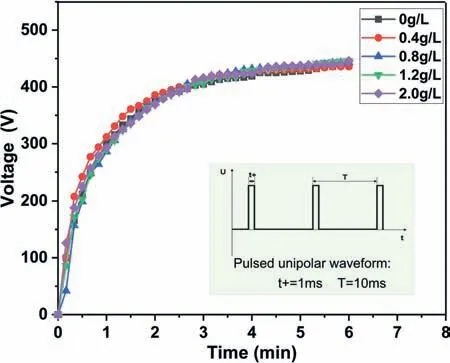
Fig. 1. Variation of voltages-time during the PEO process in the base electrolyte containing different NaF concentrations and (Inset) the voltage waveform. The curve of voltage are the peak values during the anodic cycle of the period.
Fig. 1 illustrates the voltage-time responses obtained during the PEO process in the base electrolyte containing different NaF concentrations and the inset is the applied pulsed unipolar waveform. These curves show the typical electrical characteristics of the PEO process. The voltages increase significantly in a short time in the initial 2 min and then maintain nearly constant. However, these curves exhibit the introduction of NaF has no influence on the voltage-time responses.
Systematic SEM investigations are here used to reveal the effect of NaF on morphologies and pores of PEO coating on AZ-31 Mg alloy.Fig.2a shows a typical top-view micrograph of PEO coating formed only in the base electrolyte, revealing numerous pores on the coating. The enlarged micrograph of Fig. 2a (Fig. 2f) shows the pore diameter range in ∼1–5 μm.Fig. 2b and Fig. 2g are surface SEM images of PEO coatings formed in the base electrolyte containing 0.4 g/L NaF obtained at low and high magnification, respectively. The diameter of pores is almost identical to that of Fig. 2a, whereas the density of pores significantly decreases. With the introduction of 0.8 g/L NaF, the pore density (Fig. 2c,h) further decreases in comparison with Fig. 2b,g. However, with the NaF concentration rise to 1.2 g/L (Fig. 2d,i), the pore density significantly increases. The pore density of PEO coating with 2.0 g/L NaF addition (Fig. 2e,j) are accelerated to the same level as that without fluoride (Fig. 2a) again. It is apparent that the introduction of NaF would suppress the pore density of PEO coating at a low NaF concentration range (0–0.8 g/L)while reversing to the promotion effect at a high concentration range (0.8–2.0 g/L).
3.2. Effect of fluoride on coating’s structures
The PEO coating anodized in the base electrolyte containing 0.8 g/L NaF concentration (with the lowest density of pores) is used to observe the detailed structural feature by SEM and TEM. Fig. 3a and Fig. 3c–e are SEM crosssectional images (secondary electron mode) of the PEO coating and corresponding EDS element mappings, respectively,showing the typical structure of Mg substrate, MgO layer, internal compact layer (in-layer), and outer granular layer (outlayer, with micron-sized pores inside) from bottom to the top.Among them, the out-layer and in-layer consist of Mg, O, Si,and P. The MgO layer contains magnesium oxide, but no Si(Fig. 3d) and P (Fig. 3e). Therefore, the MgO layer could be clearly distinguished from the in-layer and Mg substrate via SEM-EDS images. In addition, Fig. 3f shows little F signal was detected in the whole PEO coating with confidence.
Spherical aberration-corrected TEM (AC-TEM) is further employed to reveal the effect of fluoride on the structures of PEO coatings. Fig. 4a is the cross-sectional high angle annular dark-field scanning transmission electron microscopy(HAADF-STEM) micrograph at the coating/matrix interfacial area. Fig. 4e–i are the corresponding EDS mappings of Fig. 4a, showing the Mg substrate, the MgO layer, and the in-layer from the bottom to the top. Fig. 4b–d are the selected area electron diffraction (SAED) patterns obtained from the three annotated areas in Fig. 4a. Consistent with the above results of SEM, the in-layer of PEO coating consists of Mg,O, P, and Si (Fig. 4e–i) and is amorphous, inferred from the SAED pattern of area 1 (Fig. 4b). The MgO layer is composed of Mg and O, also containing a small amount of P,Si, and F (confirmed with confidence in the EDS profile a in Fig. 4j, corresponding to area a in Fig. 3i of the MgO layer).The SEAD pattern of area 2 (Fig. 4c) shows the MgO layer is polycrystalline. Beside, a ∼89 nm thick fluoride containing nanolayer (FNL) is surprisingly found in the EDS mapping of F (Fig. 4i). The FNL is sandwiched between the MgO layer and the Mg matrix.The chemical composition of the FNL was Mg, F and O (confirmed with confidence in the EDS profile b in Fig. 4j). To identify the phase composition of the FNL,the radial intensity profiles (RIP) of the FNL’s SAED pattern are obtained by a radial rotational average process [21]. As shown in Fig. 4k, the RIP from the MgO layer (red line)shows three peaks with 1/d-spacing of 0.47, 0.67, 0.82 1/˚A,which could be indexed as the (002), (022), and (222) reflection of MgO (ICSD. #9863 [22]). The FNL’s RIP (black line in Fig. 4k) exhibits seven peaks: peaks with 1/d-spacing of 0.46, 0.67, 0.82 1/˚A are from MgO; peaks with 1/d-spacing of 0.31, 0.39, 0.58 1/˚A are the reflection of (110), (101),and (211) from rutile-type MgF2with space groupP42/mnm(ICSD.#394 [23]), respectively; and peaks with 1/d-spacing 0.47, 0.67 1/˚A can be indexed as the (111), (311) from cubic MgF2withPa3(ICSD.# 94,286 [24]), respectively. Cubic MgF2is a modified fluorite-type structure, always obtained at high pressure from the rutile MgF2[24]. The FNL therefore could be identified as a composite nanolayer of MgO and MgF2, i.e. (MgO)1-x(MgF2)x.
A series of TEM samples are further prepared by sampling cross-sections from PEO coating at different NaF concentrations, to reveal the effects of NaF concentration on the FNL.Fig. 5a,c,e,g summarize the cross-sectional HAADF-STEM micrographs of PEO coatings formed in the base electrolyte containing NaF concentration of 0.4 g/L,0.8 g/L,1.2 g/L,and 2.0 g/L, respectively. The corresponding EDS mapping of F of Fig. 5a,c,e,g are illustrated in Fig. 5b,d,f,h, respectively. It is apparent that the FNL is discontinuous at low NaF concentration, then becomes continuous and grows up to hundreds of nanometers at high NaF concentration. Fig. 5a, b shows F distributed as many isolated particles with a diameter in 10–25 nm when the NaF concentration was 0.4 g/L. Fig. 5c, d exhibit the F distributed area became a continuous FNL with a thickness of 60–120 nm at 0.8 g/L NaF. The FNL’ thickness further grows up to 80–150 nm at 1.2 g/L NaF addition(Fig. 5e,f) and 110–220 nm at 2.0 g/L (Fig. 5g-h).

Fig. 2. SEM images of the PEO coating formed in the base electrolyte containing different NaF concentration: (a,f) 0 g/L, (b,g) 0.4 g/L, (c,h) 0.8 g/L, (d,i)1.2 g/L and (e,j) 2.0 g/L. (a–e) were acquired at low magnification and (f–j) were at high magnification.
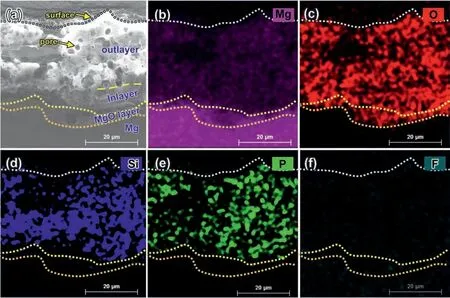
Fig. 3. (a) SEM cross-sectional micrograph and corresponding EDS element mappings of (b) Mg, (c) O, (d) Si, (e) P, and (f) F of the PEO coating formed in the base electrolyte containing 0.8 g/L NaF concentration. no F signal was detected with confidence in Fig. 3f. The labels “out-layer” and “in-layer” mean the outer layer and internal layer, respectively, similarly hereinafter.
The variations of MgF2content in the FNL with the NaF concentration are revealed based on the quantitative EDS analysis. The above results had confirmed the FNL consists of MgO and MgF2. Therefore, the values of the O/F ratio obtained via the quantitative EDS analysis (Fig. 5) are equal to the value of (1-x)/2x, where x is the stoichiometric value of x in (MgO)1-x(MgF2)x. Fig. 6 shows the evolution of the value of x along the white lines in Fig. 5d,f,h, respectively.The max value of x in three samples is at areas ∼25 nm from the Mg/coating interface and the peak values increase from ∼0.17 to 0.6 when NaF increases from 0.8 to 2.0 g/L.Fig. 7a is the atomic resolution TEM image obtained from the MgF2dominated area (the area A in Fig. 5h), showing a cubic MgF2particle with ∼10 nm in diameter. While the atomic resolution TEM image obtained from area B in Fig. 5h exhibits both MgF2and MgO particles has a diameter range of 2–5 nm. The FNL containing a high content and insoluble MgF2would block migrating paths of ions, to improve coating corrosion properties, as well as tuning coating growth.
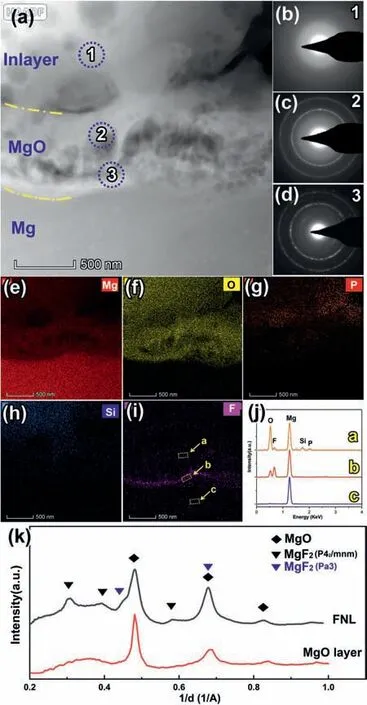
Fig. 4. (a) Cross-sectional HAADF-STEM micrograph of the PEO coating formed in the base electrolyte containing 0.8 g/L NaF with the SAED patterns of annotated (b) area 1, (c) area 2 and (d) area 3 in Fig. 4a. Corresponding EDS element mapping of(e)Mg,(f)O,(g)P,(h)Si and(i)F.(j)the selected area EDS profiles from area a–c in Fig. 3i. (k) Radial average intensity profiles of the SAED patterns from Fig. 4c (the MgO layer) and Fig. 4d (the FNL) (For interpretation of the references to color in this figure, the reader is referred to the web version of this article).
3.3. Growth mechanism of the FNL during PEO process
The growth of the FNL can be understood by considering two aspects: the formation process and the inward migration process. The FNL formation is related to the migration of electrolyte-related ions toward the surface of the Mg matrix.During oxidation, the spark discharge and Mg oxidation occur simultaneously at the electrolyte/coating and coating/Mg interface, respectively [25]. The Mg ions could be produced at Mg/coating interface by the anodic Mg dissolution,and electrolyte ions of SiO32-, PO43-,F-and O2-could be generated at the pore base through the anodic discharge or electrochemical absorption.The Mg2+ions and the electrolyte ions would migrate in the strong electrical field of the PEO process.The migration speed of various ions here in the oxide coating, related to ionic sizes, charges, and local structures of oxide[26].The species of SiO32-,PO43-migrate slower than O2-ions, therefore leading to a layer of relatively pure MgO layer adjacent to the Mg/oxide interface. However, the F-ions migrate much greater than the O2-ions, and that, they would be transported through the MgO layer along the grain boundaries through the point defects and low-coordinated sites of MgO nanoparticles, then deposit by combining with Mg2+at the Mg/coating interface as follow:
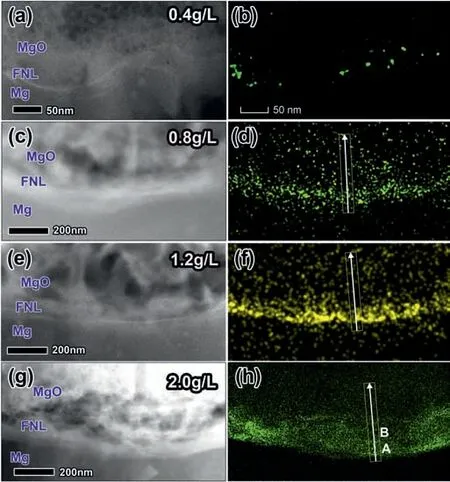
Fig. 5. HAADF images and corresponding EDS element mappings of F of the PEO coating formed in the base electrolyte containing different NaF concentration: (a,b) 0.4 g/L, (c,d) 0.8 g/L, (e,f) 1.2 g/L, and (g,h) 2.0 g/L.
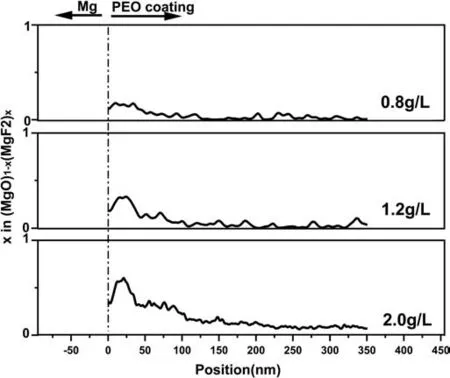
Fig. 6. The stoichiometric ratio x in (MgO)1-x(MgF2)x of the FNL along the white line in Fig. 5d,f,h. The x is calculated based on the quantitative interpretation of the EDS mapping.
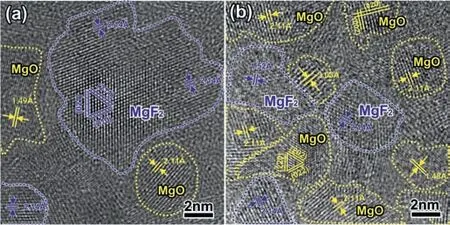
Fig. 7. High-resolution TEM image obtained from (a) area A and (b) area B in Fig. 5h.
This indicates when oxidized in an electrolyte containing lowF-concentration (e.g. 0.4 g/L NaF here), a small amount of MgF2nanoparticles are formed at the MgO/Mg interface, resulting in the formation of a discontinuous FNL(schematic diagrams illustrated in Fig. 8a). When oxidized in an electrolyte containing highF-concentration or long oxidation time, the FNL becomes continuous, and further grows in thickness (illustrated in Fig. 8b).
In addition to the FNL formation, another factor is the inward migration of the FNL. During the PEO process, the inward growth of the Mg/coating interface is widely characterized by the speed of several microns per min (illustrated in Step 1 in Fig. 8) [27,28]. While the above revealed FNL was an ultrathin layer (with ∼15–200 nm-in-thickness)and closely adjacent to the Mg surface. It is apparent that the FNL, containing the Mg/FNL and FNL/MgO interfaces,should keep fast inward migration with the Mg/coating interface. At the Mg/FNL interface, the Mg was oxidized to Mg2+in the Mg/MgF2nanoparticles interfaces, leading the inward migration. However, MgF2nanoparticles at the FNL/MgO interfaces are rutile or cubic phase, and difficult to be dissociated for their high dissociation energy [29]. The inward migration of the FNL/MgO interface could be understood in terms of concepts of the vacancy transport in the anodic film.During the Mg oxidation process at the Mg/MgF2nanoparticles interface, theF-lattice vacancies could be introduced into MgF2nanoparticles, and migrate outward [30]. TheFvacancies in MgF2could only be removed byF-. The O in the Mg-O lattice has 6 coordinations numbers and the first neighbor Mg-O bond length is 2.109 A. In the Mg-F lattice of cubic/rutile MgF2, every F in the Mg-F lattice has 3 coordinations and the Mg-F bond length is 1.984∼1.979 A. Also,O2-ions have a bigger atomic radius thanF-. Therefore,theF-vacancies would accumulate at the FNL/MgO interface, rather than being removed by O2-. As a result, these MgF2nanoparticles in the FNL/MgO interface would become unstable and occur lattice collapse [31], eventually resulting in the inward migration of the FNL/MgO interface (as shown in Step 2 in Fig. 8). Fig. 5c,e,g shows some pores that appear in the MgO layer near the continiuous FNL/MgO interface,which were the residual marks of the volume shrink during the collapse process. In addition, the mechanism also implies that the FNL with high MgF2content would act as a barrier to seriously passivate migrating pathways of other ions, such as Cl-.
3.4. Boosting effect of the FNL on coating’s corrosion properties
The corrosion resistance of the PEO coatings formed in the base electrolyte containing different NaF concentrations is evaluated by electrochemical potentiodynamic polarization in 0.1 M NaCl solution. The polarization curves (showed in Fig. 9) shift to the left (lower current density), indicating the introduction of fluoride resulted in the significant improvement of the coating’s corrosion resistance.
To further understand the effect of the FNL on the corrosion of PEO coating, EIS characteristics of the samples in 0.1 M NaCl solution were, respectively examined after immersion for 30 min at open-circuit potential illustrated in Fig. 10. The study of changes in impedance module(|Z|) at low frequencies shows the highest value of about 7.8 × 10⁶Ω·cm2for the PEO coating anodized in the base electrolyte containing 2.0 g/L NaF (Fig. 10b), signifying its better protective function against corrosive agents. In the case of PEO coatings, the high-frequency (HF) range of EIS diagrams reflects the properties of porous out-layer, while the low-frequency range characterizes the inner compact layer properties [17,32]. As shown in Fig. 10b, the EIS plots show a clear increase in the low-frequency (LF) range with NaF concentration, indicating the improvement of corrosion resistance was due to the change in the internal structure of PEO coatings.
Different EIS behaviors of these samples could be due to their different structure and chemical composition. Taking into account the special morphological structure of the sample(shown in Fig. 3) as well as studies of Duan et al. [17] and Lim et al. [33] about the PEO coating on Mg alloys, the EIS spectrum for the sample formed in the base electrolyte containing 0 g/L NaF was described using an equivalent circuit (EEC) (Fig. 11a) with two time constants. As seen from the ECC, the as-measured system between the reference electrode (SCE) and the working electrode (PEO film) contains three parts: electrolyte, outer porous layer, and dense layer(the internal layer and the MgO layer). The ECC consists of two (R-CPE) components in series with the solution resistance (Rs). Here,R1is the outer-layer resistance of the PEO film paralleled with constant phase element CPE1, andR2is the resistance to the charge transfer of dense area (the inlayer and the MgO layer) in the PEO film in paralleled with CPE2. The above EEC model is the widely accepted model for fitting EIS data of the PEO coated specimens [11,17,34].
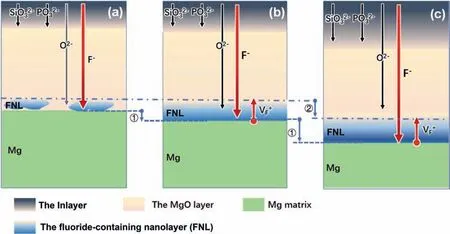
Fig. 8. Schematic diagrams illustrating ionic migrations of anions at Mg/FNL interface during PEO process: (a) isolated MgF2 particle, (b) the formation of FNL, and (c) the inward migration of FNL.

Fig. 9. Potentiodynamic polarization tests of the PEO coatings formed in the base electrolyte containing different NaF concentrations.
The parameters of EEC’s elements that characterize the PEO coating anodized in the base electrolyte containing 0.4 g/L NaF are obtained by fitting the EIS using EEC with three time constants (Fig. 11b). The presence of the third time constant (R3–CPE3), in series withR2, is associated with the discontinuous FNL revealed above (Fig. 5b). During the PEO process, the ionic current at the pore was higher than in other areas due to the relatively lower resistance for charge transfer between the pore base and the Mg matrix [2]. When introducing a low concentration (0.4 g/L) NaF addition, theF-would migrate along with the ionic current and also deposit at coating/Mg interfaces of the pore base.The third time constant (R3–CPE3) is therefore in series with theR2in the EIS experiment(Fig.11b).The parameters of EEC’s elements that characterize the PEO coating anodized in the base electrolyte containing 0.8–2.0 g/L NaF are obtained by fitting the EIS using the EEC also with three time constants (Fig. 11c).The presence of the third time constant (R3–CPE3), in series withR2–CPE2, is the result of the continuous and thick FNL,which completely separated the MgO layer and the Mg matrix (Fig. 5d,f,h). The quality of the fitting to given equivalent circuits was estimated using the chi-square (χ2) values which were of the order of (3.1–4.0) × 10-4.
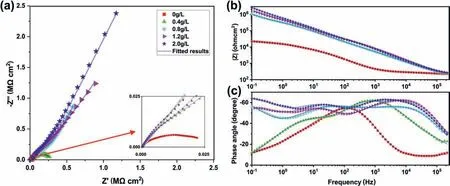
Fig. 10. EIS results of the PEO coatings formed in the base electrolyte containing different NaF concentrations: (a) Nyquist, (b) Bode modulus, and (c) Bode phase plots.

Table 1 Polarization data of PEO coatings formed in the base electrolyte containing different NaF concentrations.
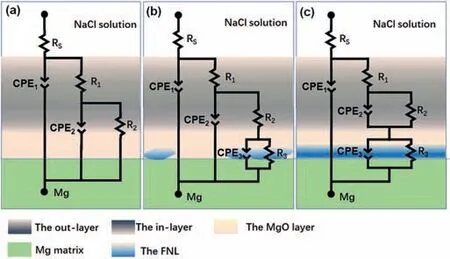
Fig. 11. Equivalent circuits used to fit EIS data of the PEO coatings formed in the base electrolyte containing different NaF concentrations: (a) 0 g/L, (b)0.4 g/L and (c) 0.8–2.0 g/l.
The calculated EECs parameters obtained by analyzing the experimental data in Fig. 10 are tabulated in Table 1. Investigating the relationship between the resistances of the different layers of the PEO coatings and the microstructure analysis (Figs. 2 and 6), theR1(the parameters characterizing the resistance of the out-layer) increases at a low NaF concentration range (0–0.8 g/L) and decreases at high NaF concentration range (0.8–2.0 g/L). This is a consequence of the variation of coating’s porosity, which decreased at low NaF concentration (0–0.8 g/L) and increased at high NaF concentration (0.8–2.0 g/L) (revealed by SEM, Fig. 2). Analysis of the parameters characterizing the fluoride-rich FNL indicates a significant increase in R3with NaF concentrations increase.This is a consequence of an increase in the thickness and the MgF2content in the FNL. Moreover, theR2(parameters characterizing the in-layer and MgO layer)also increases with the decrease of porosity at low NaF concentration range (0–0.8 g/L) and decreases with the increase of porosity at high NaF concentration range (0.8–1.2 g/L) with porosity percentage. However, with the NaF concentration further increase,the residual MgF2nanoparticles in the MgO layer also increase (Fig. 6), therefore resulting in an increase inR2at NaF concentration of 2.0 g/L.The Rtotal=R1+R2+R3was further calculated to present the barrier resistance of the whole PEO coating. The porosity percentage of PEO coatings was measured based on the SEM images in Fig. 2a-e. The FNL thickness was measured based on the TEM cross-sections in Fig. 5b,d,f,h. As shown in Fig. 12, it is apparent that the decrease in porosity percentage and the increase in the FNL thickness both contribute to the increase in the resistance of the whole PEO coating. In addition, the value of R3is much higher than the corresponding value of R2and R1, indicating the FNL would prevent the access of corrosive ions toward the substrate due to the incorporation of MgF2nanoparticles.
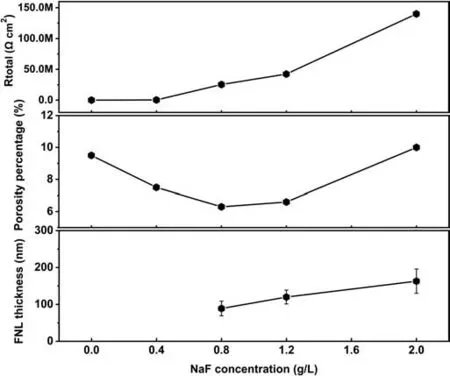
Fig. 12. Variation of Rtotal, porosity percentage and the FNL thickness of the PEO coatings anodized in the base electrolyte containing different NaF concentrations.
3.5. Tuning mechanism of the FNL on the coating’s the pore density

Fig. 13. Schematic diagrams illustrating the mechanism for tuning the pore density: (a) without FNL, (b) with discontinuous FNL, and (c) with continuous and thick FNL.
Based on the comprehensive SEM and TEM study,a mechanism for tuning the pore density of PEO coating is proposed and illustrated schematically in Fig. 13. Due to the high current density at the pore in the PEO process, the Mg/coating interface always consists of many concave boundaries [2,35].As a result, the edge of the concave boundary is closer to the coating surface than other areas, therefore acting as potential easy-breakdown spots. New pores would form at these spots and the pore density of PEO coating increase (shown in Fig. 13a). When anodizing in an electrolyte containing low concentration fluoride, theF-would migrate along with ionic current and first deposit at the concave boundary of the pore base. The EIS analysis also confirmed the introduction of 0.4 g/L NaF resulted in a time constant (R3–CPE3),associated with as-formed discontinuous FNL, was in series with the resistance of the inner layer (R2) (Fig. 11, Table 1).The FNL would selectively increase the resistance for charge transfer as well as ionic transfer at the pore base and decrease the curvature of concave boundary, finally suppressing the formation of easy-breakdown spots (shown in Fig. 13b).In this manner, the pore density of PEO coating would be decreased when the NaF concentration increase from 0 to 0.8 g/L (shown in Fig. 2a-c). In addition, the suppression effect on the concave boundary would also modify the morphology at the Mg/coating interface simultaneously. We further summarized the cross-sectional morphologies of PEO coatings with NaF concentrations. Fig. 14a shows a typical cross-sectional micrograph of PEO coating formed only in the base electrolyte, revealing an undulating Mg/coating interface with several concave boundaries. When anodizing in the base electrolyte containing 0.4 g/L NaF, the Mg/coating interface (Fig. 14b) has an evener boundary than that without NaF. When the NaF concentration further rising to 0.8 g/L,the Mg/coating interfaces (Fig. 14c) shows a flat boundary,and nearly no concave boundaries exist. The above evidence confirms the discontinuous FNL, formed by the introduction of low concentration NaF, would decrease the pore density and reduce the curvature of the Mg/coating interface simultaneously.
However, when the NaF concentration increase from 0.8 g/L to 2.0 g/L, as-formed FNL evolved from a discontinuous layer to a continuous and 100–200 nm-thick layer(Fig. 5). The selective suppression effect on the concave boundary, coming from the discontinuous FNL at the pore base, would decrease. Because the continuous and thick FNL provided the same resistance for charge transfer at the pore base and other areas simultaneously. As a result, the suppression effect of FNL on the concave boundary and easybreakdown spots also decreases (Fig. 13c). As a result, the density of the pores at the surface view (shown in Fig. 2c-e)and the curvature of the Mg/coating interface at the crosssection view (shown in Fig.14c-e)were gradually accelerated to the same level as that without fluoride.
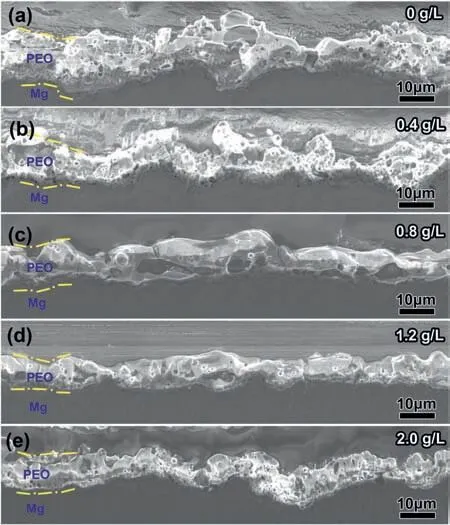
Fig. 14. Evolution of the Mg/coating interface with NaF concentrations: (a)0 g/L, (b) 0.4 g/L, (c) 0.8 g/L, (d) 1.2 g/L and (e) 2.0 g/L.
The evidence revealed above shows that the pore density,Mg/coating interface, and corrosion resistance of PEO coatings on Mg alloys could be tuned by morphologies of the FNL. The thin and discontinuous FNL would decrease the pore density and increase the coating’s uniformness, leading to the improvement of corrosion resistance of the out-layer and the in-layer. The thick and continuous FNL contributes to improvement of the coating’s corrosion resistance of the Mg/PEO coating interface. The present work offers the advantage for designing the controllable growth of morphology and performance of PEO coatings on Mg alloys.
4. Conclusion
In this work, high corrosion-resistant PEO coatings were formed by adding NaF in the base electrolyte.The microstructure of the as-formed samples was studied in detail by advanced electron microscopies. By sampling from PEO coatings with different concentrations of NaF, the mechanism of fluoride for tuning the pore density and corrosion resistance was elucidated. The presence of a nano-sized thin fluoridecontaining nanolayer (FNL) is reporting for the first time,which was confirmed to play a key role in boosting coating corrosion and tuning the pore density of PEO coatings. Due to the smaller atomic radius, the F- ion in PEO coating migrate faster than O2-and other ions, leading to the formation of the FNL close adjacently to the Mg/coating interface. The FNL consists of MgO and insoluble MgF2(containing rutile phase and cubic phase), therefore acting as a barrier to passivate ionic migration of the Mg/coating interface. With the NaF concentration increase, as-formed FNL evolved to a continuous and thick layer. Meanwhile, the MgF2content in the FNL also increases. When anodized in the electrolyte containing 2 g/L NaF, the FNL is ∼100–200 nm in thick and the value of x in(MgO)1-x(MgF2)xis ∼0.6,resulting in a significant improvement of corrosion performance.EIS analysis also confirms the improvement of corrosion mainly came from the contribution of the FNL. In addition, low concentration NaF contributes to obtaining a PEO coating with low pore density,even Mg/coating interface and uniform thickness.
Acknowledgements
Zhu. L. and Li. H. contributed equally to this work. This work is supported by the National Natural Science Foundation of China (Grant No. 51901121) the Natural Science Foundation of Shaanxi Province (Grant No. 2021JM-203, 2019JQ-433, 2020zdzx04-03-02), and the Fundamental Research Funds for the Central Universities (Grant No.GK202103022).
猜你喜欢
杂志排行
Journal of Magnesium and Alloys的其它文章
- NaH doped TiO2 as a high-performance catalyst for Mg/MgH2 cycling stability and room temperature absorption
- Microstructure, mechanical properties and fracture behaviors of large-scale sand-cast Mg-3Y-2Gd-1Nd-0.4Zr alloy
- Enhanced initial biodegradation resistance of the biomedical Mg-Cu alloy by surface nanomodification
- Elucidating the evolution of long-period stacking ordered phase and its effect on deformation behavior in the as-cast Mg-6Gd-1Zn-0.6Zr alloy
- Effect of long-period stacking ordered structure on very high cycle fatigue properties of Mg-Gd-Y-Zn-Zr alloys
- The role of melt cooling rate on the interface between 18R and Mg matrix in Mg97Zn1Y2 alloys
