Elucidating the evolution of long-period stacking ordered phase and its effect on deformation behavior in the as-cast Mg-6Gd-1Zn-0.6Zr alloy
2023-11-18SngwonLeeYejunPrkJonginGoYoungMokKimSeokSuSohnJiehuLiPyukChoi
Sngwon Lee, Yejun Prk, Jongin Go, Young Mok Kim, Seok Su Sohn, Jiehu Li,Pyuk-P Choi,∗
aDepartment of Materials Science and Engineering, Korea Advanced Institute of Science and Technology (KAIST), Daejeon, 34141, Republic of Korea
b Department of Materials Science and Engineering, Kyoto University, Kyoto, 606-8501, Japan
cDepartment of Materials Science and Engineering, Korea University, Seoul, 02841, Republic of Korea
dInstitute of Casting Research, Montanuniverstät Leoben, Leoben, A-8700, Austria
Received 19 April 2023; received in revised form 16 July 2023; accepted 24 July 2023
Available online 9 September 2023
Abstract Herein, the evolution of long-period stacking ordered (LPSO) phases in the as-cast Mg-6Gd-1Zn-0.6Zr (wt.%) alloy are investigated via transmission electron microscopy (TEM) and atom probe tomography (APT). The TEM results reveal that two types of LPSO phase (a bulky interdendritic phase and a plate-like matrix LPSO phase) are formed in the as-cast sample. Most of the LPSO phases are confirmed to be of the 14H type, with a smaller proportion being of the 18R LPSO. Further, the APT results reveal that the composition of the interdendritic LPSO phase is closer to that of the ideal 14H phase compared to the matrix LPSO phase, and both the interdendritic and matrix LPSO phases exhibit a Gd/Zn ratio of 2.5, thereby indicating a deficient Zn content compared to the ideal 14H phase (i.e., 1.3). In addition, the influence of the LPSO phases on the deformation behavior is investigated at different compressive plastic strains using electron backscatter diffraction(EBSD) analysis to reveal twinning and slip behavior during deformation. The results indicate that the LPSO phase induces additional work hardening in the late stage of deformation via the suppression of {10¯11} compressive twinning and the activation of non-basal slip systems.
Keywords: Magnesium alloy; Long-period stacking ordered phase; Transmission electron microscopy; Atom probe tomography; Work hardening behavior.
1. Introduction
Magnesium (Mg) alloys have attracted increasing attention in the automobile, aerospace, and electronic device industries due to their low density (1.74 g/cm3), high specific strength(158 kN·m/kg), high damping capacity, and electromagnetic resistance [1–5]. However, despite their potential as an alternative to lightweight aluminum alloys, the application of Mg alloys as structural materials in components that require high strength has been limited due to their relatively low strength compared to that of other structural metallic materials [1].In the last few decades, a variety of advanced processing technologies or alloy systems have been developed to improve the strength of the Mg alloy. For example, the developments of extrusion [6], rolling, differential speed rolling(DSR) [7], equal channel angular pressing (ECAP) [8], and accumulative roll bonding (ARB) [9] have improved the tensile yield strength (TYS) to ∼400 MPa via grain refinement due to dynamic recrystallization (DRX) during processing.Moreover, the combination of alloy design and advanced processing technology can further enhance the mechanical properties. The alloy design strategies mainly involve the formulation of either rare-earth element (RE)-free Mg alloys or REcontaining Mg alloys. Among the RE-free alloys, the most widely used alloy systems are the Mg-Al based alloys such as the Mg-Al-Zn and Mg-Al-Mn series [10]. These alloys exhibit moderate strength and ductility at low cost. Moreover,the addition of Ca, Li, and Sr can further improve their mechanical properties by inducing thermally stable precipitates or additional slip systems [10].
In terms of strength, however, the Mg-RE alloys have attracted more attention than the RE-free alloys [11]. Since Kawamura et al. [12] reported the Mg-Zn-Y alloy system with a TYS above 600 MPa, various alloys including Gd, Y,Dy, Ho, Sr, and Er have been developed [13–16]. Most Mg-RE alloys exhibit superior strengths of above 400 MPa,with a ductility of 10%[11].In particular,the Mg-RE alloys containing intermetallic long-period stacking ordered (LPSO) phases(e.g., the Mg-Gd-Zn, Mg-Y-Zn, and Mg-Y-Co alloys) exhibit good ductility and high strength [17–20]. For this reason,more research has been conducted to unveil the unique characteristics of the LPSO phases and utilize their advantages.The LPSO phase is characterized as a chemically and structurally ordered phase consisting of a set of plate-like building blocks with various stacking sequences along thec-axis, with designations such as 10H, 14H, 18R, 24R, and 192R. Each building block is composed of four RE-rich atomic layers with an ordered L12structure lying in the basal plane of Mg,and is separated from the next such building block by 0–4 basal planes of Mg [21–24]. These structures are denoted as rhombohedral(R)or hexagonal(H)depending on whether the number of Mg layers is even or odd, respectively [25]. Due to its unique structure and homogeneous distribution within the alloy matrix, the LPSO phase effectively enhances the strength and elongation of the Mg-RE-TM alloy via kink band deformation,inhibition of deformation twinning,and grain refining during the DRX process [25]. In addition, the LPSO phase can be formed during the casting process without any heat treatment[26],and its morphology can be refined by further heat treatment, which results in additional strengthening effects [27]. Thus, this approach has the advantages of simplicity and saving time compared to other long-term aging or thermo-mechanical processing methods.
During the past two decades, the microstructural evolution of LPSO-containing alloys and their strengthening mechanisms have been widely investigated [19,21,28–32]. To obtain an optimized LPSO phase in the Mg-RE-TM alloy, it is particularly crucial to understand the formation mechanism and solute partitioning behavior of the LPSO phases. In 2011,Egusa and Abe [21] proposed the ideal stoichiometry model of 14H and 18R LPSO phases by scanning transmission electron microscopy (STEM) observations, and employed firstprinciples calculations to explain the non-stoichiometry in the experimentally-determined LPSO compositions in terms of energy-favored structural relaxation due to the substitution of Mg atoms in the RE and Zn positions. It was suggested that the RE-TM interactions would be important in terms of the LPSO phase stability. In addition, because atomic-scale compositional investigations are needed in order to reveal the evolution behavior of the LPSO phases, some atom probe tomography (APT) studies have been reported [19,28]. For example, Kim et al. [19] used APT to investigate the compositional evolution of the 18R LPSO phase in the Mg-Y-Zn alloy, and reported that the initially stoichiometric ratio of Zn/Y in the building blocks gradually increased with increasing annealing time.More recently,Inoue et al.[28]conducted a correlative APT and TEM analysis to investigate the growth mechanism of the LPSO phase in the Mg-Al-Gd alloy, and revealed that the enrichment of Gd atoms precedes the enrichment of Al atoms, so that the growth of the LPSO phase is controlled by the diffusion of Al atoms. Nevertheless, there is still a lack of atomic-scale compositional analyses of more diverse alloy systems in the as-cast, heat-treated, and thermomechanically processed conditions. Meanwhile, strengthening mechanisms of the LPSO phase have been suggested typically in terms of kink band deformation [29], inhibition of deformation twinning [30,31], and grain refinement [32]. For instance, Shao et al. [29] reported that multiple kink bands were formed in the 18R LPSO region, and that they contribute to the strengthening of the Mg-Zn-Y alloy according to the Hall-Petch relationship. Also, Kim et al. [30] and Li et al. [31] respectively observed the suppression of deformation twinning of 18R LPSO in the Mg-Y-Zn and Mg-Gd-Ga alloy systems. Nevertheless, a detailed evaluation of the strengthening effect of the LPSO phase itself, independently from compositional or microstructural effects, is still lacking.
Herein, the microstructural characteristics of the LPSO phase, and its influence on the deformation behavior in the as-cast Mg-6Gd-1Zn-0.6Zr (wt.%) alloy, are investigated. For the atomic-scale characterization, TEM and APT analyses are conducted to explore the structure and chemical composition of the LPSO phase. The ordering sequence and solute atom partitioning behaviors in both the bulky interdendritic phase and the plate-like matrix LPSO phase formed in the casting process are examined. Also, the strengthening effect of the LPSO phase during compressive deformation is evaluated by comparing the deformation behaviors of the as-cast and homogenized states, which have almost the same microstructure except for the existence of the LPSO phase. From the interrupted compressive tests, the effects of the LPSO phase upon the mechanical properties are discussed with respect to the activation of the deformation slip and twinning.
2. Experimental procedures
Herein, alloy compositions are given in wt.% unless stated otherwise. The Mg-6Gd-1Zn-0.6Zr alloy was prepared via melting of the pure Mg, pure Zn, Mg-28Gd master alloy,and Mg-33Zr in an electric resistance furnace under the protection of a mixed gas (CO2and SF6), followed by casting at 760 °C into a die mold that had been preheated to 200°C. To fully dissolve the LPSO phases, the as-cast alloy was homogenized at 515 °C for 24 h under an Ar atmosphere. For the metallographic analysis,both the as-cast and homogenized samples were mechanically ground and polished with SiC papers, 1–3 μm diamond suspensions, and a 0.25 μm colloidal silica suspension. The microstructures were observed via optical microscopy (OM) (BM-5000, OLYMPUS), and field emission scanning electron microscopy (FE-SEM) (SU5000,HITACHI). The phases of the as-cast and homogenized alloy were identified by using an X-ray diffractometer (XRD)(SmartLab, RIGAKU) with monochromated Cu-Kα1 radiation, a voltage of 45 kV, a dwell time of 0.1 s, and a step of 0.01° in the range of 20–80°. The LPSO phase in the as-cast alloy was analyzed via high-angle annular dark-field scanning transmission electron microscopy (HAADF-STEM)(Tecnai G2 F30 S-Twin, FEI) at an accelerating voltage of 300 kV, along with selected area electron diffraction (SAED).The TEM sample with a diameter of 3 mm disk was prepared by using an Ar ion polisher (PIPS Ⅱ, GATAN) with a voltage from 4 to 2 kV, a gun angle from 8 to 2°, and a rotation speed of 3 rpm without cooling. The composition of the LPSO phase was characterized by atom probe tomography (APT) (LEAP4000X HR, CAMECA) at a pulse fraction of 15%, a pulse frequency of 200 kHz, a detection rate of 0.5%, and a base temperature of 50 K. The APT tips were prepared by using a focused ion beam (FIB) (Helios G4,FEI). The APT data reconstructions were performed using the IVAS 3.8.4 software. For the compression test, cylindrical specimens with a height of 6 mm and a diameter of 3 mm were machined, and the mechanical tests were performed at a strain rate of 0.001 s–1at room temperature using a universal testing machine (Instron 3367, CANTON). The deformed specimens were ground to mid-thickness along the transverse direction, and polished with 1–3 μm diamond suspensions,and a 0.25 μm colloidal silica suspension for the electron backscatter diffraction (EBSD) analysis with an acceleration voltage of 15 kV and a step size of 1.2 μm in the scanning area of 1.3 mm2. The EBSD data were analyzed using the TSL OIM analysis 7 software.
3. Results and discussion
3.1. The microstructures of the as-cast and homogenized samples
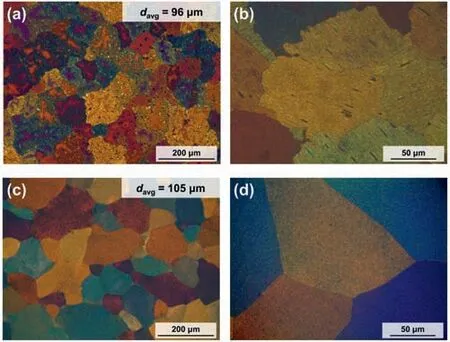
Fig.1. The OM images of(a,b)the as-cast and(c,d)homogenized samples.Here, davg denotes the average grain size.
The OM images of the as-cast and homogenized samples are presented in Fig. 1. Here, equiaxed grains with an average size of 96 ± 10 μm are observed after the casting process(Fig. 1a). Moreover, mottled features are observed inside the grains, thus indicating an inhomogeneous compositional distribution. Further, the magnified image of the as-cast sample in Fig. 1b reveals the presence of plate-like and bulky long-period stacking ordered (LPSO) phases inside grains,along with serrated grain boundaries. Grain boundary serration is generally observed during the hot deformation of various metallic materials as a result of the DRX behavior[33–35]; however, serration can also be caused by the grain boundary migration pinning effects of precipitates during the casting process [36]. Thus, the serrated grain boundaries in the as-cast sample could be considered to be a result of grain boundary pinning by the LPSO phases during solidification.
By contrast, the mottled microstructures are no longer observed in the homogenized sample (Fig. 1c), thus suggesting that the chemical composition is homogeneous throughout the material. Moreover, the average grain size is seen to have increased slightly from 96 ± 10 for the as-cast sample to 105±10 μm the homogenized sample due to grain growth during the thermal treatment. Further, the magnified image in Fig.1d reveals that the secondary phases have fully dissolved,and the grain boundary structure of the homogenized sample is flattened (Fig. 1d). These results suggest that grain boundary flattening occurs in order to minimize the grain boundary energy when no more precipitates were present to pin the grain boundary and prevent migration during grain growth.
The distributions of the secondary phases are revealed by the backscattered electron (BSE) images in Fig. 2. Here, the as-cast sample clearly exhibits bright-colored bulky secondary phases inside the grains and along the grain boundaries(Fig. 2a). The regions of bright contrast indicate the intermetallic compounds with greater contents of the relatively high atomic number (Z) elements Gd (Z= 64) and Zn(Z= 30) compared to Mg (Z= 12), such as the L12structured Gd8Zn6building blocks of the LPSO phase. In addition, the magnified BSE image in Fig. 2b reveals the formation of dense plate-like phases in the grain interior along with the bulky phases, which correspond to the matrix LPSO phase and the interdendritic LPSO phase, respectively [19].Meanwhile, the homogenized sample does not exhibit any secondary phases, as shown in Fig. 2c and d, thereby indicating that the homogenization heat-treatment temperature and time were enough to dissolve the secondary phases in this alloy system.

Fig. 3. The XRD spectra of the as-cast (black) and homogenized (red) Mg-6Gd-1Zn-0.6Zr alloys.
The XRD patterns of the as-cast and homogenized samples are presented in Fig. 3. Here, the strong hexagonal closepacked (HCP)α-Mg peaks, indicated as circle, are observed in both the as-cast and homogenized samples. However, the as-cast sample exhibits additional peaks, indicated as diamond, due to the 14H LPSO phase, which has a hexagonal structure space groupP63/mcm(international no. 193) and lattice parameters ofa= 1.11 nm andc= 3.62 nm [21].These results are consistent with the OM and SEM-BSE observations in Figs. 1 and 2, but differ from those of previous studies, which reported the formation of LPSO phases in the Mg-Gd-Zn alloy system even after homogenization heat treatment [17,37]. In the present work, the fully dissolved state of the homogenized sample may be due to the relatively low Gd content in the Mg-6Gd-1Zn-0.6Zr (Mg-1Gd-0.4Zn-0.2Zr in at.%) alloy, compared to the 2.5 at.% Gd in the alloys that were used in the previous studies.
3.2. Characterization of the LPSO phase in the as-cast condition
The LPSO phases formed in the as-cast sample are further revealed by the HAADF-STEM analyses in Fig. 4. The locations of the interdendritic LPSO phase and the matrix LPSO phase are labelled as Areas 1 and 2, respectively,in Fig. 4a. Here, the inset SAED pattern clearly indicates that the LPSO phase is of the 14H type, which has an –A’B’C’A’CACA’C’B’A’BAB– stacking sequence along thecaxis [38]. In particular, the –A’B’C’A’– building block indicates the high concentration of Gd and Zn atoms due to the formation of L12-structured Gd8Zn6. Meanwhile, the magnified HAADF images in Fig. 4b and c clearly indicate that the interdendritic LPSO region consists of densely-distributed–A’B’C’A’– building blocks (Fig. 4b), while the plate-like matrix LPSO region exhibits a relatively less dense distribution of building blocks separated by thickα-Mg basal planes(Fig.4c).For each phase,the interspacings between neighboring building blocks were measured in the regions of interest labelled as ROI 1 and ROI 2, respectively, and the results are presented in Fig. 4d. Thus, for the interdendritic LPSO (ROI 1), the interspacing is about 1.86 nm, which corresponds to 7 layers of (0002)α-Mg, where thed-spacing of (0002)α-Mgobtained from the XRD result is 0.261 nm. However, some layers have an interspacing of 1.60 nm, which is corresponds to 6 layers of (0002)α-Mg. Taken together, these results indicate that the main LPSO type formed in the as-cast condition is 14H LPSO, whose –A’B’C’A’– building blocks repeat for every 7 layers of (0002)α-Mg, while some of the LPSO phases are of the 18R type (–A’B’C’A’CAC’A’B’C’BCB’C’A’B’AB–),whose–A’B’C’A’–building blocks repeat for every 6 layers of (0002)α-Mg. The formation of the 18R LPSO phase in the interdendritic LPSO can be related to the chemical composition, which will be discussed in the following paragraphs.Meanwhile, the matrix LPSO in ROI 2 exhibits a spacing of 1.86 nm, thereby indicating the formation 14H LPSO.
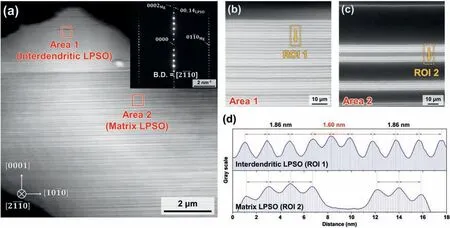
Fig. 4. (a) The STEM-HAADF image of the region containing interdendritic (Area 1) and matrix (Area 2) LPSO phases, along with an inset showing the SAED pattern. Magnified images of (b) Area 1 and (c) Area 2. (d) The linear contrast profiles of the regions of interest (ROI 1 and ROI 2) in (b) and (c),representing the interspacings of –A’B’C’A’– building blocks.

Fig. 5. The APT results of the interdendritic LPSO phase in the as-cast sample: (a) the 3D atom maps; (b) the 1D concentration profile of the region-of-interest marked by the arrow in (a); (c) the radial distribution function (RDF) with Gd ion centering.
The APT compositional analysis of the interdendritic LPSO phase is presented in Fig. 5. The solute distribution near the interface between the interdendritic LPSO phase and the matrix is indicated by the three-dimensional (3D) atom map in Fig. 5a. This clearly reveals that the Gd and Zn atoms are strongly partitioned into the LPSO phase to form the Gd8Zn6building block, while the Zr is homogeneously distributed throughout the specimen. The one-dimensional (1D)concentration profile of the ROI along the direction of the yellow arrow in Fig. 5a is presented in Fig. 5b, and clearly illustrates the compositional variation near the LPSO/α-Mg interface region. The results indicate that the interdendritic LPSO phase contains about 9.0 at.% Gd and 4.6 at.% Zn,while theα-Mg contains 0.7 at.% Gd and 0.04 at.% Zn,as summarized in Table 1. In addition, the plate-like LPSO phases near the bulky interdendritic LPSO phase exhibit a similar composition to that of the bulky LPSO phase, thus indicating that the plate-like LPSO phase near the interdendritic LPSO phase is part of the interdendritic LPSO phase in terms of composition. In addition,the radial distribution function (RDF) of each element with Gd ion centering is shown in Fig. 5c. This represents the degree of segregation or separation behavior of each solute element from a concentration normalized by the bulk composition as a function of distance from a Gd atom. Clearly, Gd, Zn, and Zr exhibit bulk normalized concentrations greater than 1, thus indicating locally enhanced concentration near to Gd atoms. By contrast, Mg exhibits a bulk normalized concentration lower than 1, thus indicating local depletion near to Gd atoms. This indicates that the Gd and Zn strongly agglomerate with each other to form the LPSO phases, and that Zr is also partitioned to the LPSO phase, rather than to theα-Mg.
For comparison, the APT results of the matrix LPSO region are presented in Fig. 6. Similarly to the interdendritic LPSO phase (Fig. 5), the 3D atomic distribution of the matrix LPSO region reveals the formation of Gd- and Zn-rich LPSO phases, as shown in Fig. 6a. However, there is a clear compositional difference between the matrix and interdendritic LPSO phases. When the compositions of the plate-like matrix LPSO phase are measured at the peaks labelled 1–6 in Fig. 6b, all peaks exhibit Gd and Zn concentrations of less than 8.5 and 3.5 at.%, respectively, which are lower than those observed in the interdendritic LPSO phase (Fig. 5b).Nevertheless, the RDF results for the matrix LPSO phase again indicate that Gd, Zn, and Zr each exhibit a normalized concentration greater than 1, while that of Mg is lower than 1 (Fig. 6c). Thus, as with the interdendritic LPSO phase,the matrix LPSO phase exhibits the segregation (concentration) behavior of Zn, and Zr atoms, and the depletion of Mg atoms, with respect to Gd atoms. However, even though the Zn concentration in the matrix LPSO is lower than that of the interdendritic LPSO, the bulk normalized Zn concentration in the matrix LPSO region is much higher than that of the interdendritic LPSO region. This can be attributed to the low concentration of Zn in the matrix LPSO region. The Zn concentrations of the entire APT tips of the interdendritic and matrix LPSO regions are 3.0 and 0.3 at.%, respectively. Thus,the high bulk normalized concentration of Zn represents an insufficient amount of Zn in the matrix LPSO region to form more LPSO phases, as shown by the TEM and APT results in Figs. 4–6. By contrast, the interdendritic LPSO region has relatively higher amounts of Gd and Zn, which are sufficient to form the 18R LPSO, because the18R LPSO requires much more Gd and Zn compared to the 14H LPSO [21].

Table 1 The chemical compositions of the α-Mg matrix and LPSO phases in the interdendritic and matrix regions of the as-cast sample.

Fig. 6. The APT results of the matrix LPSO phase in the as-cast sample: (a) the 3D atom maps; (b) the 1D concentration profile of the region-of-interest as marked in (a); (c) the radial distribution function (RDF) with Gd ion centering.
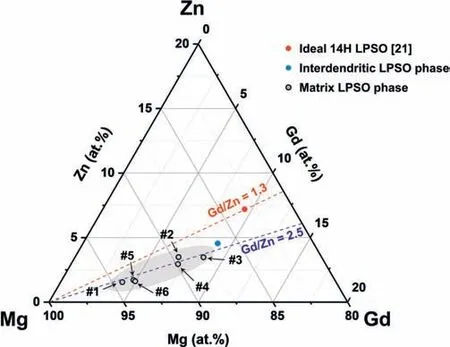
Fig. 7. Compositional plots of the LPSO phases on the Mg-Gd-Zn ternary phase diagram.
The compositions of the interdendritic and matrix LPSO phases are plotted in a ternary diagram in Fig. 7. The interdendritic LPSO phase (full blue circle) is located close to the ideal 14H LPSO phase (full red circle), which has a composition of Mg83.3-Gd9.5-Zn7.2 (at.%) [21]. Compared to this ideal composition,the interdendritic LPSO phase shows a lack of Zn content,while its Gd content is similar to the ideal composition.By contrast,the matrix LPSO phases(black open circles)are located far away from the ideal 14H LPSO phase,indicating a lack of Gd and Zn compared to the ideal 14H LPSO composition.Meanwhile,even though the compositions of the interdendritic and matrix LPSO phases are distinct, both have a Gd/Zn ratio of approximately 2.5, thus indicating that the precondition for LPSO phase formation is the same for both the interdendritic and matrix regions. Considering the RDF results in Fig. 6c, while the insufficient Zn content leads to a less dense distribution of LPSO phases in the matrix region,the Gd content is sufficient. Moreover, both the interdendritic and matrix LPSO phases exhibit higher Gd/Zn ratios than that of the ideal 14H LPSO (Gd/Zn = 1.3). According to a recent APT study on the Mg-Al-Gd alloy, a sufficient concentration of Gd atoms precedes a sufficient concentration of Al atoms for the formation of the building blocks [28]. This suggests that the insufficient concentration of Zn in the present study could be a dominant factor determining the volume fraction and non-stoichiometric composition of the LPSO phase.
3.3. The influence of the LPSO phase on the deformation behavior
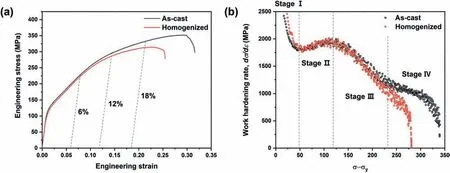
Fig. 8. The compressive test results: (a) the engineering stress-strain curves, and (b) the work hardening rate as a function of true stress.

Table 2 The compressive properties of the as-cast and homogenized samples.
The effect of the LPSO phase upon the deformation behavior of the as-cast sample is revealed by the compressive test results in Fig.8.Here,the engineering stress-strain curves in Fig. 8a indicate that the as-cast and homogenized samples show almost identical plastic deformation behaviors during the early stage of deformation. With increasing plastic strain,however, the as-cast sample exhibits higher work hardening behavior and ultimate compressive strength (σ c) than those of the homogenized sample. The mechanical properties of the samples are listed in Table 2, where the as-cast and homogenized samples exhibit compressive yield strengths (σy)of 112 ± 1.7 and 108 ± 4.5 MPa, respectively, reflecting no statistically significant difference regarding the existence of LPSO phases. By contrast, the ultimate compressive strengths(σc) of the as-cast and homogenized samples are 349 ± 2.5 and 318 ± 3.0 MPa, respectively, indicating a 9.7% higher value for the as-cast sample due to work hardening during deformation. Further, the work hardening behavior according to dislocation density is indicated by the plot of work hardening rate (dσ/dε, whereσandεare the true stress and strain)againstσ-σyin Fig. 8b [39]. Here, the work hardening behavior exhibits four stages. In stage I, a decrease in the work hardening rate is observed, and is a typical feature of the formation of deformation twins [40,41]. This is followed by stage Ⅱ, during which an increase in the work hardening rate occurs due to the interaction between dislocations and deformation twins [42]. A linear decrease in the work hardening rate is then observed during stage Ⅲ, which is due to dynamic recovery [39,43]. Notably, similar work hardening levels are observed for both the as-cast and homogenized samples during stages I–III, but only the as-cast sample exhibits an additional work hardening effect under highσ-σy(> 230 MPa) (i.e., stage Ⅳ), as indicated by the shallower slope of the work hardening rate compared to stage Ⅲ, thus leading to a higher compressive stress in the as-cast sample.
The work hardening behaviors of the as-cast and homogenized samples during compressive deformation are further elucidated under plastic strains of 6, 12, and 18% in Fig. 9. Here, the inverse pole figure (IPF) maps in the top and middle rows reveal the microstructural evolution of the ascast and homogenized samples,respectively,and these images further reveal the evolution of deformation twinning during compressive deformation. Thus, at the plastic strain of 6%,{10¯12} tensile twinning, which has a wide morphology and an axis/angle pair of 86°/<11¯20>, occurs in both samples.This {10¯12} tensile twinning is one of the main deformation mechanisms, alongside the<11¯20> basal slip system in the early stage of deformation due to the low critical resolved shear stress (CRSS) [44]. The area fraction of {10¯12} tensile twinning was measured as 7.8 and 15.8% for the as-cast and homogenized samples, respectively. The lower fraction in the as-cast sample could be attributed to a disturbance of the LPSO phase upon deformation twinning[30,31].Even though there are some differences in the area fraction of {10¯12} tensile twinning between the samples, the yield strength and work hardening during stages Ⅰand Ⅱare almost identical(Fig. 8b), thus indicating that the {10¯12} tensile twinning is partially suppressed by the LPSO phases in the as-cast sample, but the LPSO phases and the differences in the {10¯12}twin boundaries cannot effectively affect on the strengthening mechanism relating the interruption of the<11¯20> basal dislocation slip behavior in this stage. Consequently, the as-cast and homogenized samples exhibit similar yield strengths and work hardening behaviors in the early stage of deformation.
Under the plastic strain of 12%, the {10¯12} tensile twins continue to grow in both the as-cast and homogenized samples, thereby accommodating the plastic strain during deformation [41]. In addition, some {10¯11} compressive twinning and{10¯11}–{10¯12}double twinning have occurred in the homogenized sample, with narrow morphologies and axis/angle pairs of 56°/<11¯20> and 38°/<11¯20>, respectively. Due to the high CRSS of the {10¯11} compressive twinning, these twins are formed in the high-stress state in the late stage of deformation [44]. Under the plastic strain of 18%, {10¯11}compressive twinning and {10¯11}–{10¯12} double twins are dominantly observed in both samples. The linear density of these twins in the as-cast sample (0.4%) is less than onethird that of the homogenized sample (1.4%). The influence of the LPSO structure on {10¯11} compressive twinning is represented in Fig. 10. The SEM observation is conducted at the twinning region in 18%deformed as-cast sample(Fig. 10a), and it clearly illustrates that a severe kink band deformation occurred at the twin boundaries, as well as inside the twins (Fig. 10c). It indicates that the compressive twinning is accompanied by the kink band deformation of the LPSO phase. Based on these observations, it can be concluded that the presence of LPSO phases in the as-cast sample leads to the suppression of twinning behavior, compared to the LPSO-free homogenized sample.

Fig. 9. Inverse pole figure (IPF) maps of as-cast and homogenized samples after compression with the plastic strain of 6%, 12%, and 18%. Here, Atensile twin and Lcompressive/double twin denote the area fraction of tensile twins and linear fraction of compressive/double twins, respectively.

Fig. 10. (a) An IPF map of the 18% deformed as-cast sample indicating the location of {10¯11} compressive twins, (b) a SEM-BSE image of twinned region,and (c) a magnified image showing the kinked LPSO structure inside the twin.

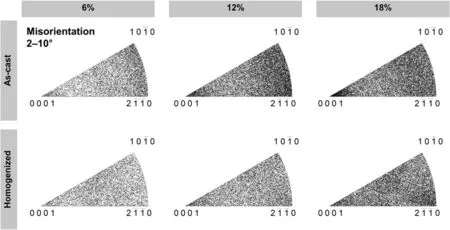
Fig. 11. The intra-grain misorientation axes (IGMA) analysis of the interrupted compression tests.

4. Conclusions
In this study, the evolution of the long-period stacking ordered (LPSO) phase and its effects on the deformation behavior of the as-cast and homogenized Mg-6Gd-1Zn-0.6Zr alloys were elucidated with aid of transmission electron microscopy (TEM), atom probe tomography (APT), and compressive tests. In the as-cast condition, two distinct LPSO phases were formed, namely a bulky interdendritic LPSO phase and a plate-like matrix LPSO phase. The LPSO phase was confirmed to be mainly of the 14H type,although a small amount of 18R type was present. In the APT compositional analyses, the interdendritic and matrix LPSO phases were shown to have non-stoichiometric compositions, with the interdendritic LPSO being closer to the ideal 14H LPSO composition than the matrix LPSO. Both the interdendritic and matrix LPSO phases exhibited a Gd/Zn ratio of 2.5, which is higher than that of the ideal 14H (i.e., 1.3), thereby indicating that the insufficient Zn might be a dominant factor determining the volume fraction and non-stoichiometric composition of this alloy system. According to the compression tests, the as-cast and homogenized samples exhibited almost identical yield strengths and work hardening behaviors in the early stage of deformation. However, the as-cast sample showed a higher ultimate compressive strength due to the occurrence of an additional work hardening stage, which could be attributed to the activation of the non-basal slip system caused by the LPSO phase.
Declaration of competing interest
The authors declare that they have no known competing financial interests or personal relationships that could have appeared to influence the work reported in this paper.
Acknowledgments
This work was supported by the National Research Foundation of Korea (Grant number: NRF-2019K1A3A1A18116059 and NRF-2023R1A2C200529811),Austrian Science Fund (FWF) (P 32378-N37), and Federal Ministry of Austria Education, Science and Research(BMBWF) (KR 06/2020).
杂志排行
Journal of Magnesium and Alloys的其它文章
- NaH doped TiO2 as a high-performance catalyst for Mg/MgH2 cycling stability and room temperature absorption
- Microstructure, mechanical properties and fracture behaviors of large-scale sand-cast Mg-3Y-2Gd-1Nd-0.4Zr alloy
- Enhanced initial biodegradation resistance of the biomedical Mg-Cu alloy by surface nanomodification
- Effect of long-period stacking ordered structure on very high cycle fatigue properties of Mg-Gd-Y-Zn-Zr alloys
- The mechanism for tuning the corrosion resistance and pore density of plasma electrolytic oxidation (PEO) coatings on Mg alloy with fluoride addition
- The role of melt cooling rate on the interface between 18R and Mg matrix in Mg97Zn1Y2 alloys
