Dynamic grouping control of electric vehicles based on improved k-means algorithm for wind power fluctuations suppression
2023-10-25YangYuMaiLiuDongyangChenYuhangHuoWentaoLu
Yang Yu,Mai Liu,Dongyang Chen,Yuhang Huo,Wentao Lu
1.State Key Laboratory of Alternate Electrical Power System with Renewable Energy Sources,North China Electric Power University (Baoding),Baoding,P.R.China
2.Key Laboratory of Distributed Energy Storage and Microgrid of Hebei Province,North China Electric Power University (Baoding),Baoding,P.R.China
Abstract: To address the significant lifecycle degradation and inadequate state of charge (SOC) balance of electric vehicles(EVs) when mitigating wind power fluctuations,a dynamic grouping control strategy is proposed for EVs based on an improved k-means algorithm.First,a swing door trending (SDT) algorithm based on compression result feedback was designed to extract the feature data points of wind power.The gating coefficient of the SDT was adjusted based on the compression ratio and deviation,enabling the acquisition of grid-connected wind power signals through linear interpolation.Second,a novel algorithm called IDOA-KM is proposed,which utilizes the Improved Dingo Optimization Algorithm (IDOA)to optimize the clustering centers of the k-means algorithm,aiming to address its dependence and sensitivity on the initial centers.The EVs were categorized into priority charging,standby,and priority discharging groups using the IDOA-KM.Finally,an two-layer power distribution scheme for EVs was devised.The upper layer determines the charging/discharging sequences of the three EV groups and their corresponding power signals.The lower layer allocates power signals to each EV based on the maximum charging/discharging power or SOC equalization principles.The simulation results demonstrate the effectiveness of the proposed control strategy in accurately tracking grid power signals,smoothing wind power fluctuations,mitigating EV degradation,and enhancing the SOC balance.
Keywords: Electric vehicles; Wind power fluctuation smoothing; Improved k-means; Power allocation; Swing door trending
0 Introduction
Considering the pressing challenges such as global resource constraints and environmental pollution,the integration of clean energy sources,such as wind power,into the grid is increasingly prevalent.However,the inherent variability of wind power can lead to substantial fluctuations in the grid-connected power,thereby posing risks to the stability and safety of the power system [1-2].Therefore,the implementation of effective strategies to mitigate windpower fluctuations is critical.Electric vehicles (EVs),as a new load type,offer unique advantages such as scheduling flexibility,bi-directionality,and adaptability.Relevant projections estimate that their number could reach 30 million by 2030 and 80 million by 2050 [3].Their massive potential ownership and fast charging/discharging capabilities have made EVs a high-quality resource for smoothing wind-power fluctuations.
When using EVs to mitigate wind power integration,the power deviation between the grid-connected wind power command signal and predicted power must be calculated.The methods for obtaining a grid-connected command signal can be categorized as filtering-based [4-5],optimization-based [6-7] and direct acquisition [8-9].Filtering methods,such as adaptive wavelet decomposition[4-5] extract and mitigate high-frequency wind power components using EVs.Although some fluctuations are reduced,these methods require greater EV capacity.To reduce volatility more accurately,optimization methods construct objective functions using techniques such as particle swarm optimization [6] and neural networks[7] to minimize fluctuations and derive grid-connected signals.While they can track deviations,they have high computational complexity.To effectively smoothen the fluctuations while ensuring simplicity,this study proposes a swing door trending (SDT) algorithm based on compression feedback to acquire grid-connected wind power signals directly.
After obtaining the grid-connected signal,the EVs help the wind power track the signal.To improve tracking accuracy and smoothen wind power fluctuation,methods such as grouping EVs by the state of charge (SOC) to follow instructions have been proposed [8-9].However,the selected SOC boundaries significantly affected the results.Although helpful for tracking,these schemes overlook the SOC variability.Although some studies have reduced EV lifespan degradation [10-12],they reported limited impact and poor post-scheduling SOC balance.In summary,existing methods can track deviations but overlook crucial factors,such as EV lifespan degradation and the maintenance of SOC balance for future dispatchability.
A distributed two-stage scheduling strategy was proposed [10] to reduce the frequency of charging/discharging; however,the reduction in degradation was limited.Orderly charging/discharging by discrete segmentation [11] accounts for depth of discharge costs;however,it is a highly complex process.In [12] a reward/punishment mechanism guided the EV power adjustment;however,wind smoothing effects require improvement with issues such as deep charging/discharging.Although degradation is considered,these methods have limited reduction and poor post-scheduling SOC balance.Research shows that the SOC balance,after scheduling determines the future dispatchability potential,and maintaining the balance during operation improves the future capacity [13].Consequently,the findings of prior studies offer limited degradation mitigation and overlooks critical factors such as ensuring the SOC balance for dispatchability.
To effectively mitigate wind power fluctuations while minimizing EV degradation and enhancing SOC balance,this study proposes a dynamic grouping control strategy for EVs based on an improved k-means algorithm for wind power stabilization.The contributions of this study are as follows.First,a compression feedback-based SDT algorithm that extracts wind power features by adjusting the gating coefficient based on the compression ratio (CR)and compression deviation (CD) was developed.Linear interpolation was used to acquire the grid-connected power signals.Second,an improved damping optimization algorithm (IDOA) is proposed using Bernoulli’s chaotic map to improve the initial population diversity and dynamic probabilities to balance exploration and exploitation.The IDOA optimizes the k-means clustering centers to address dependence and sensitivity by developing an improved k-means algorithm called the IDOA-KM.Finally,a twolayer EV power distribution scheme was designed.The upper layer determines the charging/discharging sequence and power signals of the three EV groups.The lower layer allocates group power signals to each EV based on maximum power or SOC equalization principles.Case studies using 24-hour forecasted summer wind farm data demonstrate that the proposed strategy can effectively smooth fluctuations,reduce degradation,and enhance the SOC balance.
1 Overall flowchart
An overall flowchart of the proposed dynamic EV grouping control strategy is shown in Fig.1.

Fig.1 EV dynamic grouping control process
The key steps are:
1) Obtaining grid-connected wind power signals: A compression-feedback-based SDT algorithm was used to extract the wind power features by adjusting the coefficients based on the compression ratio and deviation.The feature points were compressed,and the signal was acquired by linear interpolation.
2) EV dynamic grouping and power allocation: The IDOA-KM algorithm is proposed to divide EVs into priority charging (PCG),reserve (RG),and priority discharging(PDG) groups.The upper layer determines the charging/discharging sequence of each group and the power signals.The lower layer allocates the power signals to individual EVs based on maximum power or SOC equalization principles.EVs follow their power signals to smooth fluctuations,reduce degradation,and maintain SOC balance.
2 Obtain the grid-connected power signal of wind power
2.1 Traditional swing door trending algorithm
The SDT algorithm was proposed by Bristol in 1990[14].This algorithm is typically used to compress data from real-time databases.Because the method is simple,has fast running speed,and strong signal tracking ability,it has been widely used for wind power ramp detection,wind power prediction,and other scenarios [15-16].The basic principles of this method are illustrated in Fig.2.

Fig.2 Principle diagram of SDT
Essentially,SDT compresses data while maintaining the trend and recording the locations of the compressed point.It uses the triangle or parallelogram rule [17] to filter and store data.In Fig.2,the SDT algorithm stores data by constructing a parallelogram: a parallelogram is constructed with a gated coefficientEthat the side length in the vertical direction is always maintained at 2 times.If the recorded data point is within the constructed parallelogram,the point is discarded,and only the points outside the quadrilateral are recorded,and the parallelogram is reconstructed with this point as the center of the vertical side length.
As shown in Fig.2,the data trend is o-a-b-c-d-e-f-g-h.Point o is recorded at all times.Eis the gate tolerance above and below Point o and is also called the gate width.Storage is determined by comparing the slopes of the expanding upper and lower gates.If the the inner angle of the two doors is less than 180°,that is,the slope of the upper gate is less than that of the lower gate,the compression continues.If their sum is no less than 180 °,that is,the slope of the upper gate is not less than that of the lower gate,the compression of that section ends,the previous point is stored,and a new section starts from that point.The steps of the SDT algorithm are as follows.
1) Initialize the slopes of the upper and lower gates:
wherek1andk2are the slopes of the upper and lower gates,respectively;PoandPaare the data values of Pointsoanda;t0andt1are the corresponding points;Eis the tolerance coefficient.
2) Calculate the slope between the current and previously stored points:
wherek1nandk2nare the slopes of the upper and lower gates between Pointnand previous storage pointo,respectively.PoandPnare the data values of Pointsoandn,andt0andtnare the corresponding points.
3) Update the slope values of the upper and lower gates:
4) Determine the required storage data:
Compare the sizes ofk1andk2to store the data.Ifk1≥k2,store the previous point as the new Point o.Ifk1<k2,continue the compression.
2.2 Compression feedback-based SDT algorithm
The ‘gate’ height is the core adjustable SDT parameter that has a significant impact on the performance.A larger gated coefficientEincreases the compression ratio (CR)but can also increase the compression deviation (CD).A smaller gated coefficientEreduces errors,but decreases the CR with redundant information [18].Therefore,this study proposes an SDT algorithm based on compression feedback that adjusts the gated coefficientEbased on CR and CD to improve smoothness while retaining comprehensiveness and reducing errors.This principle is illustrated in Fig.3.

Fig.3 compression feedback-based SDT algorithm
The CR and CD are used to adjust the gated coefficientE.Initially,the SDT algorithm compresses using the initial value of the gated coefficient,E0.The CR and CD of the segment are computed to determine whether they are within pre-set ranges.Then,the compressed data and locations are saved.Otherwise,the gated coefficientEis increased/decreased based on the rules until all data are processed.
The CR and CD are calculated as:
whereM1is the total number of samples;M2is the number of extracted samples; andPm,iandPn,iare the proportionally recovered and original values in theitime,respectively.
2.3 Acquiring wind power integration characteristic data
The forecasted wind power dataPware compressed using the compression feedback-based SDT algorithm in Section 2.2 to obtain the feature points.The grid-connected signalPw,ris derived by linear interpolation of these points.
3 Dynamic EV grouping for smoothing fluctuations in wind power
3.1 Improved Dingo Optimization Algorithm
The dingo optimization algorithm (DOA) is a new intelligent optimization algorithm proposed in 2021,inspired by the hunting behavior [19].Owing to its strong optimization ability and fast convergence,the DOA has been widely applied in areas such as microgrid scheduling,power system frequency regulation,and peak shaving[20].The DOA is based on three dingo-hunting strategies:group attack,execution,and scavenging,as well as on their survival rate [20].The basic steps in this algorithm are as follows:
1) Generate the initial population size
wheremis the number of iterations,(m) is the current optimization individual,lbiandubiare the lower and upper bounds ofandr1represents a uniformly generated random number between [0,1].
2) Three hunting strategies
① Group Attack: Predators often use highly intelligent hunting techniques.Dingoes usually hunt small prey such as rabbits individually,but when hunting large prey such as kangaroos,they gather in groups.Dingoes such as wolves can find the location of their prey and surround it.This behavior is represented by the following equation:
② Persecution.Dingoes usually hunt small prey individually; they are chased until they are caught.The following equation models this behavior:
whereβ2is a random number uniformly generated in the interval [-1,1],r2is the random number generated from the interval from 1 to the size of the maximum number of search agents (dingoes),and ⇀(m) represents the randomly selectedr2-th dingo population.
③Scavenger.Scavenger behavior is defined as the action of dingoes finding carrions to eat when they are randomly walking in their habitat.The following equation models this behavior:
whereσrepresents a randomly generated binary number,andσ∈{0,1}.
3) Determining the optimization strategy
The method for evaluating the three strategies for the DOA is as follows:
wherer3andr4are uniformly generated random numbers between [0,1],andPandQare the probability values for the Dingo population executing the corresponding strategy,with fixed values of 0.5 and 0.7,respectively.
4) Survival rate of dingoes
Australian dingo dogs are at risk of extinction mainly because of illegal hunting.The survival rate of dingoes in the DOA was calculated using the following equation:
wherec(i) is the survival rate of thei-th dingo located in the [0,1] interval,FmaxFminare the maximum and minimum values of the fitness function,respectively,andF(i) is the current value of the fitness function of thei-th dingo population.
Chaotic sequences are regular yet random,helping algorithms avoid local optima by improving the population diversity [21-22].Compared to pure randomization,fusing chaos improves the initial population diversity of the DOA.This study used a Bernoulli chaotic map [22] for initialization.
whereλ=0.5.
In the original DOA,PandQare fixed,potentially causing issues,such as slow convergence and weak early global search [23].To address this,the IDOA uses dynamicPandQto balance global exploration and local exploitation:
whereμis the iteration number andα1,α2,α3are set at -0.2,25,0.9,respectively,after multiple experiments.
In summary,the IDOA improves initial diversity through Bernoulli chaotic initialization and enhances the global search early on and local exploitation,later,through dynamicPandQ.
3.2 Improved k-means algorithm based on IDOA
K-means clustering uses Euclidean distance and randomly initializes the centers.The samples are assigned to the nearest cluster [24].This study improves it using the IDOA,with the optimal solution as the initial centers to resolve the dependence and sensitivity on the initial centers[25].The specific implementation step are as follows:
1) Design IDOA-KM fitness function:
The function is the sum of distances between the points and the corresponding centers:
wherenis the size of the dataset,kis the cluster number,ukis thek-th center,andsiis thei-th point.
2) Classify based on clustering centers:
Using the IDOA to determine thekoptimal clustering centers,the clustering division is determined by the nearest neighbor rule [26],and each data point is assigned to the nearest class according to the following equation:
3) IDOA-KM algorithm:
Step 1: Read and process data.
Step 2: Input parameters such asn,feature dimension(dim),cluster number (k),and the IDOA parameters.
Step 3: Initialize the dingo population using the Bernoulli’s chaotic map of sizek×dimto mapndingoes to the parallel-search optimal centers.Calculate the fitness values.
Step 4: Based on the designed dynamicsPandQ,determine the optimal strategy for a group attack,persecution,or scavenging.Update the optimal location.
Step 5: Calculate the survival rate based on strategy.If fitness is better,update the cluster centers.Repeat Step 4 until the termination condition is satisfied or the maximum number of iterations is reached.
Step 6: Obtain the optimal number of dingoes and the corresponding global optimal centers.
Step 7: Calculate the distance between each point and the center,assign to the nearest cluster,and complete the clustering.
3.3 IDOA-KM algorithm result analysis
IDOA-KM was compared with DOA-KM and the traditional k-means algorithm on three UCI datasets using the clustering accuracy and iterations as metrics [27].The datasets are listed in Table 1,and the results are listed in Table 2.

Table 1 UCI data set

Table 2 Comparison results of each algorithm
Table 2 shows IDOA-KM significantly improves accuracy and reduces the number of iterations compared to the other methods,demonstrating faster convergence and higher clustering precision.
4 Dynamic Grouping of EV Based on IDOAKM Algorithm
Based on the SOC theory,EVs with a lower SOC should charge first,while those with a higher SOC should discharge first,ensuring maximum power for the next period.However,the number and SOC distribution of the grid-connected EVs changes dynamically.Therefore,this study categorizes EVs into PCG,RG,and PDG groups using the IDOA-KM based on optimized SOC-based centers,enabling dynamic sorting from the lowest to the highest SOC.
4.1 Upper Layer Power Allocation for EV
The formula for the charging and discharging power (PEV)of EV to smoothen wind power fluctuations is
wherePEVis the charging and discharging instruction for the electric vehicle,with charging denoted by a positive sign,and discharging by a negative sign.Pw,randPware mentioned in Section 2.3.
Power distribution instructions are assigned and the action sequence of the three EV groups is determined based on their charging and discharging instructions.WhenPEV>0,the response sequence of the three EV groups is PCG→RG→PDG,until the charging power meets the current control instruction or reaches the maximum charging power of the EV; whenPEV<0,the response sequence of the three EV groups is PDG→RG→PCG,until the discharging power meets the current control instruction or reaches the maximum discharging power of the EV.If the maximum charging and discharging powers of each EV group are denoted byPmax,candPmax,drespectively,the method for upper layer power allocation can be summarized as shown in Table 3.

Table 3 Adjustment instructions assigned to the three EV groups
4.2 Lower Layer Power allocation for EV
After each EV group receives the corresponding power instruction,the next step is to allocate instructions to each EV.SOC balancing is a method for making full use of the integrated power and energy capacity of the distributed grid energy storage.Using EV to realize grid connections can better ensure stability of the power grid operation;however,in the process of grid connection,if the SOC of each EV fluctuates frequently,many EVs will discharge in advance or charge in advance and withdraw from the power grid dispatching,reduce the energy storage capacity of the regulating power grid,cause poor wind power stabilization effect,and an unstable power grid system [28].Therefore,based on the upper layer power allocation results and the power allocation principles adopted by each EV,the lower-layer power allocation was performed in this study.The principles of the lower-layer power allocation are as follows:
1) Maximum charging/discharging power:
EVs respond with their maximum power within operational constraints.
2) SOC equalization power allocation [29]:
EV charging/discharging functions are:
wherefchandfdisrepresent the charging and discharging functions of the EV battery,respectively; whileSEVi(t-1)denotes the SOC of thei-th EV at timet-1.
The SOC equalization allocation based on the functions is:
wherePEVi(t) represents the charging and discharging commands of thei-th EV at timestandPEV(t) represents the charging and discharging commands of the EV at timest.
5 Case study
5.1 Simulation parameters
A 100 MW wind farm in northern China was modeled,with 3000 callable EVs and number per period,as shown in Fig.4 [30].Each EV had a rated power of 7 kW,capacity of 35 kWh,efficiency of 90 %,and 0.9/0.1 SOC limit.Wind power data forecasted for 24 h of a summer day,at 1 min intervals,were used.

Fig.4 The number of electric vehicles in each time period
5.2 Grid-connected wind power signal results
The SDT algorithm,which operates based on compression result feedback,was utilized to compress the anticipated output power of wind energy on typical summer days,consequently deriving the commands for gridconnected wind power.The parameter ΔE in Fig.3 is set at 0.01.A comparison was made between the proposed SDT algorithm based on the compression result feedback and the traditional SDT algorithm,with the results displayed in Fig.5.It is evident that a critical drawback of the traditional SDT algorithm is its inability to preserve the original data entirely.By contrast,the compression result feedbackbased SDT algorithm not only enhances smoothness of the original wind power prediction,but also maintains the more comprehensive characteristics of the original wind power prediction with reduced error.

Fig.5 The grid-connected power signal of wind power using different algorithms
Table 4 presents the CD,CR,and average volatility for both algorithms.While traditional SDT volatility is lower,CD volatility is much higher,failing to retain its original characteristics.The proposed algorithm reduces errors while preserving the features.

Table 4 Comparison of CD,CR and average volatility under different algorithms
5.3 Analysis of EV operation results
5.3.1 Results of EV response to charging and discharging instructions
Fig.6 shows the EV tracking of the charging/discharging power signals,and Fig.7 shows the absolute deviations using the IDOA-KM,DOA-KM,and traditional k-means algorithms for grouping.EVs effectively follow the power signals under all methods,but the IDOA-KM demonstrates the most precise tracking with minimal deviations.
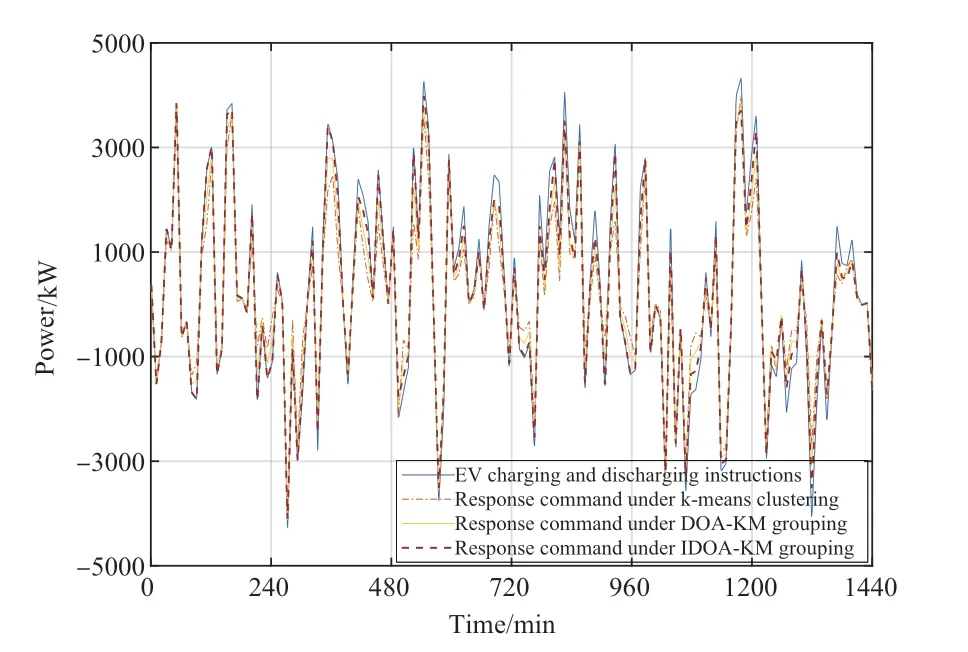
Fig.6 Comparison of the charging and discharging instructions of EV and the actual response results under different grouping methods
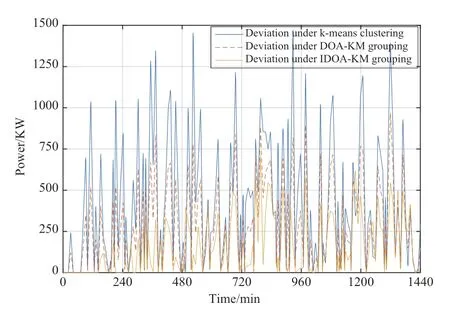
Fig.7 Absolute deviation of the tracking command at each instant
As illustrated in Figs.6 and 7,throughout the operational cycle,the EV can effectively adhere to their charge and discharge instructions using various grouping methods.However,the IDOA-KM algorithm demonstrates a more accurate response with minimal deviation.Table 5 presents the average tracking deviations of these methods.The traditional k-means algorithm had an average deviation of 415.91 kW.For DOA-KM it is 284.42 kW.The proposed IDOA-KM displayed the lowest deviation of 150.56 kW,indicating superior tracking accuracy.
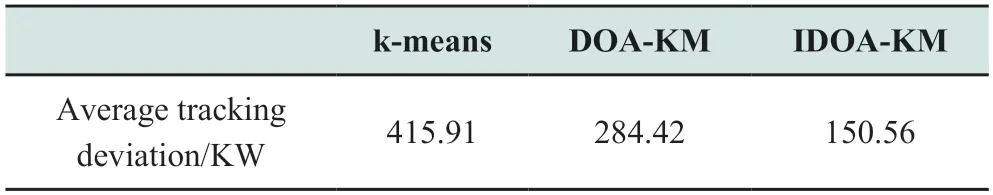
Table 5 The average tracking deviation under different grouping methods
5.3.2 Analysis of the loss of operating life of EV
Based on [31],EV lifecycle loss is:
whereQlossis the life loss;Tsrepresents the equivalent lifespan of EV based on this life loss;Rcdis the charging and discharging rate of EV; ΔSis the change in SOC;Gis the gas constant with a value of 8.314 J/(mol·K);Temis the battery temperature of EV during normal driving,which is 298 K;CEVis the capacity of EV,which is 35 kWh;B1,B2andB3are constants depending on the type of battery used in EVs,where lithium batteries are commonly used and their values are 27128,31700,and 370.3 respectively;α4is the capacity loss coefficient of an electric vehicle battery,and its value is assumed to be 0.2.
To verify the effectiveness of the proposed duallayer power allocation strategy,Equation (18) was used to calculate the life loss and service life for the strategy adopted for this study and the other five strategies.According to Strategy 1,the EV charging and discharging power instructions are equally distributed to each electric vehicle; Strategy 2 is based on the power allocation method of SOC balance; According to Strategy 3,EV are divided into two groups with the same capacity and PCG and PDG,and the EV with smaller SOC are assigned to the PCG and the ones with larger SOC to the PDG; the average power allocation method is applied to each EV group; Strategy 4 adopts the same grouping method as Strategy 3,but uses the power allocation method of SOC balance for each EV group; In Strategy 5 EV are divided into three groups,PCG,RG,and PDG,with the same capacity; EV with smaller SOC are assigned to the PCG,and ones with larger SOC to the PDG,and the remaining EV to the RG; the average power allocation method is applied to each EV group.
Table 6 lists the lifecycle loss and service life of the EV under different strategies.It can be observed that the duallayer power allocation strategy based on dynamic grouping used in this study ensures the lowest lifecycle loss for EV compared to the other five strategies and improves the service life of EV.

Table 6 Comparison of the lifetime loss and service life of EV under different strategies
5.3.3 Analysis of EV Scheduling Potential
The SOC balance of EV determines their dispatchability potential after participating in scheduling.Maintaining a good SOC balance of the EV during operation is beneficial for improving dispatchability in the future [13].The standard deviation of the SOC of each group before and after the EV response was used to demonstrate the SOC balance,and the results are shown in Fig.8.As shown in Fig.8,the standard deviation of the SOC for each group after the response is smaller than that before the response at each moment,which proves that the strategy improves the SOC balance of the EVs and further indicates that it also improves the potential for EV dispatchability.

Fig.8 Standard deviation of SOC for each group before and after EV response at each moment
Table 7 presents the maximum and mean standard deviations of the SOC before and after the response.The maximum deviation decreases from 0.1997 to 0.1941,whereas the mean decreases from 0.0612 to 0.0560.This indicates enhanced EV SOC balance and dispatchability.

Table 7 Maximum and mean SOC standard deviations before and after EV response
5.4 Analysis of wind power grid volatility
To demonstrate the effectiveness of smoothing out of wind power fluctuations by EVs more directly,the fluctuation rate indicator was used,with the formula for calculation is as follows:
whereBt,iis the volatility of thei-th scheduling interval;Pgrid(t) is the wind power integration; and ΔTis 10,which is equivalent to a scheduling interval of 10 min.
The fluctuation rate of the EV grid-connection power on a typical summer day is shown in Fig.9.It can be seen that under the control strategy proposed in this study,the fluctuation rate of grid connection power of EVs after smoothing wind power fluctuations is greatly reduced,with the grid fluctuation rate always maintained within 15.00%,and the average value is reduced from 9.21% to 6.19% after calculation.

Fig.9 Volatility of grid-Connected Power
Table 8 further compares the maximum and average rates under different methods across typical seasonal days.The grid-connected signals derived using the proposed compression feedback-based optimized SDT produce the lowest maximum and average rates.This further proves that the method can smoothen wind power fluctuations.

Table 8 Volatility of grid-connected power on typical days in four seasons using different methods
6 Conclusion
1) A compression feedback-based SDT algorithm is proposed to effectively acquire grid-connected wind power signals,controlling compression errors to within 2.972 and the ratio to within 0.2,and reducing errors compared with traditional SDT.
2) The IDOA-KM algorithm is designed and is verified as having high clustering precision and speed compared to other methods,using UCI datasets.
3) A control strategy based on the IDOA-KM for dynamic EV grouping was developed.Compared to other strategies,it reduces lifespan degradation from 4.7 years to 9.6 years.It also responds better to EV charging and discharging power signals and has the lowest tracking deviation compared with the other three methods,with a minimum tracking deviation of 105.56 KW.
4) The SOC equalization power-allocation principle was used to improve the SOC balancing level.The standard deviation of the SOC for each group of EVs decreased from 0.0612 to 0.056,thereby improving the dispatch potential of the EV.
5) The proposed power allocation strategy can better suppress wind power fluctuations using EVs.The results show that,compared with other methods,it can maintain a grid fluctuation rate below 15%,with the lowest average grid fluctuation rate.
The grid number of electric vehicles proposed in this paper is based on the existing data,and the follow-up work can try to add the participation of owners and users and the travel chain of electric vehicles.
Acknowledgements
This study was supported by the National Key Research and Development Program of China (No.2018YFE0122200),National Natural Science Foundation of China (No.52077078),and Fundamental Research Funds for the Central Universities(No.2020MS090).
Declaration of Competing Interest
We declare that we have no conflict of interest.
杂志排行

Global Energy Interconnection的其它文章
- Missing interpolation model for wind power data based on the improved CEEMDAN method and generative adversarial interpolation network
- A Special Issue: “Forecasting of Clean Energy and Controlling of Smart Grid for Sustainable Energy” for Global Energy Interconnection
- Wind-speed forecasting model based on DBN-Elman combined with improved PSO-HHT
- A fuzzy control and neural network based rotor speed controller for maximum power point tracking in permanent magnet synchronous wind power generation system
- State-of-the-art review of MPPT techniques for hybrid PV-TEG systems: modeling,methodologies,and perspectives
- An adaptive control strategy for microgrid secondary frequency based on parameter identification