High spindle and kinetochore-associated complex subunit-3 expression predicts poor prognosis and correlates with adverse immune infiltration in hepatocellular carcinoma
2023-10-21LinLinZhengYaRuWangZhenRongLiuZhiHaoWangChangChengTaoYongGangXiaoKaiZhangAnKeWuHaiYangLiJianXiongWuTingXiaoWeiQiRong
Lin-Lin Zheng, Ya-Ru Wang, Zhen-Rong Liu, Zhi-Hao Wang, Chang-Cheng Tao, Yong-Gang Xiao, Kai Zhang,An-Ke Wu, Hai-Yang Li, Jian-Xiong Wu, Ting Xiao, Wei-Qi Rong
Abstract
Key Words: Spindle and kinetochore-associated protein 3; Hepatocellular carcinoma; Prognosis; Immune infiltration cells
INTRODUCTION
Primary liver cancer (PLC) is the sixth most common cancer and the third leading cause of cancer-related death worldwide. In China, PLC is the fifth most common cancer and the second leading cause of cancer death[1]. Hepatocellular carcinoma (HCC) is the most common pathological type, accounting for almost 90% of PLC[2]. A growing body of evidence has linked chronic hepatitis virus infection (hepatitis B virus, hepatitis C virus), alcoholic hepatitis, aflatoxin exposure and metabolic syndrome to an increased risk of HCC occurrence[3-5]. Due to the nonspecific early symptoms of HCC, more than half of HCC patients are diagnosed in the middle or advanced stages, thus the five-year survival rate of HCC patients is approximately 5%-30%[6]. In recent years, several serum biomarkers have been proposed for HCC screening and early diagnosis, including alpha fetoprotein (AFP), des-gamma-carboxy prothrombin, and glypican-3.Nevertheless, the sensitivity and specificity remain unsatisfactory[7]. Thus, an exploration of the new prognostic biomarkers for the early prediction and prognosis evaluation of prognosis in HCC is urgently needed.
The spindle and kinetochore-associated (SKA) complex, composed of the SKA complex subunit 1, SKA complex subunit 2, and SKA complex subunit 3 (SKA3) proteins, plays a significant role in kinetochore-microtubule attachment and chromosome movement, ensuring correct chromosome segregation and normal progression in mitosis[8]. SKA3 is an essential component of the SKA complex, located on chromosome 13q12.11, which functions to stabilize the kinetochoremicrotubule interaction in mitosis[9]. SKA3 phosphorylated by cyclin-dependent kinase (CDK) 1 binds to NDC80 and recruits the SKA complex to the centromere, which promotes the mitotic process and thereby regulates cell proliferation and apoptosis[10,11]. Growing evidence supports that the overexpression of SKA3 is implicated in the occurrence and development of various malignant tumors, including laryngeal cancer[12], cervical cancer[13], colorectal cancer[14],breast cancer[15], and lung adenocarcinoma[16]. Previous studies reported that overexpressed SKA3 interacts with pololike kinase 1, activates the protein kinase B (AKT) signaling pathway, and selectively upregulates the expression of the glycolytic enzymes hexokinase 2, 6-phosphofructo-2-kinase/fructose-2,6-bisphosphatase 3 and pyruvate dehydrogenase kinase 1 to promote glycolysis in laryngeal cancer cells, thereby promoting malignant proliferation. Moreover, SKA3 overexpression could promote the proliferation and metastasis of cervical cancer and lung adenocarcinoma through the phosphatidylinositiol 3-kinase/AKT pathway[13,16]. In addition, overexpression of SKA3 has been associated with tumor progression and poor prognosis in patients with colorectal cancer[14] and breast cancer[15]. The above findings demonstrate that SKA3 plays a crucial role in promoting the proliferation and migration of tumors. However, the mechanism of SKA3 in HCC has not been fully elucidated.
This study aimed to investigate the relationship between SKA3 expression and clinicopathological features, enrichment analysis, immune infiltration, immune checkpoints, and drug sensitivity in HCC, which may contribute to our understanding of the molecular mechanisms of SKA3 in HCC.
MATERIALS AND METHODS
Pathological sample collection
Thirteen pairs of HCC tissues and corresponding normal tissues were collected from patients undergoing surgery at the Peking Union Medical College Hospital of the Chinese Academy of Medical Sciences from October 2019 to December 2019 and were used for Western blot (WB) analysis. This study was approved by the Ethics Committee of the Peking Union Medical College Hospital. Fifty-six paraffin-embedded HCC tissue samples were used for immunohistochemical staining, which was provided by the hospital. The samples were collected from December 2008 to October 2012. This study was performed in accordance with the principles of the Declaration of Helsinki.
Bioinformatics analysis by public databases
The Tumor Immune Estimation Resource (TIMER) (https://cistrome.shinyapps.io/timer/) is a public database containing 10897 samples across 32 cancer types from The Cancer Genome Atlas (TCGA) database[17]. A pancancer study of SKA3 expression was performed using the TIMER database. The TCGA (https://cancergenome.nih.gov/) is a largescale Cancer Genome Project database that provides clinical and pathological information on 33 cancers[18]. Gene expression data and corresponding clinical information of 424 samples, namely, 374 tumors and 50 normal samples were collected from TCGA database. The HCC patients were divided into high- and low-expression groups according to the median SKA3 Level. Clinical characteristics of the HCC patients were summarized in Table 1. The Gene Expression Omnibus (GEO) database (http://www.ncbi.nlm.nih.gov/geo) contains high-throughput gene expression data from research institutions worldwide[19]. Gene expression profiles of the GSE62232 and GSE121248 datasets were downloaded from the GEO database. The TIMER, TCGA and GEO databases are publicly available and did not require the ethics committee’s approval.
WB
The total protein from the HCC tissues was extracted with radioimmunoprecipitation assay lysis buffer, and the protein was quantitated with a bicinchoninic acid protein assay kit. Then, the protein was separated by 10% SDS-polyacrylamide gel electrophoresis and transferred to a polyvinylidene difluoride (PVDF) membrane. The PVDF membranes were incubated in 5% nonfat milk powder diluted in Tris-buffered saline Tween (TBST) at room temperature for 2 h. After washing three times with TBST, the membranes were incubated with SKA3 antibodies (1:1000 dilution) overnight at 4 °C.The next day, the membranes were washed three times with TBST and incubated with the secondary antibody diluted in blocking solution for 1-2 h at room temperature. The membranes were washed three times with TBST. An appropriate volume of developer solution was evenly applied to the PVDF membrane, which was developed with a fluorescence imaging system.
Immunohistochemistry
We performed immunohistochemistry staining on 56 paraffin-embedded HCC tissues, and SKA3 antibody was purchased from Thermo Fisher (PA5-58722). The samples were mixed with SKA3 primary antibodies, incubated overnight at 4 °C, deparaffinized, hydrated, and blocked. The immunohistochemistry (IHC) staining results were analyzed and scored by two pathologists who were blinded to the sample origins. The staining intensity (0, no staining;1+, weak staining; 2+, moderate staining; 3+, strong staining) and percentage of positive cells (0: < 5%; 1: 5%-25%, 2: 26%-50%; 3: 51%-75%; 4: > 75%) were evaluated using a semiquantitative scoring system. The staining intensity and positive cells were rated as follows: 0 was negative (-), 1-4 was weakly positive (+), 5-8 was moderately positive (++), and 9-12 was strongly positive (+++).
Construction of the nomogram
A nomogram is a reliable statistical predictive tool that estimates individualized risk[20]. Based on the SKA3 expression and clinicopathological features, we constructed a prognostic model to predict the overall survival (OS) of HCC patients.Model performance was quantified by discrimination and calibration[21]. The discriminative ability of the nomogram was assessed by the C-index, which ranged from 0.5 (no discrimination) to 1 (perfect discrimination). The calibrationcurve was used to compare the actual risk and predicted risk. A value ofP< 0.05 was considered statistically significant.
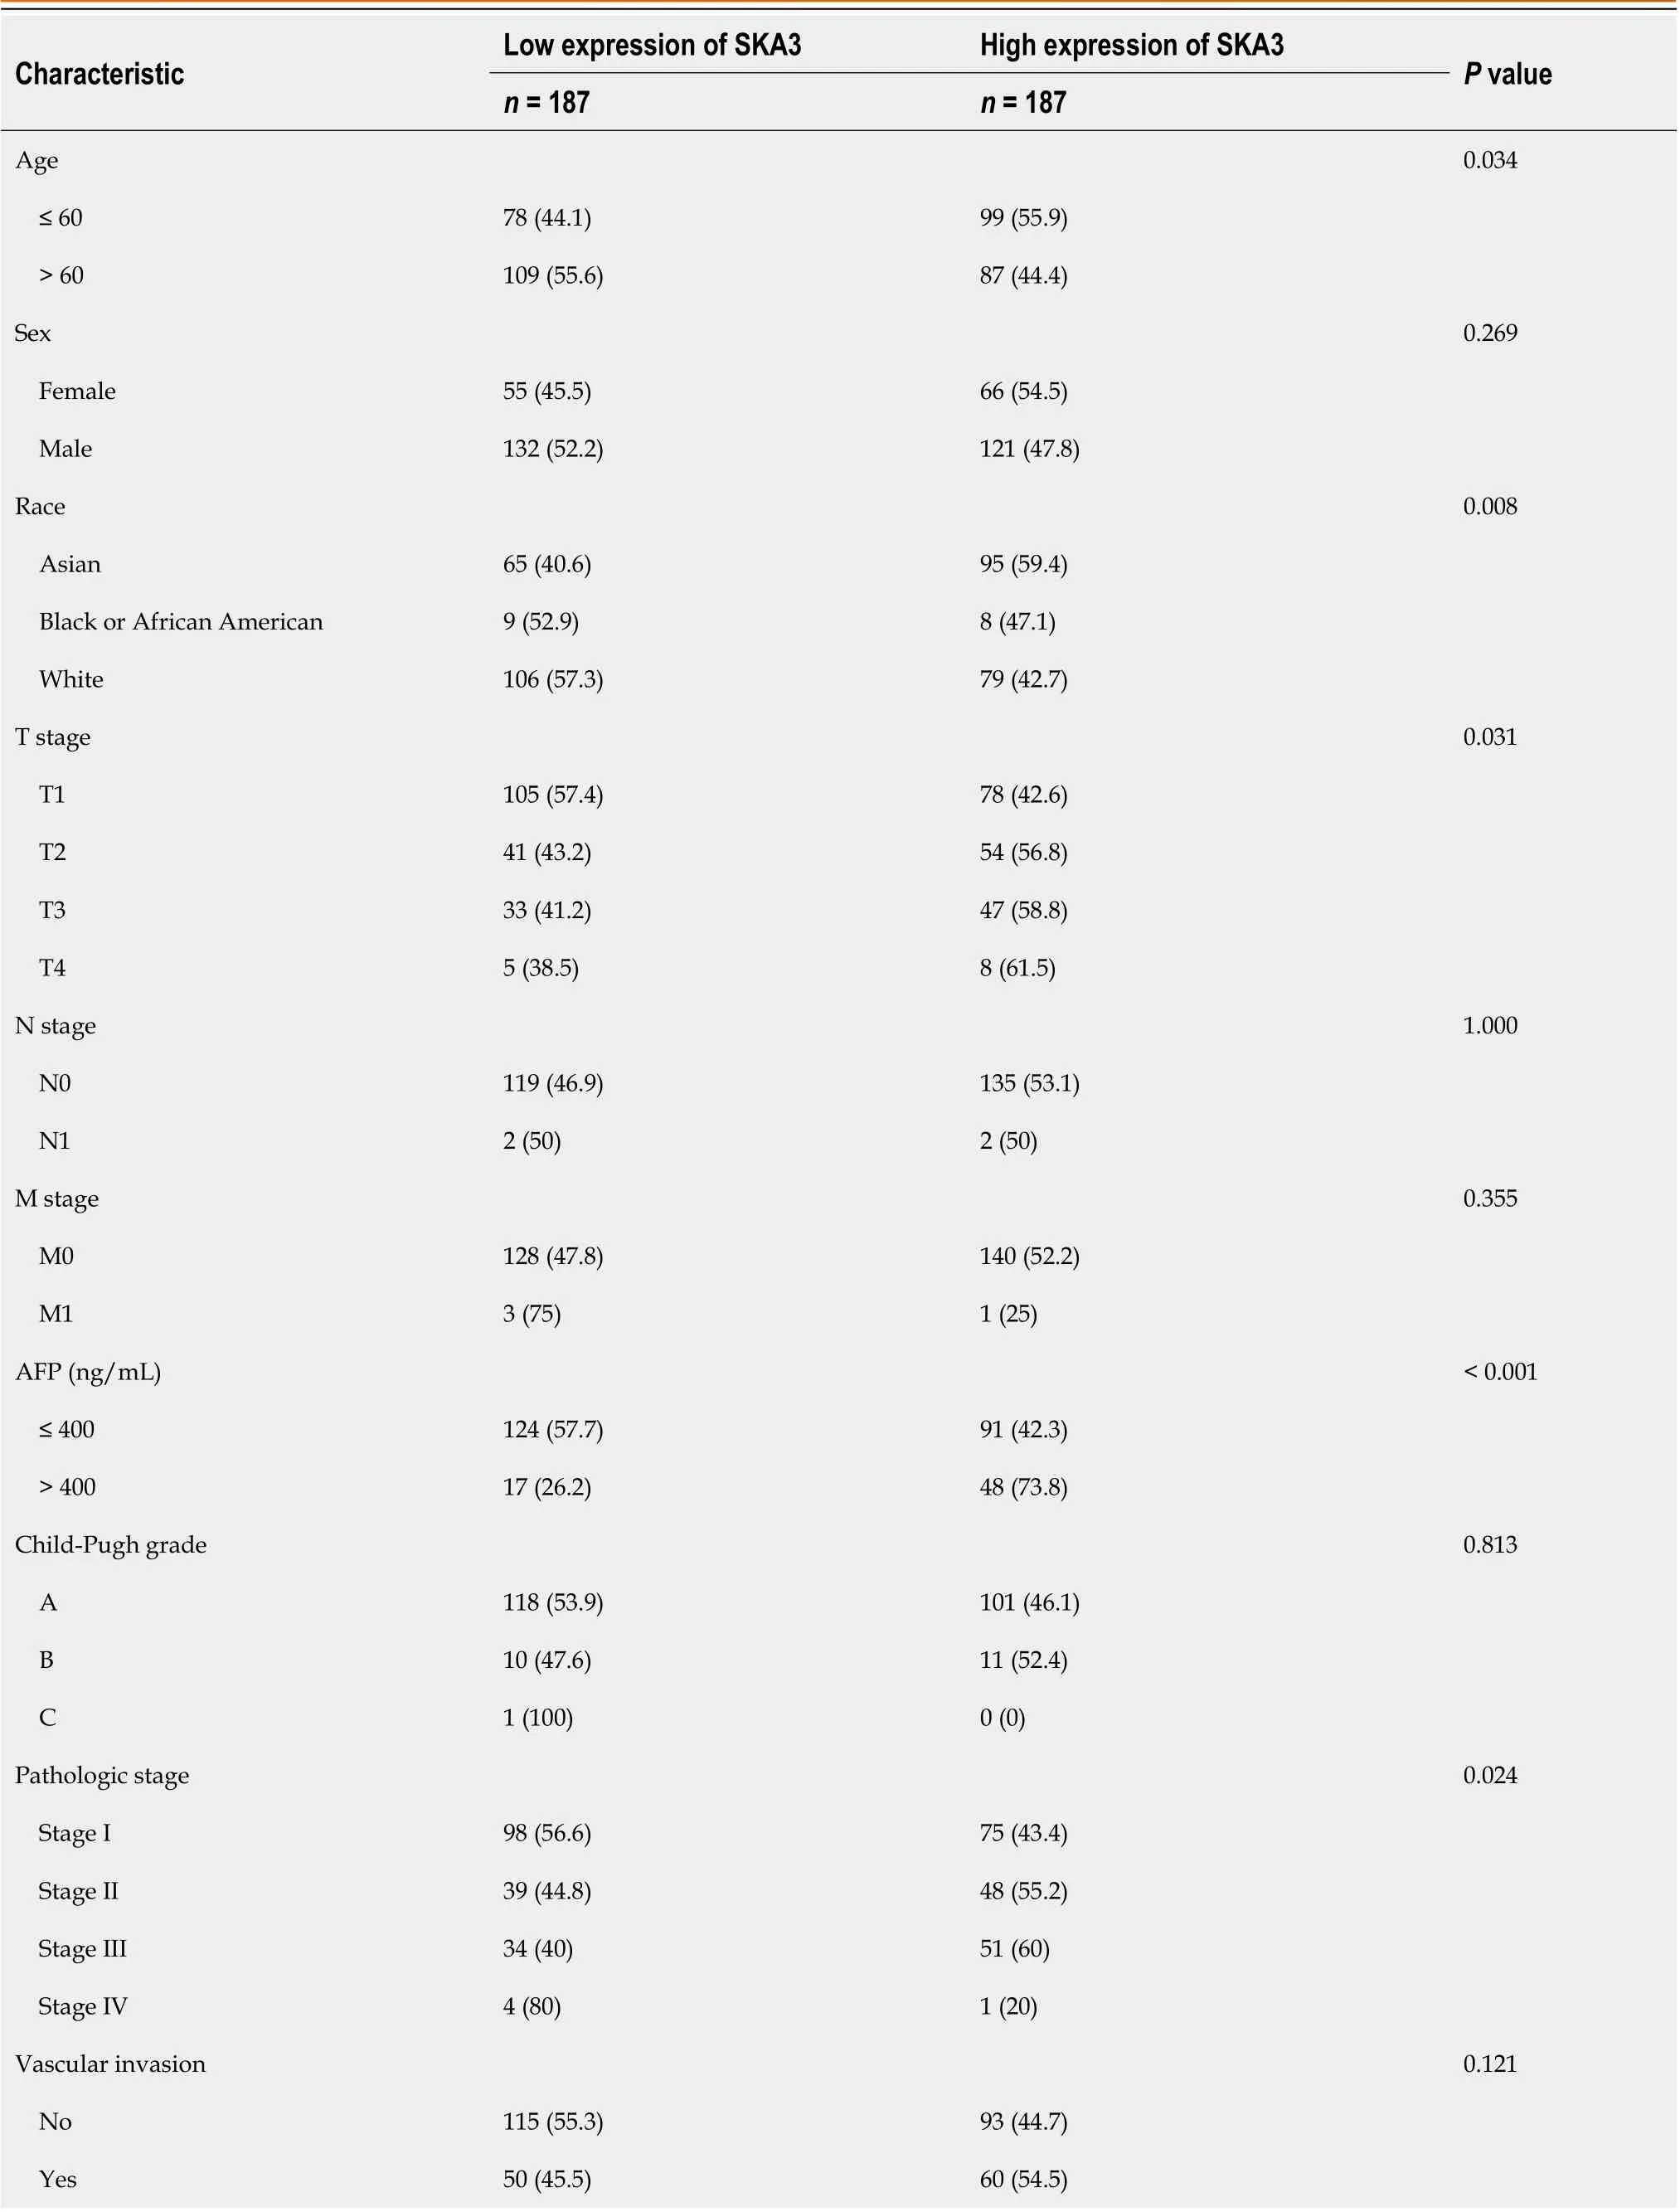
Table 1 Clinical characteristics of hepatocellular carcinoma patients in The Cancer Genome Atlas database, n (%)
Enrichment analysis
Gene Set Enrichment Analysis (GSEA) is a computational method for determining whether a predefined set of genes is statistically significant in two biological states[22]. GSEA was performed to identify signaling pathways involved in SKA3-mediated effects by using the R package ClusterProfiler[23]. The reference gene set in this study was c2.cp.v7.2.symbols.gmt. The normalized enrichment score was calculated for each gene set. A false discovery rate < 0.25 and adjustedPvalue < 0.05 were used to identify positive significantly enriched pathways[24,25].
Immune cell infiltration and immune checkpoint analysis
To evaluate the potential relationships between SKA3 expression and tumor-infiltrating immune cells (TIICs) in the microenvironment, the TCGA database was used to quantify the level of immune cell infiltrationviathe TIMER database and single-sample GSEA (ssGSEA) algorithm[26]. Subsequently, a heatmap showed the correlation of 24 types of immune cells. Additionally, we explored the correlation between SKA3 expression and immune checkpoints [programmed cell death protein 1 (PDCD-1), cytotoxic T lymphocyte antigen 4 (CTLA-4)] with Spearman’s correlation test. A value ofP<0.05 was considered statistically significant.
Drug sensitivity analysis
The Genomics of Drug Sensitivity in Cancer (GDSC) (https://www.cancerrxgene.org/) is the largest publicly available pharmacogenomics database[27,28], and we predicted each sample’s chemotherapeutic response to sorafenib, sunitinib,paclitaxel, doxorubicin, VX-680, and gemcitabine by the R package "pRRophetic". Ridge regression was used to calculate the half-maximal inhibitory concentration (IC50). A value ofP< 0.05 was considered statistically significant.
Statistical analysis
Statistical analysis was performed with R (http://www.Rproject.org). The expression of SKA3 in HCC tissues and normal tissues was assessed by the Wilcoxon rank-sum test and Wilcoxon signed-rank test. Kruskal-Wallis and Wilcoxon rank-sum tests were used to evaluate the relationship between SKA3 expression and clinicopathological features.Receiver operating characteristic (ROC) analysis was performed to assess the diagnostic value of SKA3 in HCC using the pROC package. The link between SKA3 expression and prognosis was investigated using Kaplan-Meier survival analysis.In all tests, a value ofP< 0.05 was considered statistically significant.
RESULTS
High expression of SKA3 in HCC
We found that SKA3 expression was significantly increased in various malignant tumors, including liver hepatocellular carcinoma, cervical cancer, and colorectal cancer (Figure 1A). TCGA, GSE62232, and GSE121248 revealed that SKA3 expression was increased in HCC tumor tissues compared to that in matched normal tissues (Figure 1B-E). In addition,the WB results were consistent with the above results (Figure 1F and G). We also obtained RNA-sequencing data and clinical prognostic information resources of 374 HCC patients from the TCGA database (Table 1). The relationship between SKA3 expression and clinicopathological features was explored, and the results showed that SKA3 expression was significantly correlated with the pathological stage (Stage I and Stage III,P< 0.01, Figure 2A), T stage (T1 and T2,P<0.05; T1 and T3,P< 0.01; Figure 2B), AFP level (P< 0.001, Figure 2C) and vascular invasion (P< 0.05, Figure 2D). The area under the curves of SKA3 expression and the AFP level were 0.973 and 0.720, respectively, suggesting that SKA3 expression had a strong diagnostic ability for HCC (Figure 2E and F). In conclusion, SKA3 expression, mRNA expression and protein expression were significantly higher in HCC tissues.
High SKA3 expression indicated a poor survival outcome in HCC
Kaplan-Meier survival analysis was performed to investigate the relationship between SKA3 expression and prognosis,and the results revealed that patients with high SKA3 expression had a poor OS and progression-free interval (P= 0.004,Figure 3A;P= 0.001, Figure 3B). Furthermore, we included the TNM stage, pathological status, vascular invasion, and AFP levels in the subgroup Kaplan-Meier analysis. The subgroup analysis indicated that the high SKA3 expression group had poorer OS in the T stage (T1 and T2 and T3,P= 0.009, Figure 3C), N stage (N0,P< 0.001, Figure 3D) and M stage(M0,P< 0.001, Figure 3E). The above results showed that the expression level of SKA3 could be used to predict the prognosis of HCC patients with different TNM stages. To further verify the relationship between SKA3 expression and the prognosis of HCC patients, we performed IHC staining on 56 paraffin-embedded HCC tissues and found that high SKA3 expression was associated with poor OS (P= 0.246, Figure 3F). In summary, SKA3 overexpression indicated a poor prognosis for HCC.
Construction of the nomogram
We performed univariable and multivariable Cox regression analyses to evaluate the relationship between SKA3 expression, clinicopathological features, and OS. Univariate Cox regression revealed that the pathological status (Stage III and Stage IV,P< 0.001), T stage (T3 and T4,P< 0.001), M stage (M1,P= 0.017) and high SKA3 expression (P= 0.004)were risk factors (Figure 4A) (allP< 0.05). Multivariate Cox analysis further confirmed that high SKA3 expression could serve as an independent risk factor (P= 0.003, Figure 4B). To provide clinicians with a quantitative method for predicting the prognosis of patients, a nomogram based on SKA3 expression and clinicopathological features was constructed(Figure 4C). Each patient was assigned a total score from the nomogram, and patients with higher scores had a poor prognosis. The C-index and calibration plot were constructed to estimate the accuracy of the prognostic model. The results showed that the C-index was 0.661, and the calibration curve had good agreement between the actual and predicted probability (Figure 4D). The nomogram was a reliable prognostic tool for predicting OS in HCC patients.
GSEA identifies SKA3-related signaling pathways
GSEA was performed to identify the biological signaling pathways associated with SKA3 expression in HCC. Functional enrichment analysis indicated that DNA repair and the cell cycle checkpoints, mitotic G1 phase and G1-S transition, S phase, G2-M checkpoints, M phase, mitotic spindle checkpoint, regulation of tumor protein 53 (TP53) activity, and cell cycle were enriched in the high SKA3 expression group (Figure 5) (allP.adj < 0.05). In addition, we analyzed the correlation between SKA3 expression and cell cycle-related molecules and found that SKA3 expression was positively correlated with the expression of CDK1, CDK2, CDK4, cell division cycle 6 (CDC6), cell division cycle 20 (CDC20), cell division cycle 25A (CDC25A), E2F transcription factor 1 (E2F1), cyclin A2 (CCNA2), and cyclin E2 (CCNE2) (Figure 6) (allP< 0.001). SKA3 may promote HCC cell proliferation by regulating the cell cycle. In summary, the above findings revealed that SKA3 expression may be closely involved in proliferation-related processesviathe cell cycle, DNA repair,and the TP53 pathway.
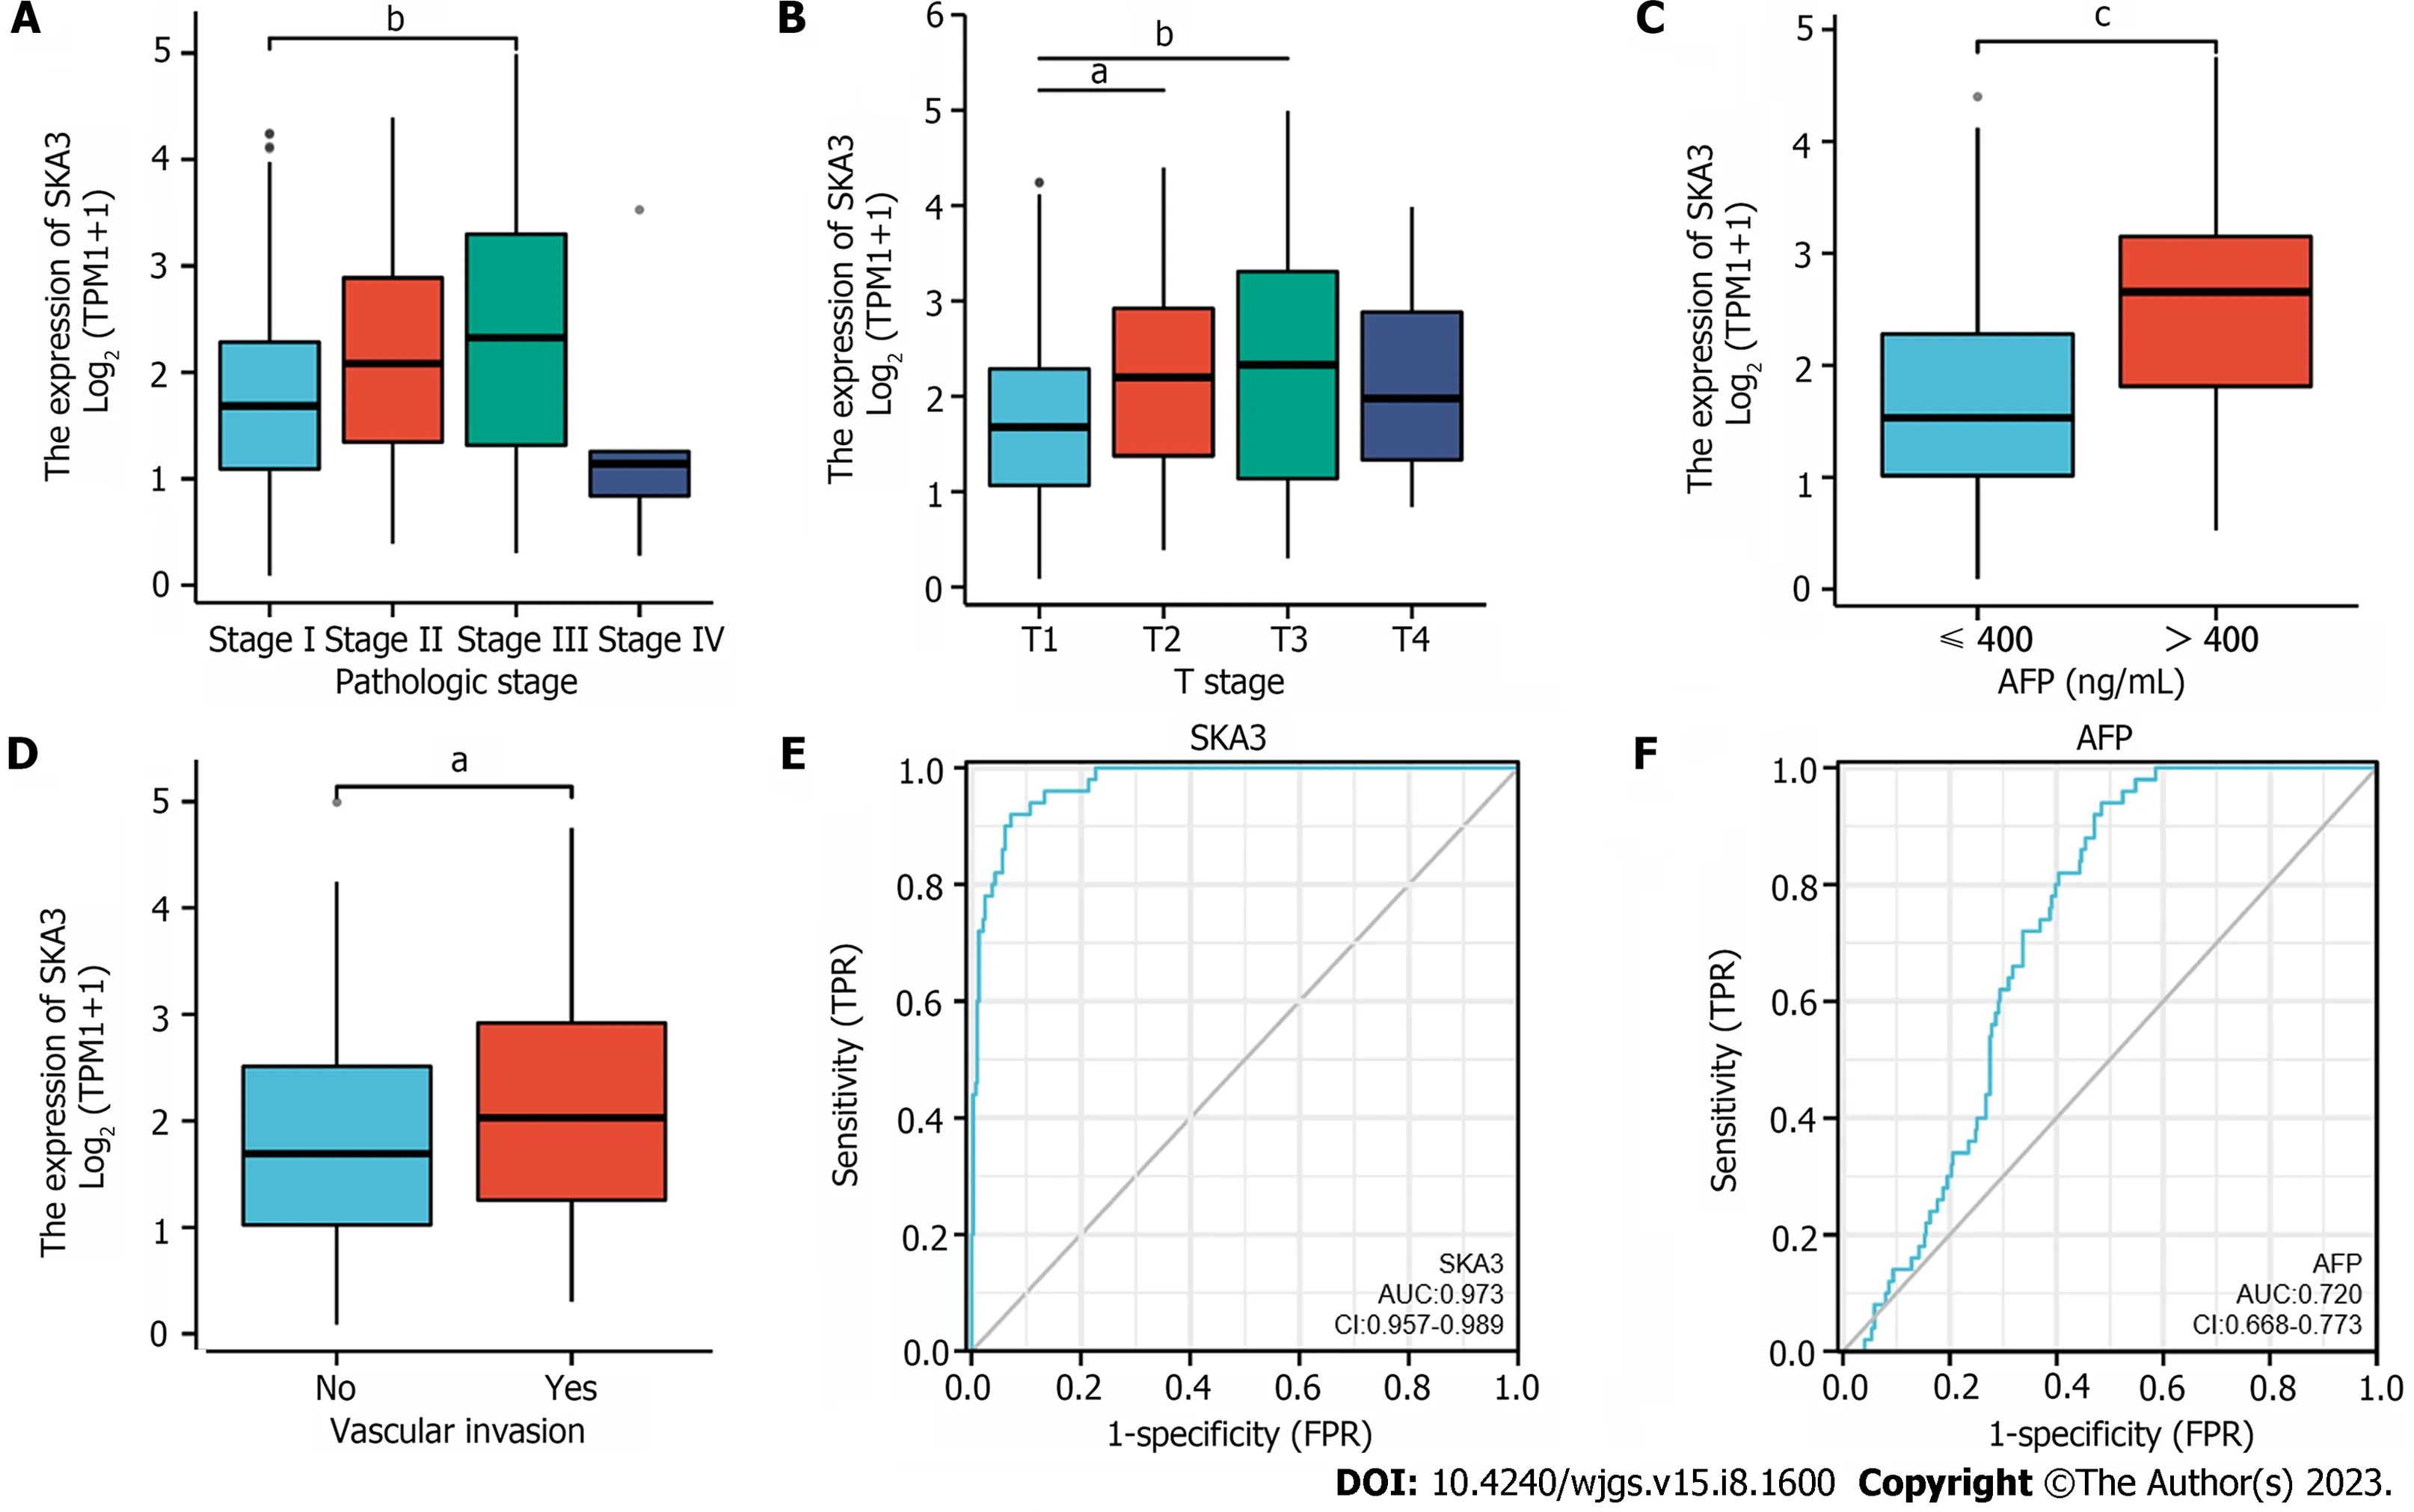
Figure 2 Relationship between spindle and kinetochore-associated complex subunit 3 expression and clinicopathological features. A:Pathologic stage; B: T stage; C: Alpha fetoprotein (AFP) level; D: Vascular invasion; E and F: Receiver operating characteristic curve of spindle and kinetochoreassociated complex subunit 3 expression (E) and AFP level (F) in hepatocellular carcinoma. SKA3: Spindle and kinetochore-associated complex subunit 3; AFP:Alpha fetoprotein; AUC: Area under the curves. aP < 0.05, bP < 0.01, cP < 0.001.
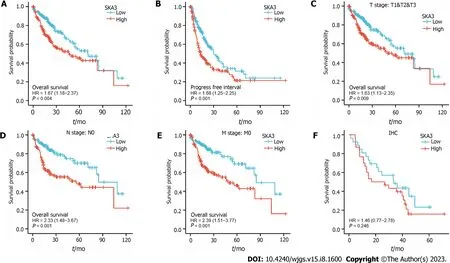
Figure 3 Kaplan Meier survival curves of hepatocellular carcinoma patients in the spindle and kinetochore-associated complex subunit 3 high- and low-expression groups. A: Overall survival (OS); B: Progression-free interval; C-E: OS for subgroup analysis based on T stage (C), N stage (D), and M stage (E); F: Immunohistochemistry staining results showing that high spindle and kinetochore-associated complex subunit 3 expression was associated with poor prognosis in hepatocellular carcinoma patients. SKA3: Spindle and kinetochore-associated complex subunit 3; HR: Hazard ratio; IHC: Immunohistochemistry.

Figure 4 Construction of the nomogram. A and B: Forest plot revealing the univariate and multivariate Cox analyses of overall survival (OS)-related variables;C: The nomogram incorporating the pathological stage, T stage, M stage and spindle and kinetochore-associated complex subunit 3 expression was identified as a predictor of the 3-, and 5-yr OS probabilities of hepatocellular carcinoma patients; D: Calibration curves of 3-, and 5-yr of OS. SKA3: Spindle and kinetochoreassociated complex subunit 3; AFP: Alpha fetoprotein.
SKA3 expression was involved in immune infiltration in HCC
The TIMER database showed that SKA3 was significantly related to the infiltration levels of B cells, CD8+ T cells, CD4+ T cells, macrophages, neutrophils, and dendritic cells (Figure 7A) (allP< 0.05). Furthermore, we used the ssGSEA algorithm to quantify the level of immune cell infiltration in the high- and low-expression groups of SKA3, and the results demonstrated that the CD8+ T cells, natural killer (NK) cells, and DCs had lower infiltration levels in the high SKA3 expression group (Figure 7B). A heatmap was applied to evaluate the relationship between 24 immune cells, which revealed that the ratios of different TIIC subpopulations were moderately to strongly correlated (Figure 7C). In addition,we also analyzed the correlation between SKA3 expression and immune checkpoints and found that SKA3 expression was positively correlated with PDCD-1 and CTLA-4 (Figure 7D). Our results indicated that the high SKA3 expression group had lower antitumor immune cells.
Relationship between SKA3 expression and drug sensitivity
According to the predicted IC50 values, there was a statistically significant difference in the response to anticancer drugs between the high- and low-SKA3 groups. Patients in the high SKA3 group were more sensitive to sorafenib, sunitinib,paclitaxel, doxorubicin, gemcitabine, and vx-680 (Figure 8).
DISCUSSION
Given the high morbidity and mortality of HCC, a large proportion of patients with HCC are diagnosed at an advanced stage with poor clinical outcomes, mainly due to tumor metastasis and tumor recurrence[29]. Therefore, identifying genes that are dysregulated during tumor growth may potentially help improve prognosis and therapy options.

Figure 5 Analysis of spindle and kinetochore-associated complex subunit 3-related biological pathways by Gene Set Enrichment Analysis. A: DNA repair; B: Cell cycle checkpoints; C: Mitotic G1 phase and G1-S transition; D: S phase; E: G2-M checkpoints; F: M phase; G: Mitotic spindle checkpoint; H: Regulation of TP53 activity; I: Cell cycle. SKA3: Spindle and kinetochore-associated complex subunit 3; GSEA: Gene Set Enrichment Analysis.
SKA3 encodes a component of the SKA complex that regulates microtubule attachment to kinetochores during mitosis.The encoded protein localizes to the outer kinetochore and is required for normal chromosome segregation and cell division[30]. SKA3 drives cell cycle progression and is frequently overexpressed in various tumors, which is closely associated with tumorigenesis and development. However, the mechanism of SKA3 expression in HCC has not been elucidated in detail. In this study, we identified that SKA3 expression was significantly upregulated and associated with poor prognosis in patients with HCC in public databases and those with collected clinical samples. Multivariate analysis showed that high SKA3 expression could be an independent risk factor for poor prognosis in HCC patients. In addition, a nomogram was constructed based on clinicopathological features and SKA3 expression to predict the prognosis in patients with HCC. The above findings suggested that upregulated SKA3 was substantially correlated with poor prognosis in patients with HCC.
The most basic biological feature of malignant tumors is the uncontrolled proliferation of tumor cells, and dysregulation of the cell cycle is a hallmark feature of uncontrolled cell proliferation[31]. Studies have demonstrated that the transition from the G1 phase to the actively cycling S/G2/M phases is controlled by sequential activation of cyclin-CDK complexes. Cell cycle progression from the G1 to S phase is guided by CDK4, CDK6, and CDK2, followed by the phosphorylation and inactivation of pRB and release of E2F transcription factors[32,33]. Houet al[34] found that the overexpression of SKA3 could alleviate apoptosis and promote proliferation of HCC cells, which may be related to inhibiting the phosphorylation of p53 by interaction with CDK2[34]. The p53 gene is a tumor suppressor gene that plays an important role in regulating the cell cycle, DNA damage repair and immunity[35]. Mutant p53 can act as a transcription factor to regulate the expression of downstream target genes, leading to tumorigenesis. Our research found that the high SKA3 expression group was significantly enriched in DNA repair and the cell cycle checkpoints, mitotic G1 phase and G1-S transition, S phase, G2-M checkpoints, M phase, mitotic spindle checkpoint, regulation of TP53 activity,and cell cycle. Furthermore, SKA3 was positively correlated with the expression of CDK1, CDK2, CDK4, CDC6, CDC20,CDC25A, E2F1, CCNE2 and CCNA2 (allP< 0.05). SKA3 expression promoted HCC proliferation, which may be related to the uncontrolled cell cycle, constant division and proliferation.
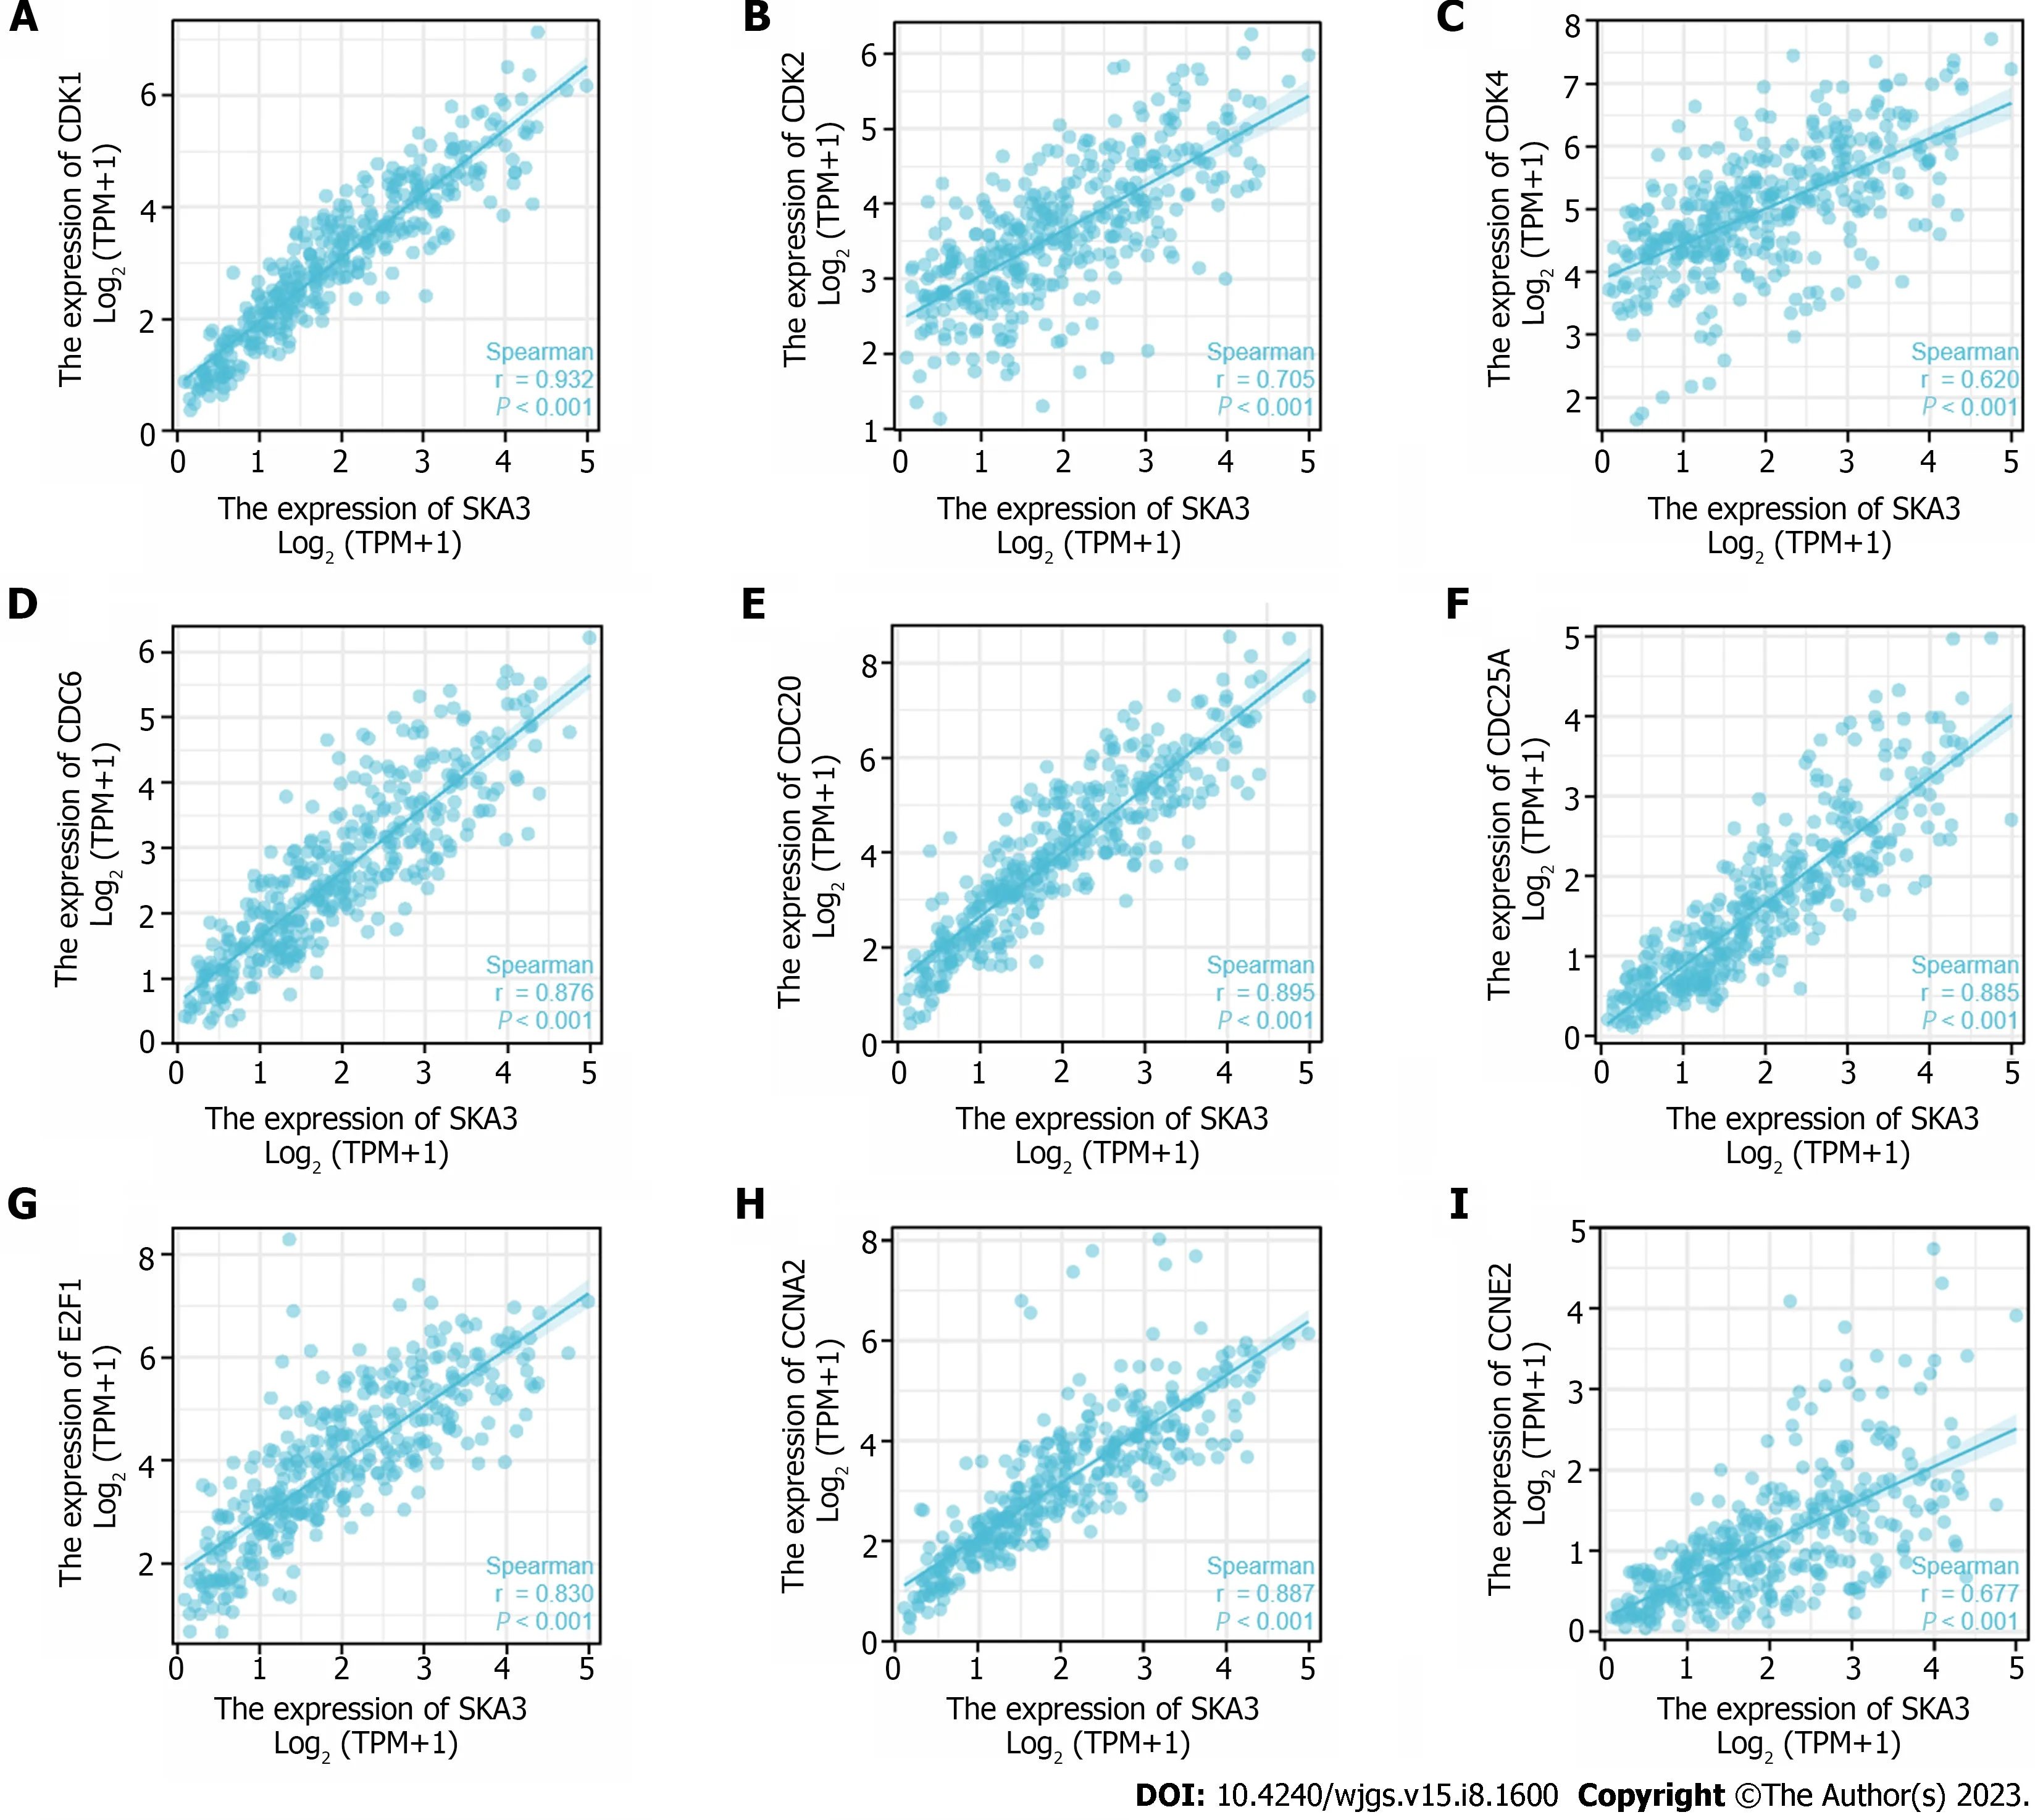
Figure 6 Correlation of spindle and kinetochore-associated complex subunit 3 expression with cell cycle-related molecules. A: Cyclindependent kinase 1; B: Cyclin-dependent kinase 2; C: Cyclin-dependent kinase 4; D: Cell division cycle 6; E: Cell division cycle 20; F: Cell division cycle 25A; G: E2F transcription factor 1; H: Cyclin A2; I: Cyclin E2. SKA3: Spindle and kinetochore-associated complex subunit 3; CDK1: Cyclin-dependent kinase 1; CDK2: Cyclindependent kinase 2; CDK4: Cyclin-dependent kinase 4; CDC6: Cell division cycle 6; CDC20: Cell division cycle 20; CDC25A: Cell division cycle 25A; E2F1: E2F transcription factor 1; CCNA2: Cyclin A2; CCNE2: Cyclin E2.
The tumor microenvironment (TME), consisting of tumor cells, immune cells, and extracellular matrix, is inextricably linked with the development, invasion, and metastasis of tumors. Previous research has proven that a high infiltration of CD8+ T cells in malignant tumors indicates a favorable prognosis[36,37]. Low NK cell activity is associated with an increased risk of carcinogenesis, suggesting its role in the natural immunological host defense mechanisms against cancer[38]. Patients with a high number of DC cell infiltrations had a better prognosis in various solid tumors, such as lung,gastric, and colorectal carcinoma[39]. Interestingly, patients with high SKA3 expression displayed low infiltration levels of CD8+ T cells, NK cells, and DCs, indicating that high SKA3 expression may suppress antitumor-related innate immunity and adaptive immunity in the TME, based on the results from TIMER and ssGSEA. In addition, immune checkpoint inhibitors (ICISs) are an emerging tumor immunotherapy strategy that can improve the prognosis of cancer patients. PDCD-1 and CTLA-4 are common response biomarkers to ICISs. The results showed that SKA3 expression was positively correlated with PDCD-1 and CTLA-4 Levels (P< 0.05). SKA3 may upregulate the expression level of related immunosuppressive molecules (PDCD-1 and CTLA-4), resulting in immune escape. The above results revealed that SKA3 heatmap of the 24 immune cell types; D: Scatter plot. The fitted line showed the relationship between SKA3 expression and immune checkpoint inhibitors(programmed cell death protein 1, cytotoxic T lymphocyte antigen 4). SKA3: Spindle and kinetochore-associated complex subunit 3; HCC: Hepatocellular carcinoma;TIICs: Tumor-infiltrating immune cells; PDCD-1: Programmed cell death protein 1; CTLA-4: Cytotoxic T lymphocyte antigen 4.aP< 0.05,bP< 0.01,cP< 0.001.may affect patient prognosis by regulating immune infiltration and ICI response in HCC.
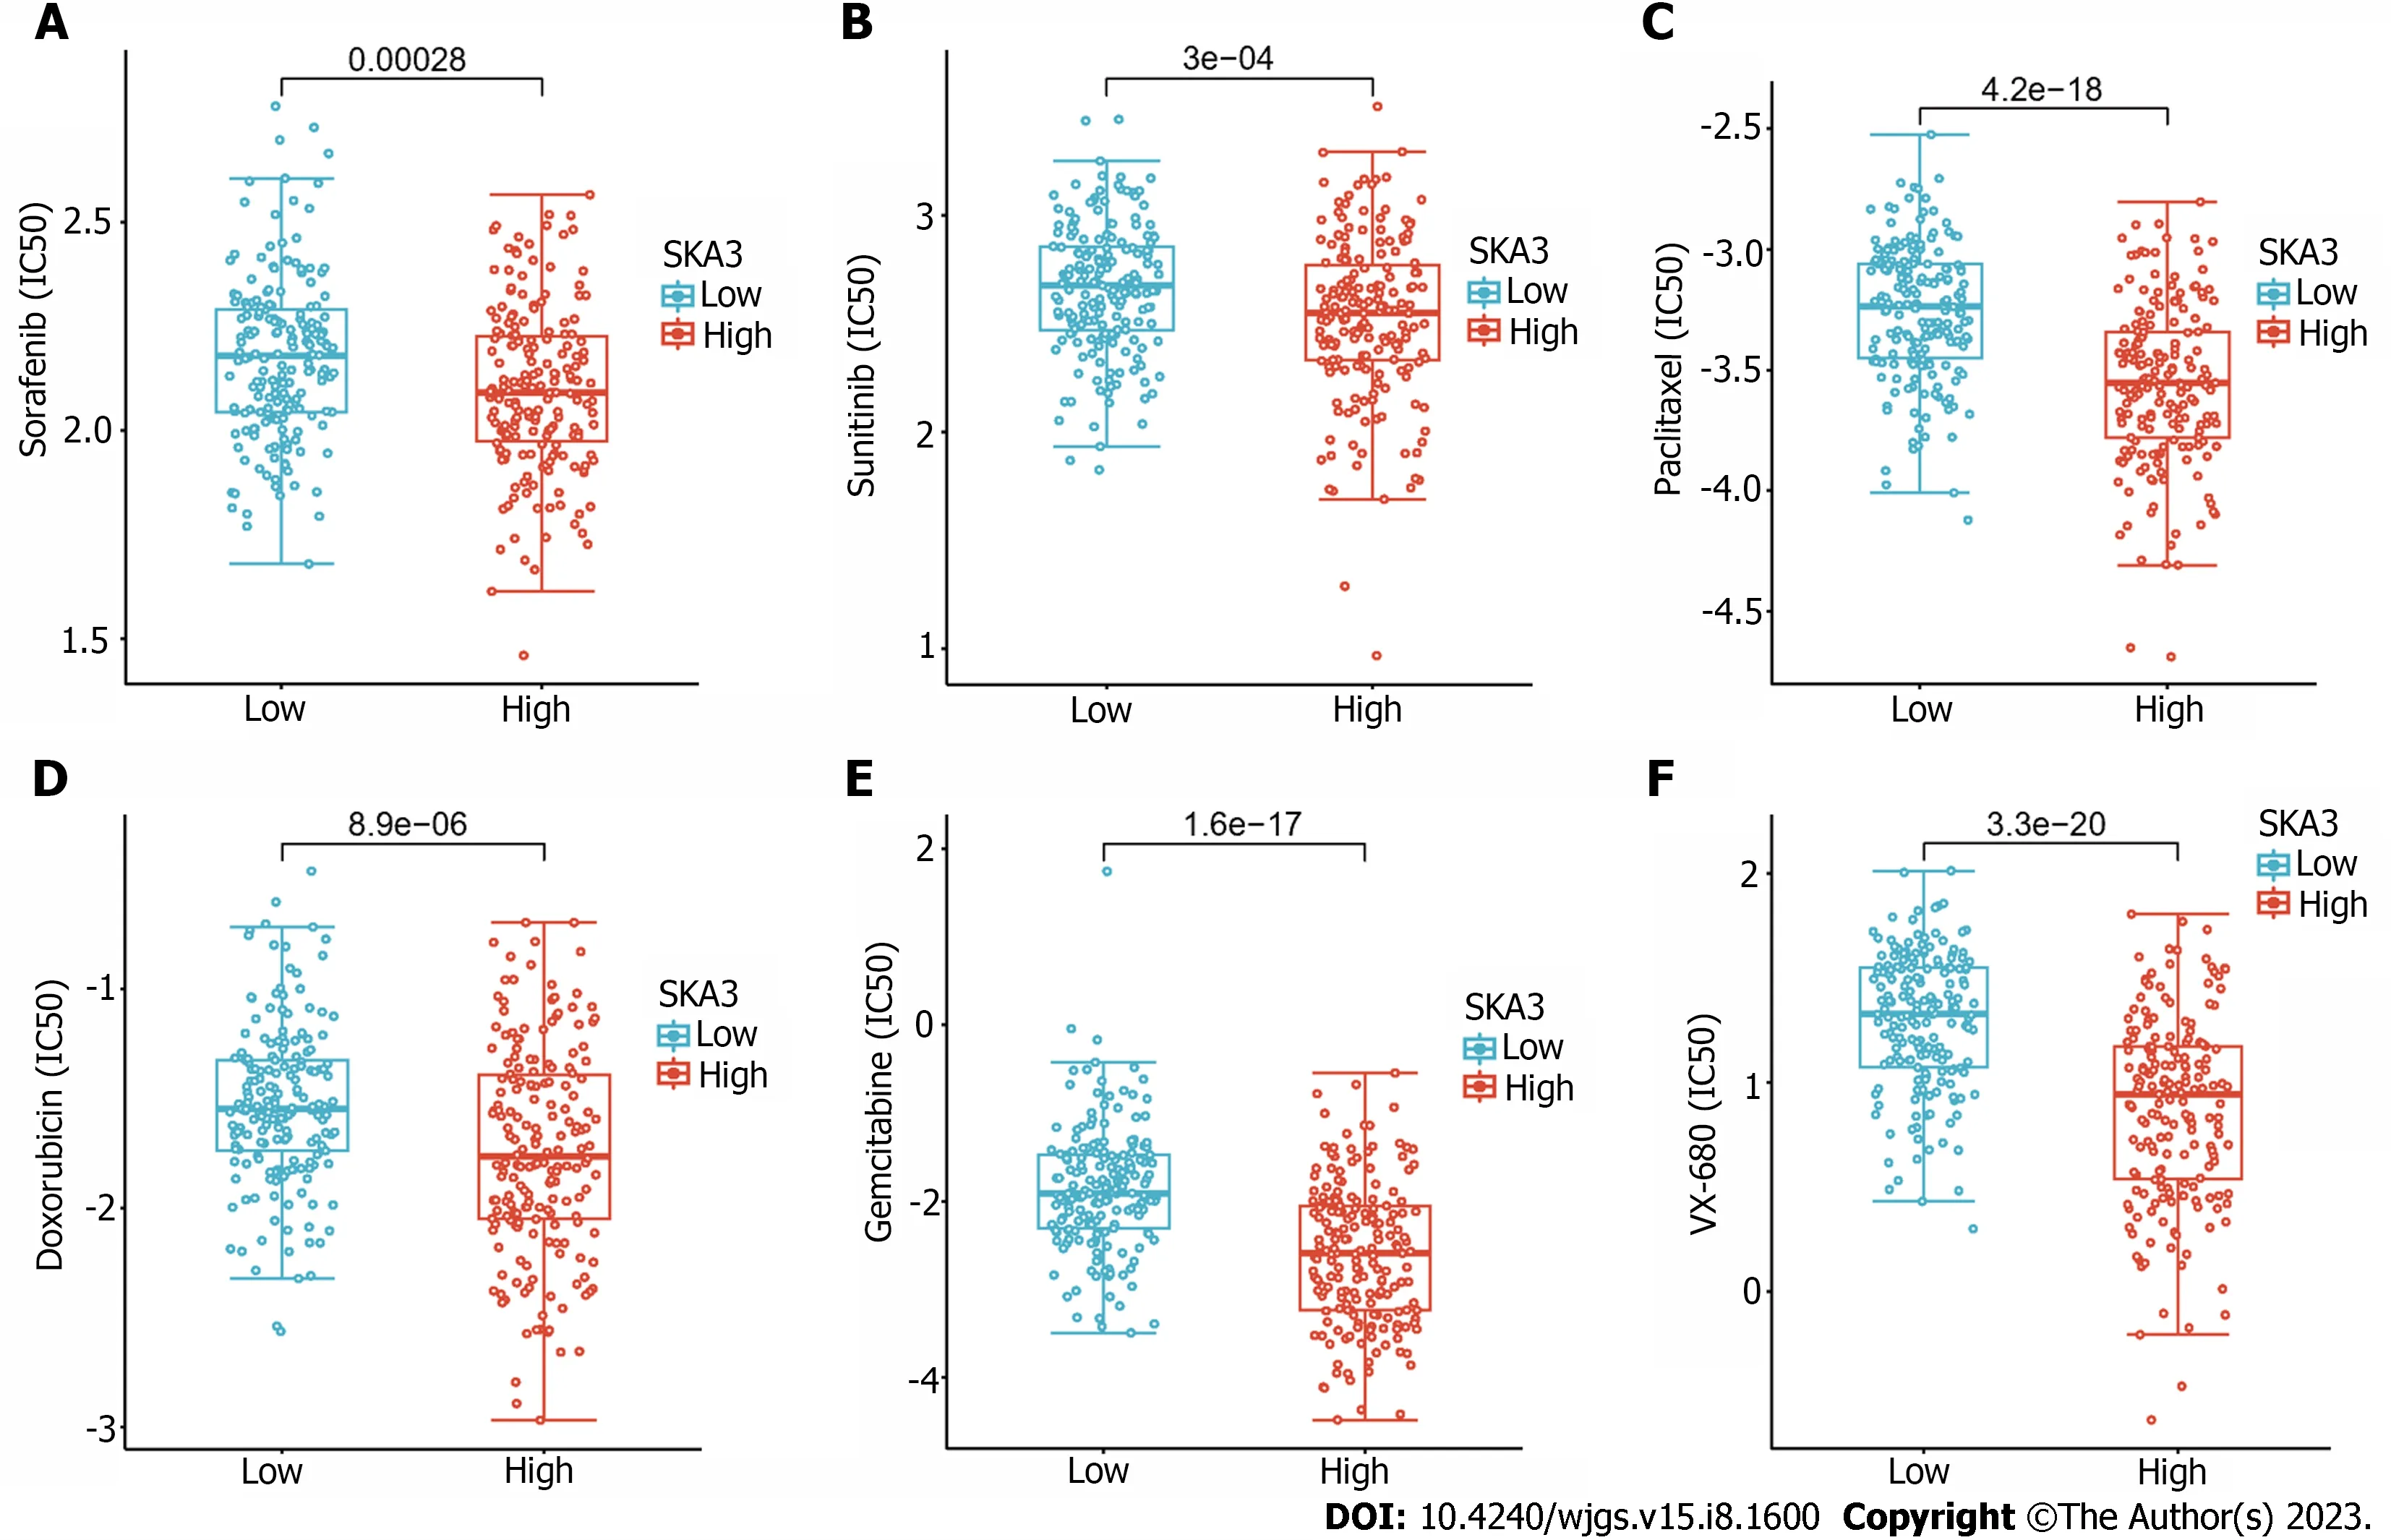
Figure 8 Half maximal inhibitory concentration of six commonly used chemotherapeutic drugs in groups with high and low expression of spindle and kinetochore-associated complex subunit 3. A: Sorafenib; B: Sunitinib; C: Paclitaxel; D: Doxorubicin; E: Gemcitabine; F: Vx-680. IC50: Half maximal inhibitory concentration; SKA3: Spindle and kinetochore-associated complex subunit 3.
For most patients with advanced HCC, chemotherapy remains the main therapeutic strategy, and first-line agents such as sorafenib have improved the prognosis of patients[40]. To investigate the roles of SKA3 on the sensitivity of chemotherapeutics drugs, we also revealed the sensitivity of six commonly used drugs in HCC with high and low SKA3 expression based on the GDSC database. Our results indicated that patients in the high SKA3 group were more sensitive to sorafenib, sunitinib, paclitaxel, doxorubicin, gemcitabine, and vx-680. SKA3 may be a promising predictive marker for therapy in HCC.
通过计算反射波振幅随其入射角θ的变化参数,估算界面上的AVO属性参数(AVO截距P和AVO斜率G)、泊松比和流体因子等多种AVO属性体,识别平面上、空间上储层岩性和预测油气分布。
However, our research also had certain limitations. First, the sample size should be further expanded to increase the credibility of the results. Furthermore, animal experiments are needed to clarify the biological mechanism of SKA3 expression in HCC.
CONCLUSION
Upregulation of SKA3 expression led to poor prognosis in patients with HCC by enhancing HCC proliferation and repressing immune cell infiltration surrounding HCC. SKA3 has the potential to be a potential prognostic biomarker for HCC.
ARTICLE HIGHLIGHTS
Research background
Hepatocellular carcinoma (HCC) is a malignant tumor with high morbidity and high mortality. Therefore, there is an urgent need to explore biomarkers for the early diagnosis, prognostic assessment and treatment of HCC in the clinic.
Research motivation
Spindle and kinetochore-associated protein 3 (SKA3) is a malignancy-related gene, and plays an important role in promoting the proliferation and migration of tumors. Studies have reported that SKA3 overexpression is significantly associated with poor prognosis in various malignant tumors. However, the mechanism of SKA3 in HCC has not been fully elucidated.
Research objectives
This study aimed to explore the molecular mechanisms of SKA3 in HCC.
Research methods
SKA3 expression, clinicopathological characteristics, and survival analysis were performed using the Tumor Immune Estimation Resource (TIMER), The Cancer Genome Atlas and Gene Expression Omnibus databases, and the results were further verified with collected clinical samples by western blot and immunohistochemistry staining. Gene Set Enrichment Analysis (GSEA) was performed to evaluate the biological functions and molecular mechanisms of SKA3 in HCC. In addition, we utilized the TIMER and single-sample GSEA algorithms to estimate the abundances of tumor-infiltrating immune cells in HCC. The R package "pRRophetic" was applied to predict chemotherapeutic response in HCC patients.
Research results
SKA3 was significantly upregulated in HCC, and upregulated SKA3 expression correlated with poor prognosis in HCC patients. Multivariable COX regression analysis indicated that SKA3 was an independent risk factor for overall survival.GSEA revealed that SKA3 may be involved in proliferation-related processes by regulating cell cycle and DNA repair. In addition, there were lower levels of infiltrating CD8+ T cells, natural killer cells, and dendritic cells in the high SKA3 expression group. Drug sensitivity analysis showed that patients with high SKA3 expression were more sensitive to sorafenib, sunitinib, paclitaxel, doxorubicin, gemcitabine, and vx-680.
Research conclusions
High SKA3 expression was associated with poor prognosis and decreased immune cell infiltration in HCC.
Research perspectives
SKA3 may be a biomarker of poor prognosis and a therapeutic target in HCC.
FOOTNOTES
Author contributions:Zheng LL wrote the manuscript; Wang YR, Liu ZR, Wang ZH, Tao CC, Xiao YG, Zhang K, Wu AK and Li HY contributed to the design of and critically reviewed and revised the manuscript; Wu JX, Xiao T and Rong WQ revised the draft; all authors reviewed and approved the final version.
Supported byBeijing Hope Run Special Fund of Cancer Foundation of China, No. LC2020L05.
Institutional review board statement:This study was approved by the Ethics Committee of the Peking Union Medical College Hospital.
Informed consent statement:All study participants or their legal guardian provided informed written consent about personal and medical data collection prior to study enrolment.
Conflict-of-interest statement:All the authors have no conflicts of interest related to the manuscript.
Data sharing statement:Data are available from the corresponding authors upon request.
Open-Access:This article is an open-access article that was selected by an in-house editor and fully peer-reviewed by external reviewers.It is distributed in accordance with the Creative Commons Attribution NonCommercial (CC BY-NC 4.0) license, which permits others to distribute, remix, adapt, build upon this work non-commercially, and license their derivative works on different terms, provided the original work is properly cited and the use is non-commercial. See: https://creativecommons.org/Licenses/by-nc/4.0/
Country/Territory of origin:China
ORCID number:Lin-Lin Zheng 0000-0001-7274-3872; Chang-Cheng Tao 0000-0002-1082-2572; An-Ke Wu 0000-0003-3316-2930; Jian-Xiong Wu 0000-0002-7274-3917; Wei-Qi Rong 0000-0002-1127-1709.
S-Editor:Fan JR
L-Editor:A
P-Editor:Cai YX
猜你喜欢
杂志排行
World Journal of Gastrointestinal Surgery的其它文章
- Initial suction drainage decreases severe postoperative complications after pancreatic trauma: A cohort study
- Vascular complications of chronic pancreatitis and its management
- Historical changes in surgical strategy and complication management for hepatic cystic echinococcosis
- Post-transplant biliary complications using liver grafts from deceased donors older than 70 years:Retrospective case-control study
- Goldilocks principle of minimally invasive surgery for gastric subepithelial tumors
- Prognosis after splenectomy plus pericardial devascularization vs transjugular intrahepatic portosystemic shunt for esophagogastric variceal bleeding
