Extraction method of nanoparticles concentration distribution from magnetic particle image and its application in thermal damage of magnetic hyperthermia
2023-10-11YundongTang汤云东MingChen陈鸣RodolfoFleschandTaoJin金涛
Yundong Tang(汤云东), Ming Chen(陈鸣), Rodolfo C.C.Flesch, and Tao Jin(金涛)
1College of Physics and Information Engineering,Fuzhou University,Fuzhou 350108,China
2Departamento de Automac¸˜ao e Sistemas,Universidade Federal de Santa Catarina,88040-900 Florian´opolis,SC,Brazil
3College of Electrical Engineering and Automation,Fuzhou University,Fuzhou 350108,China
Keywords: magnetic hyperthermia,magnetic nanoparticles distribution,thermal damage,blood perfusion rate
1.Introduction
Magnetic hyperthermia has received widespread attention in the past few years due to its advantages in terms of minimal invasiveness and accurate targeting of the cancerous cells.[1–3]Magnetic nanoparticles (MNPs) contained in magnetic fluid will convert magnetic field energy into heat after being exposed to an applied magnetic field.The heat produced by MNPs can locally rise the temperature in biological tissue during thermal therapy, and if the temperature inside biological tissue is kept within a specific range (42°C to 46°C),malignant cells are damaged and healthy cells are not much affected.[4–6]However,it is quite difficult to regulate the treatment temperature in the biological tissue during therapy,since the temperature field is normally affected by many factors,and the most important one is considered to be the concentration distribution of MNPs inside malignant biological tissue after magnetic nanofluid injection, which does not have accurate models.[7,8]
Although the modeling of MNP concentration distribution has attracted much attention from the researchers in the last years, it is still difficult to have an accurate prediction,given its complexity and the diversity of resulting distributions.As a consequence, the MNPs were usually assumed to be uniformly distributed inside tumor tissues in the first papers in this area.[9]Tanget al.established a poroelastic model considering geometric nonlinear behavior, and simulated an irregular nanofluid distribution inside biological tissues after the nanofluid injection.[10]Nevertheless,the distributions predicted by the mathematical model in Ref.[10] always had some difference with respect to the real case used as baseline for comparison due to the complexity of the injection behavior.
Magnetic nanoparticle imaging (MPI) is based on the magnetization of the MNPs by alternating excitation magnetic fields, and is able to provide an image with some degree of correlation with the spatial concentration distribution of the MNPs by measuring the magnetic intensity signals due to the variation of the magnetic flux.[11]Thus,the MPI method can generate a real-time image of MNP distribution for therapy and overcome the difficulty of accurately predicting MNP concentration distribution inside tumor region.[12,13]However,there are still some gaps in MPI technology that must be filled before it can be fully considered in a magnetic hyperthermia treatment.Sebastianet al.proposed a new design and control method for MPI equipment in order to achieve an accurate temperature control, but the research only considered MNPs inside a test tube, not inside biological tissue.[14]In addition,there are just few works on the MPI reconstruction algorithm in order to improve the prediction accuracy of MNP concentration inside biological tissue, such as the direct reconstruction technique for MPI based on two- and three-dimensional Lissajous trajectory excitation proposed in Ref.[15].Kuboyabuet al.combined MPI images to x-ray CT images for a mice intratumorally injected with MNPs, and confirmed the usefulness of MPI method in monitoring the magnetic targeting effect.[16]However, this interesting research did not provide an investigation on how to use the results to analyze the effects on the treatment temperature or thermal damage for biological tissue.Furthermore,Luet al.demonstrated that a local heating with millimeter accuracy can be achieved by combining MPI with magnetic hyperthermia,and that the real-time MPI imaging can be used to assist in finding the location and estimating the dose of a hyperthermia treatment.[17]In a similar manner to what happens in some other papers,the MNP concentration distribution obtained from the MPI image has not been used for further analysis in magnetic hyperthermia or illustrated a relationship to the thermal damage degree for biological tissue.
This paper proposes a method based on polynomial least squares to determine the concentration value associated with each pixel for a given MPI image and uses it to reconstruct the MNP concentration distribution for the situation that generated the MPI image.The MNPs used in this MPI image is a kind of superparamagnetic iron oxide(Resovist),and its main components consist of Fe3O4and the shell around the MNPs core.The results of treatment temperature distribution and thermal damage degree in a magnetic hyperthermia treatment considering the concentration distribution obtained is compared with two other scenarios under the same dose, that are a uniform distribution and a distribution considering the diffusion behavior after the nanofluid injection.On this basis,this paper also compares the influence of temperature-dependent blood perfusion rate on the treatment temperature distribution for different MNP concentration distributions.
2.Methods
2.1.MNPs concentration distribution extracted from MPI image
The nanofluid concentration distribution after injection is usually decided by many factors,in a process that is very difficult to be predicted.The MPI technology can be used to generate a real-time image for MNP distribution inside malignant biological tissue under the specific excitation for magnetic field.An MPI image provided in Ref.[18]will be considered as the input data to obtain the MNP concentration distribution in this study.The results will then be used for the treatment temperature analysis after a proposed image processing procedure is applied.It is necessary to note that this MPI image can only be very close to a true MNPs distribution inside a living tissue but does not affect the effectiveness of the method by this study.Figure 1 shows the proposed extraction process for MNPs concentration distribution from the specific MPI image by the following steps.

Fig.1.Extraction procedure of MNP concentration distribution from a given MPI image.
(i) Import the original image, and convert to grayscale image for both MPI image and color bar.
(ii)Conduct an equal interval sampling for a column of elements in the pixel matrix of the chroma bar image,and quantize the concentration values for all sampling data points in the chroma bar.
(iii) Building the functional relationship between pixel and concentration values by data fitting method and use it to calculate the concentration value for each pixel of the MPI image.
(iv) Obtain the MNP concentration distribution by using an interpolation function.
In step (ii) above, the functional relationship between pixel and concentration is obtained by fitting data using the polynomial least squares method (LSM).This study obtains the data set ofN+1 discrete point,{(xi,yi),i=0,1,...,N},by the uniform sampling,which can be expressed by an-time polynomial fitting function:[19]
The sum of squares error (SSE) is generally used to evaluate the approximation obtained by the curve fitting.In this study,we consider a weighted version of the LSM to give more importance to some key data in order to improve the overall result.In this case,the SSE can be expressed as[20]
wherew(xi) is the weight associated withxi.The minimum value problem of weighted LSM can actually be converted into the extremum problem for a multivariate function when the partial derivative for Eq.(2)is zero.[21]Thus,one can obtain the following expression:
Then, the fitting functionL(x) can be obtained after solving the linear equations with the coefficients.In fact, the fitting function usually does not fit strictly all data points,since there are much more data points than degrees of freedom for fitting.In this case, the fitting degree can usually be evaluated by SSE,RMSE(root-mean-squared error),andR-square(determination coefficient or squared correlation coefficient)[22]
where ¯yiis the average value of the original data.
Once the concentration value for each pixel point is obtained by the polynomial LSM,the MNP concentration distribution inside biological tissue can then be obtained by using the bilinear interpolation method.In this method, the target point value,f(x,y), can be estimated by four known points:S11 =(x1,y1),S12=(x1,y2),S21=(x2,y1),S22=(x2,y2),which includes the linear interpolation both in thexandydirections with the following equation:[23,24]
2.2.Treatment temperature distribution based on MPI concentration
The MNP concentration distribution keeps modifying after the magnetic nanofluid injection, since the difference in concentration creates a spatial diffusion effect away from the injection site over time.This kind of behavior can be characterized by the convection diffusion equation[25]
where variablesC,ν,D, andtrepresent the MNP concentration, the flow rate, the diffusion coefficient, and the diffusion time,respectively.
The MNPs can dissipate the heat that is applied to magnetic hyperthermia under an alternating magnetic field, so the MNP concentration distribution directly correlates with the treatment temperature distribution during therapy.The temperature distribution can be predicted by Pennes bio-heat transfer (PBHT) equation.[26,27]In this study, the MNPs are supposed to exist just within tumor region, so two different PBHT equations are applied to describe the heat transfer process for malignant and healthy regions:
where subscripts 0, 1, and b represent the healthy tissue, the tumor tissue, and the blood, respectively.Parametersρ,c,k,T,Qmindicate the density,the specific heat capacity,the temperature, and the metabolic heat, respectively.PMNPsis the power dissipation of MNPs under the applied magnetic field,which can be obtained by Rosensweig theory[28,29]
where variablesχ0,τ,µ0,f0,andH0are the equilibrium magnetic susceptibility, the effective relaxation time, the permeability of vacuum,and the frequency and intensity of magnetic field.
2.3.Thermal damage of biological tissue
Temperature rise to a proper range can damage malignant cells, while preserving healthy tissue.In addition to the temperature,the thermal damage of malignant cells is also associated with the frequency factorA,the activation energyEa,and the general gas constantRuaccording to the Arrhenius damage model[30]
whereT(x,y,t) denotes the temperature at position (x,y) at timet.In addition,this thermal damage,Ω(x,y,t),can further be converted to the degree of tissue damage using the following equation:
where this degree,α, has a range between “0” and “1”, and a high value indicates a more serious damage for malignant cells.
3.Materials
3.1.Material parameters
All parameters used for calculation in the case study considered in this study are provided in Tables 1 and 2.Table 1 shows the thermal characteristics for biological tissue,[31,32]and Table 2 lists the properties for both magnetic field and magnetic nanoparticles.[28]In addition, the parameters in the Arrhenius model are 1.19×1035s-1for frequency factor and 232 kJ·mol-1for the activation energy, both given for hepatoma cells as analysis object.[10]

Table 1.Parameters characteristics used for PBHT equation.

Table 2.Magnetic properties for simulation.
3.2.Variable characteristics depending on the therapeutic process
Subsection 3.1 presents constant values for the thermal properties of biological tissues, which are normally obtained under a specific test condition.However, most of them are impacted by many factors,such as the magnetic nanofluid injection behavior and the local temperature distribution.Firstly,the nanofluid injection can lead to changes in the thermal properties of the tumor region.This change mainly depends on the tumor tissue,the MNPs,and especially the volume fraction of MNPs inside bio-tissue,[33]and can be described as
where subscripts t and m represent tumor tissue and MNPs,respectively,andφindicates the volume fraction of MNPs.
In addition,the literature shows that some of the thermal characteristics of bio-tissues are affected by the local temperature.One of such characteristics is the blood perfusion rate.It was assumed to be a constant in most of earlier studies,but this assumption leads to a simulation scenario which has much difference with respect to actual experiments.[34]This paper uses a model for blood perfusion rate considering local temperature so as to have a more realistic result in the process of magnetic hyperthermia:[35]
4.Results and discussion
4.1.MNPs concentration distribution from MPI image
The relationship between the pixel value in an MPI image and the corresponding concentration value can be obtained by a fitting analysis using polynomial LSM after preprocessing all required data.Figure 2 illustrates the fitting curves for the pixel and concentration obtained by four different polynomials considered in the least squares fitting method,which are cubic polynomial,quartic polynomial,weighted quartic polynomial,and quintic polynomial.As can be seen from Fig.2,there are slight differences for polynomials with different degrees, and the higher the degree,the better the fitting accuracy.Although the quintic polynomial LSM can provide the best fitting accuracy with respect to the others, the higher order can also increase the computational burden due to its complexity.Thus,a weighted LSM for quartic polynomials is considered for this study after comprehensive consideration between fitting accuracy and calculation complexity.This proposed method uses larger weights for the border points (0, 0) and (255, 20) and uses smaller weights over the pixel value in the beginning of the range,i.e.,pixel values from 0 to 20.

Fig.2.Fitting curve for pixel and concentration value.
In addition to the fitting curve provided in Fig.2, the differences between the fitting methods were evaluated using three different performance indexes: SSE,RMSE,andRsquare.Smaller values for SSE and RMSE provide the best fitting, while forR-square the best fitting is obtained for values close to unity.As shown in Fig.3,the fitting accuracy does not change significantly when the polynomial degree is larger than three, and in all cases it is almost ideal, with an SSE of less than 3.0 (mg/ml)2, an RMSE of about 0.2 mg/ml, and anR-square which is greater than 0.998.Furthermore, fourdegree and five-degree polynomial fittings have a really close result in all three indexes, and the weighted LSM for quartic polynomials can also obtain an overall better performance and consume less computer resources with respect to the fivedegree case.Thus,the weighted LSM for quartic polynomials will be considered in this study for translating the pixel values from an MPI image into concentration values.
Based on the weighted LSM and the MPI image presented in Fig.1, the following coefficients were obtained for the fitting function:a0=1.506·10-8,a1=-5.658·10-6,a2=4.261·10-4,a3=0.08798,anda4=-1.866·10-4.Further, the concentration value of each pixel in the MPI image can be calculated by the fitted function.Finally, the MNP concentration distribution can be obtained by the bilinear interpolation method based on the known overall concentration value.Figure 4 shows the MNP distribution view in different directions for the given MPI images after using the proposed method.

Fig.4.MNPs concentration distribution after using bilinear interpolation.
4.2.Proposed geometric model
This study uses the liver as the research object to investigate the effect of MNP concentration distribution from the MPI image on magnetic hyperthermia.Figure 5(a) presents a two-dimensional geometric model for a rat liver with a tumor, which was defined based on an experimental image.[36]In order to ease the visualization, figure 5(b) shows the local enlarged view for the tumor tissue and part of the healthy tissue.The figure also includes two monitoring points for the analysis,that are an internal point(P1)and an edge point(P2).
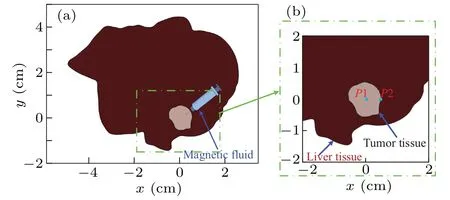
Fig.5.Geometric model for bio-tissue: (a) overall view and (b) local enlarged view.
The MPI-based distribution presented in Fig.4 is considered as the initial MNPs concentration inside the proposed tumor tissue,as shown in Fig.6(a).In addition,the MNP distribution is also associated with the diffusion time after the nanofluid injection, which is set to be 12 h in this study for evaluating the effect of diffusion time on concentration distribution during therapy.It can be observed that the distribution range in Fig.6(b)is distinctly enlarged after 12 h of diffusion compared to the original case showed in Fig.6(a).

Fig.6.MNPs concentration distribution: (a)before diffusion behavior and(b)after 12 h of diffusion.
4.3.Therapeutic temperature distribution inside biological tissue
Once the MNP concentration inside tumor is determined after the injection,the therapeutic temperature distribution can then be predicted by solving the PBHT equations using the finite element method.For the sake of better comparison, this study analyzes the steady-state temperature distribution for three scenarios under the same power dissipation for MNPs(7.95×10⁴W·m-3),that are a uniform concentration distribution and the two inhomogeneous cases presented in Fig.6.As can be observed in Fig.7,the temperature distribution for the case that considers the concentration obtained from the MPI image without extra time for diffusion (Fig.7(b)) is close to the case considering the diffusion behavior (Fig.7(c)).The main difference observed in these two cases is the maximum temperature value observed,since the extra time for diffusion attenuates the peaks.As can be seen in Fig.7(a),the uniform case has a much more uniform temperature distribution than the other two cases, but the peak temperature is considerably smaller than the ones observed in the other two cases for the same therapeutic condition.This situation changes when the individual critical power dissipation of MNPs is considered for different situations.Figure 7(d)illustrates the temperature distribution for biological tissue after improving its power dissipation to a critical value (2.37×10⁵W·m-3), in which the 42-°C isotherm line covers the whole tumor region while the maximum value does not exceed the safety limit of 46°C.It can be concluded that the uniformity of MNP distribution has a positive correlation with the improvement of the treatment temperature profile when the individual critical heat of MNPs is considered.
The analysis above shows that the uniformity of MNP distribution can affect the treatment temperature.In fact, the treatment temperature can also be influenced by the blood perfusion rate due to the different situation of blood flow as a function of temperature.Figure 8 illustrates the treatment temperature distribution for biological tissue based on a temperature-dependent blood perfusion rate, and all the conditions are the same as the ones considered in Fig.7, except the power dissipation of MNPs.The power dissipation is 5.03×10⁴W·m-3for the cases in Fig.8(a)–8(c) and is 1.98×10⁵W·m-3for the case in Fig.8(d), which limit the maximum temperature to 46°C in the model that considers changes in the blood perfusion rate.What is noteworthy is that the decrease in the power dissipation results in an overall rising trend in the treatment temperature distribution and leads to the outward expansion of the 42-°C isotherm inside biological tissue.Therefore, one can conclude that the calculation results considering a temperature-dependent blood perfusion can obtain a better temperature distribution with respect to a constant value under the similar treatment condition.

Fig.8.Therapeutic temperature distribution for different concentration cases considering a temperature-dependent blood perfusion rate: (a)a uniform distribution, (b) the original distribution from MPI image, (c) distribution obtained from MPI image after 12 h of diffusion,(d)the uniform case considering its critical power dissipation.
4.4.Heat induced damage for biological tissue
The analysis made above,based on the treatment temperature distribution, can only reflect the proportion of effective treatment area,but it cannot provide the heat-induced damage of malignant tissue.Figure 9 shows the level of thermal damage to biological tissue after 30 min of therapy based on the therapeutic temperature distribution depicted in Fig.8.The degree of thermal damage shown in Fig.9 has a similar trend as the temperature distribution shown in Fig.8, which means the thermal damage to malignant tissue during magnetic hyperthermia is primarily defined by the therapeutic temperature.Similarly,the uniform case considering its critical power dissipation (Fig.9(d)) exhibits the best performance among the four cases,with a larger area inscribed in the 0.75 isotherm and a larger value for the peak damage.Further,there is no significant difference between Fig.9(a)and Fig.9(b)in the degree of thermal damage with and without diffusion behavior when the power dissipation of MNPs is the same.Interestingly,the thermal damage degree can be improved significantly for the case in Fig.9(b)when the power dissipation is set to its individual critical value.In this case,the maximum value of therapeutic temperature can reach the critical value of 46°C and the area percentage of significant damage degree can be increased from 25.21%in Fig.9(b)to 42.14%in Fig.9(c).That also implies a suitable diffusion time after the magnetic nanofluid injection can benefit the treatment effect by if a corresponding power dissipation for MNPs is considered.

Fig.9.Thermal damage degree distribution for different scenarios after 30 min of therapy: (a)the original MPI distribution considering its specific critical power,5.03.×104 W·m-3;(b)the MPI distribution after 12 h of diffusion considering the same power with(a);(c)the(b)case considering its specific critical power,5.80.×104 W·m-3;(d)the uniform case considering its specific critical power,1.98.×105 W·m-3.
Figure 10 shows the values of thermal damage degree over time for two specific points based on the therapeutic temperature distribution presented in Fig.8, which are actually corresponding to the values of Fig.9.As is illustrated in Fig.10, the thermal damage degree at the inner pointP1 is always greater than the that observed for the edge pointP2.In addition,the uniform case can always obtain a greater thermal damage degree compared to the other cases under the same condition.Additionally, the rising speed for pointP1 is relatively fast at the start stage, while it slows down after 20 min of heating.However,the change for pointP2 seems always to keep at a constant rate,which can be explained by the boundary heat exchange between the malignant and healthy tissue.As a consequence, the associated time constant is larger than the one observed in the inner part of the tumor.In total, the thermal damage degree of malignant tissue is associated with many factors,including the therapeutic temperature,the treatment duration,the biological tissue characteristics,and the position.Thus,one can improve the thermal damage degree for malignant tissue by regulating the therapeutic temperature and extending the therapeutic time properly during magnetic hyperthermia.

Fig.10.Thermal damage degree over time at two specific points.
5.Conclusion
This study is mainly concerned on the extraction of MNP concentration distribution from a given MPI image, and the use of such information for planning a magnetic hyperthermia treatment.For that purpose,the study compares the therapeutic temperature and thermal damage degree for different scenarios including the concentration distribution obtained from an MPI image.Simulation results demonstrate that the weighted LSM using a quartic polynomial can obtain the best overall fitting performance between pixel values and concentration values when compared with many other fitting methods.Further, this concentration distribution from a real MPI image receives a worse result both in the therapeutic temperature and thermal damage degree when compared with a uniform distribution presented in most of previous reports.Nevertheless,this situation can be improved to some extent when a diffusion behavior after the nanofluid injection is considered and an individual critical power of MNPs is assumed.The results show that the area percentage of damage degree is increased from 25.21% in the original MPI distribution to 42.14%after 12 h of diffusion considering its individual critical power.In addition, the treatment effect considering a temperature-dependent blood perfusion rate can obtain a better result than the one obtained assuming a constant parameter.As a consequence, it is important to improve the simulation models to reflect reality and improve the pre-clinical studies in the area of magnetic hyperthermia.Future work will evaluate optimum injection strategies associated with nanofluid dose to improve MNP distribution for magnetic hyperthermia treatments.
杂志排行

Chinese Physics B的其它文章
- Dynamic responses of an energy harvesting system based on piezoelectric and electromagnetic mechanisms under colored noise
- Intervention against information diffusion in static and temporal coupling networks
- Turing pattern selection for a plant–wrack model with cross-diffusion
- Quantum correlation enhanced bound of the information exclusion principle
- Floquet dynamical quantum phase transitions in transverse XY spin chains under periodic kickings
- Generalized uncertainty principle from long-range kernel effects:The case of the Hawking black hole temperature