The Processes-Based Attributes of Four Major Surface Melting Events over the Antarctic Ross Ice Shelf
2023-09-07WenyiLIYutingWUandXiaomingHU
Wenyi LI, Yuting WU, and Xiaoming HU
1School of Atmospheric Sciences, Sun Yat-sen University and Southern Marine Science and Engineering Guangdong Laboratory (Zhuhai), Zhuhai 519000, China
2Institute of Atmospheric Physics, Chinese Academy of Sciences, Beijing 100029, China
3Chongqing Research Institute of Big Data, Peking University, Chongqing 401333, China
4Guangdong Province Key Laboratory for Climate Change and Natural Disaster Studies,Sun Yat-sen University, Zhuhai 519000, China
ABSTRACT The Ross-Amundsen sector is experiencing an accelerating warming trend and a more intensive advective influx of marine air streams.As a result, massive surface melting events of the ice shelf are occurring more frequently, which puts the West Antarctica Ice Sheet at greater risk of degradation.This study shows the connection between surface melting and the prominent intrusion of warm and humid air flows from lower latitudes.By applying the Climate Feedback-Response Analysis Method (CFRAM), the temporal surge of the downward longwave (LW) fluxes over the surface of the Ross Ice Shelf (RIS) and adjacent regions are identified for four historically massive RIS surface melting events.The melting events are decomposed to identify which physical mechanisms are the main contributors.We found that intrusions of warm and humid airflow from lower latitudes are conducive to warm air temperature and water vapor anomalies, as well as cloud development.These changes exert a combined impact on the abnormal enhancement of the downward LW surface radiative fluxes, significantly contributing to surface warming and the resultant massive melting of ice.
Key words: Ross Ice Shelf (RIS), surface melting, warm and humid air advection, downward longwave radiation, Climate Feedback-Response Analysis Method (CFRAM)
1.Introduction
Summer warming in West Antarctica has amplified over the last several decades, with more frequent extreme warming events of extended duration, which has resulted in the massive ice mass loss of the West Antarctic Ice Sheet(WAIS) and fringing ice shelves (Steig et al., 2013; Thomas et al., 2013; Kingslake et al., 2017; Wille et al., 2019; Feron et al., 2021).The Ross-Amundsen sector of the WAIS has warmed since the late 1990s (Steig et al., 2009; Bromwich et al., 2013; Scott et al., 2019), resulting in more surface melting.Surface melting is an important contributing factor for the WAIS mass loss, which not only directly affects the total mass balance of the Antarctic Ice Sheet through surface mass balance processes (Dietz and Koninx, 2022) but also significantly weakens ice shelf stability (The IMBIE Team,2018; Wille et al., 2022).As the second largest contributor to global sea level rise, the accelerating ice mass loss since the 1990s, especially in the West Antarctic Ice Sheet (Shepherd et al., 2012; Paolo et al., 2015), has accounted for a nearly 7 mm sea level rise since 1979 (Rignot et al., 2019).Increased meltwater from Antarctica traps more warm water below the sea surface, further accelerating the Antarctic ice loss, ultimately leading to enhanced global temperature variability and serious economic and climatic impacts (Bronselaer et al., 2018; Golledge et al., 2019; Schloesser et al., 2019;Dietz and Koninx, 2022).
The climate of West Antarctica is controlled by largescale atmospheric circulation patterns (Clem et al., 2019;Zhang et al., 2021).The strong advection of warm, moist air into West Antarctica associated with Amundsen Sea blocking activities provides a favorable condition for summer warming events in West Antarctica, such as the January 2016 surface melting event in Ross Ice Shelf (RIS, Scott et al., 2019).Uotila et al.(2013) found that the southward movement of cyclones into the Ross Sea tends to be more frequent during the positive phase of the semiannual oscillation (SAO).Scott et al.(2019) found that weaker westerlies and frequent blocking activities during El Niño years enhance surface melting in the WAIS, which is also consistent with the findings of Nicolas et al.(2017).Wille et al.(2019) reported that about 40% of the summer meltwater generated across the RIS is associated with intense moisture advection from lowlatitude areas.In addition, foehn or downslope winds can further enhance surface warming (Elvidge and Renfrew, 2016;Bozkurt et al., 2018; Datta et al., 2019; Elvidge et al.,2020).
Besides advective processes associated with atmospheric motions, local radiative and non-radiative processes that affect the surface energy balance (SEB) also contribute to surface melting events in RIS.It has been confirmed that cloud cover largely controls the spatial differences in the SEB.Optically thick cloud cover not only reduces the net shortwave radiation but also enhances the net longwave radiation (Van Den Broeke et al., 2006; Bennartz et al., 2013; Ghiz et al.,2021).Scott et al.(2017) found that low-level liquid water clouds occur frequently in December—January, particularly in the RIS region, while mixed-phase clouds are more common in the western RIS above the complex terrain.They further report that clouds could enhance the radiative forcing of the West Antarctic Ice Sheet by as much as 26 W m—2in summer.A temporal surge of downward longwave radiation flux is critical for the extreme and historical surface melting event over the RIS in January 2016 (Nicolas et al., 2017; Hu et al., 2019; Scott et al., 2019).In addition to the direct effects of clouds, clouds might also weaken the ice-albedo positive feedback by decreasing the radiation absorbed by the surface, thereby reducing the melting rate of the ice surface (Choi et al., 2020), while at the same time, also promoting the enhancement of melting in Antarctica, through their longwave radiative effects (Lenaerts et al., 2017).
Here, we examine four prominent surface melting cases over the RIS (marked in Fig.1) in the past 40 years.These occurred during the austral summer in 1982/1983, 1991/1992, the early 2005, and 2015/2016, with their total melt days derived from passive microwave satellite observations(Nicolas et al., 2017; Zou et al., 2021).
The remainder of this paper is organized as follows.Section 2 discusses the data and methods used in this study.In section 3, we present the main results, including the melting and SEB conditions of the four events and their contributions to changes in the surface LW radiative energy fluxes due to the atmospheric water vapor anomalies, cloud property anomalies, and atmospheric temperature anomalies.Section 4 provides a brief summary of the key findings of this study.
2.Data and methods
The daily averaged data of atmospheric variables, including specific humidity, cloud liquid water content, cloud ice content, atmospheric temperature, and wind velocity, are derived from the fifth-generation European Centre for Medium-Range Weather Forecasts reanalysis data from 1981 to 2016 (ERA5; Hersbach et al., 2020).The preprocessed data have a horizontal resolution of 1° × 1° and a vertical resolution consisting of 19 pressure levels.The surface data include surface latent heat flux, surface sensible heat flux, downward/upward longwave radiative energy fluxes(LW), and downward/upward shortwave radiative surface energy fluxes.The daily vertically-integrated water vapor transport (IVT) is calculated from the specific humidity and wind fields as follows:
where q represents specific humidity, g is the acceleration of gravity (9.81 m s—2), and Iqu and Iqv represent the zonal and meridional vertically-integrated water vapor transport,respectively.
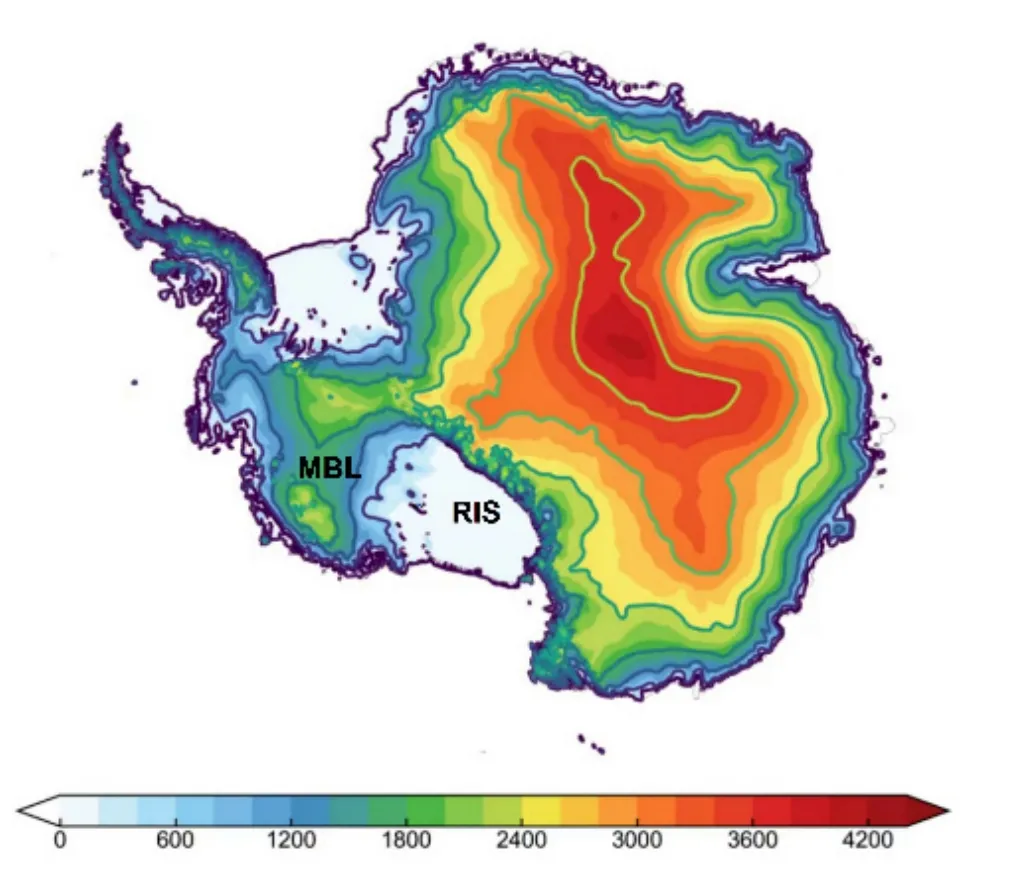
Fig.1.Local topography (m) of Antarctica.The Ross Ice Shelf(RIS) and Marie Byrd Land (MBL) are marked.
We mainly focus on daily data in the domain bounded by 120° to 180°W and 75° to 85°S covering the austral summer from 1 December to 31 January.Four large surface melting events over the RIS sector of the WAIS are chosen considering their prominent melt intensity and distinguishing duration according to previous findings (Nicolas et al., 2017;Zou et al., 2021).According to Nicolas et al.(2017), the four strongest surface events are selected for further discussion.The exact lengths of each event follow Zou et al.(2021).Surface melting events are detected from passive microwave radiometer data (SMMR and SMM/I, Picard et al., 2007) using the algorithm developed by Torinesi et al.(2003) and Picard and Fily (2006), with a spatial resolution of 25 km.The total melt days represent the cumulative days when melting is detected at the corresponding grids.The daily anomaly fields of all atmospheric and surface variables during these four RIS melting events are defined as their departures from the daily climatology of 1981—2010.The annual climatological cycle is obtained from the daily climatology without smoothing.


where ∆Taircorresponds to the daily anomaly field of the air temperature directly derived from the ERA5 data.
3.Results
The averaged integrated water vapor transport obtained from the ERA5 reanalysis (Figs.2a—d) indicates a general import of poleward moisture toward the RIS and adjacent areas during four events.The eastern RIS and western Marie Byrd Land (MBL, Fig.1) are affected by the intrusion of strong marine moist air streams from the Amundsen and Ross Seas.Except for the 2016 melting event, the years corresponding to the other three events were all associated with the negative SAM phase, typically associated with weaker circumpolar westerlies and one of the strongest El Niño events in history occurred in 2016 (Nicolas et al., 2017).It is seen from Figs.2i—l that the melting events of 1982/1983 and 1991/1992 were more prolonged than those of 2005 and 2016.From the daily IVT spatial distribution, we find that the melting events of 2005 and 2016 were characterized by a more intense but largely ephemeral moisture transport(Figs.2c, d), responsible for a significant surge of downward LW surface radiation fluxes (Figs.2g, h).In particular, the poleward movement of anomalously warm and moist air(with an IVT over coastal MBL up to 80 kg m—1s—1) from the Amundsen Sea toward the western MBL and farther inland across the RIS coincides with the temporal evolution of the 2005 melting event.The corresponding spatial distribution of positive downward LW radiation anomalies suggests that lower-latitude marine air advection plays an important role in the surface energy balance, further causing surface melting.
Figure 3 shows the time series of regional average anomalies (180°—120°W and 75°—85°S) of surface temperature,downward LW radiation fluxes, and net LW/SW radiation fluxes during the four prominent RIS melting events.There is a prominent one-to-one correspondence for the amplitude and duration between the anomalies of both the downward LW radiation surface energy flux and the surface temperature, with the latter lagging the former by a few days.The synchronization between the temporal evolution of the net SW radiative energy fluxes and surface temperature anomalies can possibly be explained by the reduced upward shortwave radiation due to decreased surface albedo.The sum of the anomalies of the net SW and LW radiative energy fluxes is balanced by the anomalies of surface turbulent heat fluxes(figures not shown).Overall, the resultant surface energy budget during the four surface melting events is consistent with the results of Zou et al.(2021).Therefore, the temporal surge of downward LW radiative fluxes from the air to the surface results in the rapid increase of surface temperature,which, in turn, causes melting and a reduction in the surface albedo.
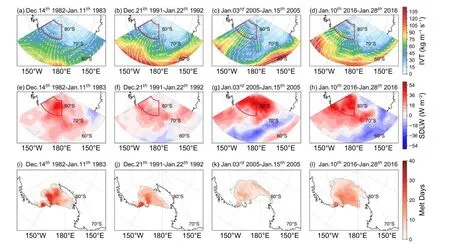
Fig.2.(a)—(d) Spatial distribution of integrated water vapor transport (IVT) for the four melt cases from ERA reanalysis data.Colors indicate the intensity of the IVT, and arrows indicate the direction.(e)—(h) Spatial distribution of surface downward longwave radiation (SDLW) and (i)—(l) the total melt days during four melt cases from passive microwave radiometer data.The red box covering 180°—120°W and 75°—85°S indicates the region used for averaging.
Figure 4 shows the decomposition of the total downward LW radiative surface energy flux perturbations into the three terms on the right-hand side of Eq.(2) for each of the four melting events.The sum of the three partial perturbation terms (solid blue lines in Figs.4a—d) is very close to the actual total downward LW radiative energy flux anomalies(red dashed lines) obtained directly from the ERA5 reanalysis, confirming the validity of our decomposition.According to Fig.4, all processes positively contribute to the undulant downward LW radiation changes.Among the three terms,the contributions of cloud-induced perturbations to the temporal evolution of the (total) downward LW radiative surface energy flux perturbations are dominant during the 1982/82 and 2016 events but are comparable to the contributions of water vapor and air temperature during the 1991/92 and 2005 events.In the 2016 melting event, cloud-induced surface radiative LW energy fluxes surged to 60 W m—2on 12 January, contributing about 60% to the total perturbations.The temporal evolution of both the cloud-induced and water vapor-induced surface radiative LW energy flux perturbations are nearly synchronous, although the impact of the water vapor feedback on increasing downward LW radiative flux is relatively weak (generally below 20 W m—2).It is significant that the temporal evolution of the air temperatureinduced surface radiative LW energy flux perturbations are relatively smoother than their counterparts of cloud and water vapor feedbacks.After accounting for the effects of clouds on downward SW flux, which always opposes their effects on LW flux, we conclude that the air temperature feedback is the primary contributor to the melting process.This inspires us to further decompose the total air temperature anomalies, as indicated in section 2.
Next, the anomalous fields of cloud, water vapor, and air temperature during the melting events are shown in Fig.5.The corresponding partial air temperature changes(PTCs) due to clouds, water vapor, and atmospheric advective processes are shown in Fig.6, noting that the decomposition of the total air temperature perturbations into the three terms on the right-hand side of Eq.(3) are presented for each of the four melting events.The sum of three PTCs (contours of the right column in Fig.6) matches well with the (total) air temperature anomalies, confirming the validity of Eq.(3).It can be seen that the PTC associated with atmospheric advective processes is not only the largest term among the three PTCs, but also positively correlated with the total air temperature perturbations in each of the four melting events.Therefore, the air-temperature-induced surge of the downward LW radiative fluxes is mainly caused by warm advection associated with the poleward movement of warm air, as shown in Fig.2.A portion of the abundant moisture in conjunction with the poleward movement of warm air is condensed via adiabatic cooling, forming clouds, which, in turn, further enhances the downward LW radiative fluxes.
4.Summary

Fig.4.Time series of regionally averaged (180°—120°W, 75°—85°S) partial perturbations of the downward longwave radiative (LWD) surface energy flux (W m—2) due to air temperature anomalies alone (ta), cloud anomalies alone (cld),and water vapor anomalies alone (wv).The solid blue lines represent the total perturbation of these three forcings, and the dashed red lines represent the observations of downward longwave radiative flux at the surface.

Fig.3.Time series of regionally averaged (180°—120°W, 75°—85°S) daily anomalies of skin temperature (TS), surface downward longwave radiation (SDLW), net shortwave radiation (SWNET), and net longwave radiation (LWNET)from ERA reanalysis data.The Y axis (left) denotes TS, and the Y axis (right) denotes SDLW, SWnet, and LWnet.The pink shadow represents the melting period.
We examined the atmospheric contributions via the downward LW radiative fluxes to the four strong and prolonged ice melting events over the Ross Ice Shelf (RIS) and adjacent areas from December 1982 to January 1983, December 1991 to January 1992, January 2005, and January 2016.We first performed a comprehensive analysis of the enhancement of the poleward advection of atmospheric warm and humid into the RIS region during these melting events (Fig.2).We further quantified the individual contributions of clouds,water vapor, and atmospheric advective processes to the enhancement of surface LW radiative surface energy fluxes(Figs.4 and 6).The results confirm the role of anomalously strong warm and humid air advection from lower latitudes into the RIS sector of the WAIS to the subsequent enhancement of the surface LW radiative surface energy fluxes due to clouds, water vapor, and air temperature anomalies.Zou et al.(2021) demonstrated that warm air advection and the foehn effect were the main factors affecting cloud conditions via the cloud-forming effect of moisture transport and the cloud-clearing effect of foehn winds.In this study, we further prove that the surface melting events over the RIS are dominated by abnormal longwave radiation.The increase in SDLW is mainly induced by the dynamic atmospheric transport of warm air as opposed to moisture-related processes.The response to the SDLW surge is abnormally warmer surface temperatures, which, in turn, causes surface melting.The reduction of surface albedo due to the consequent loss of ice mass would lead to more solar energy being absorbed by the surface, further amplifying ice mass loss.
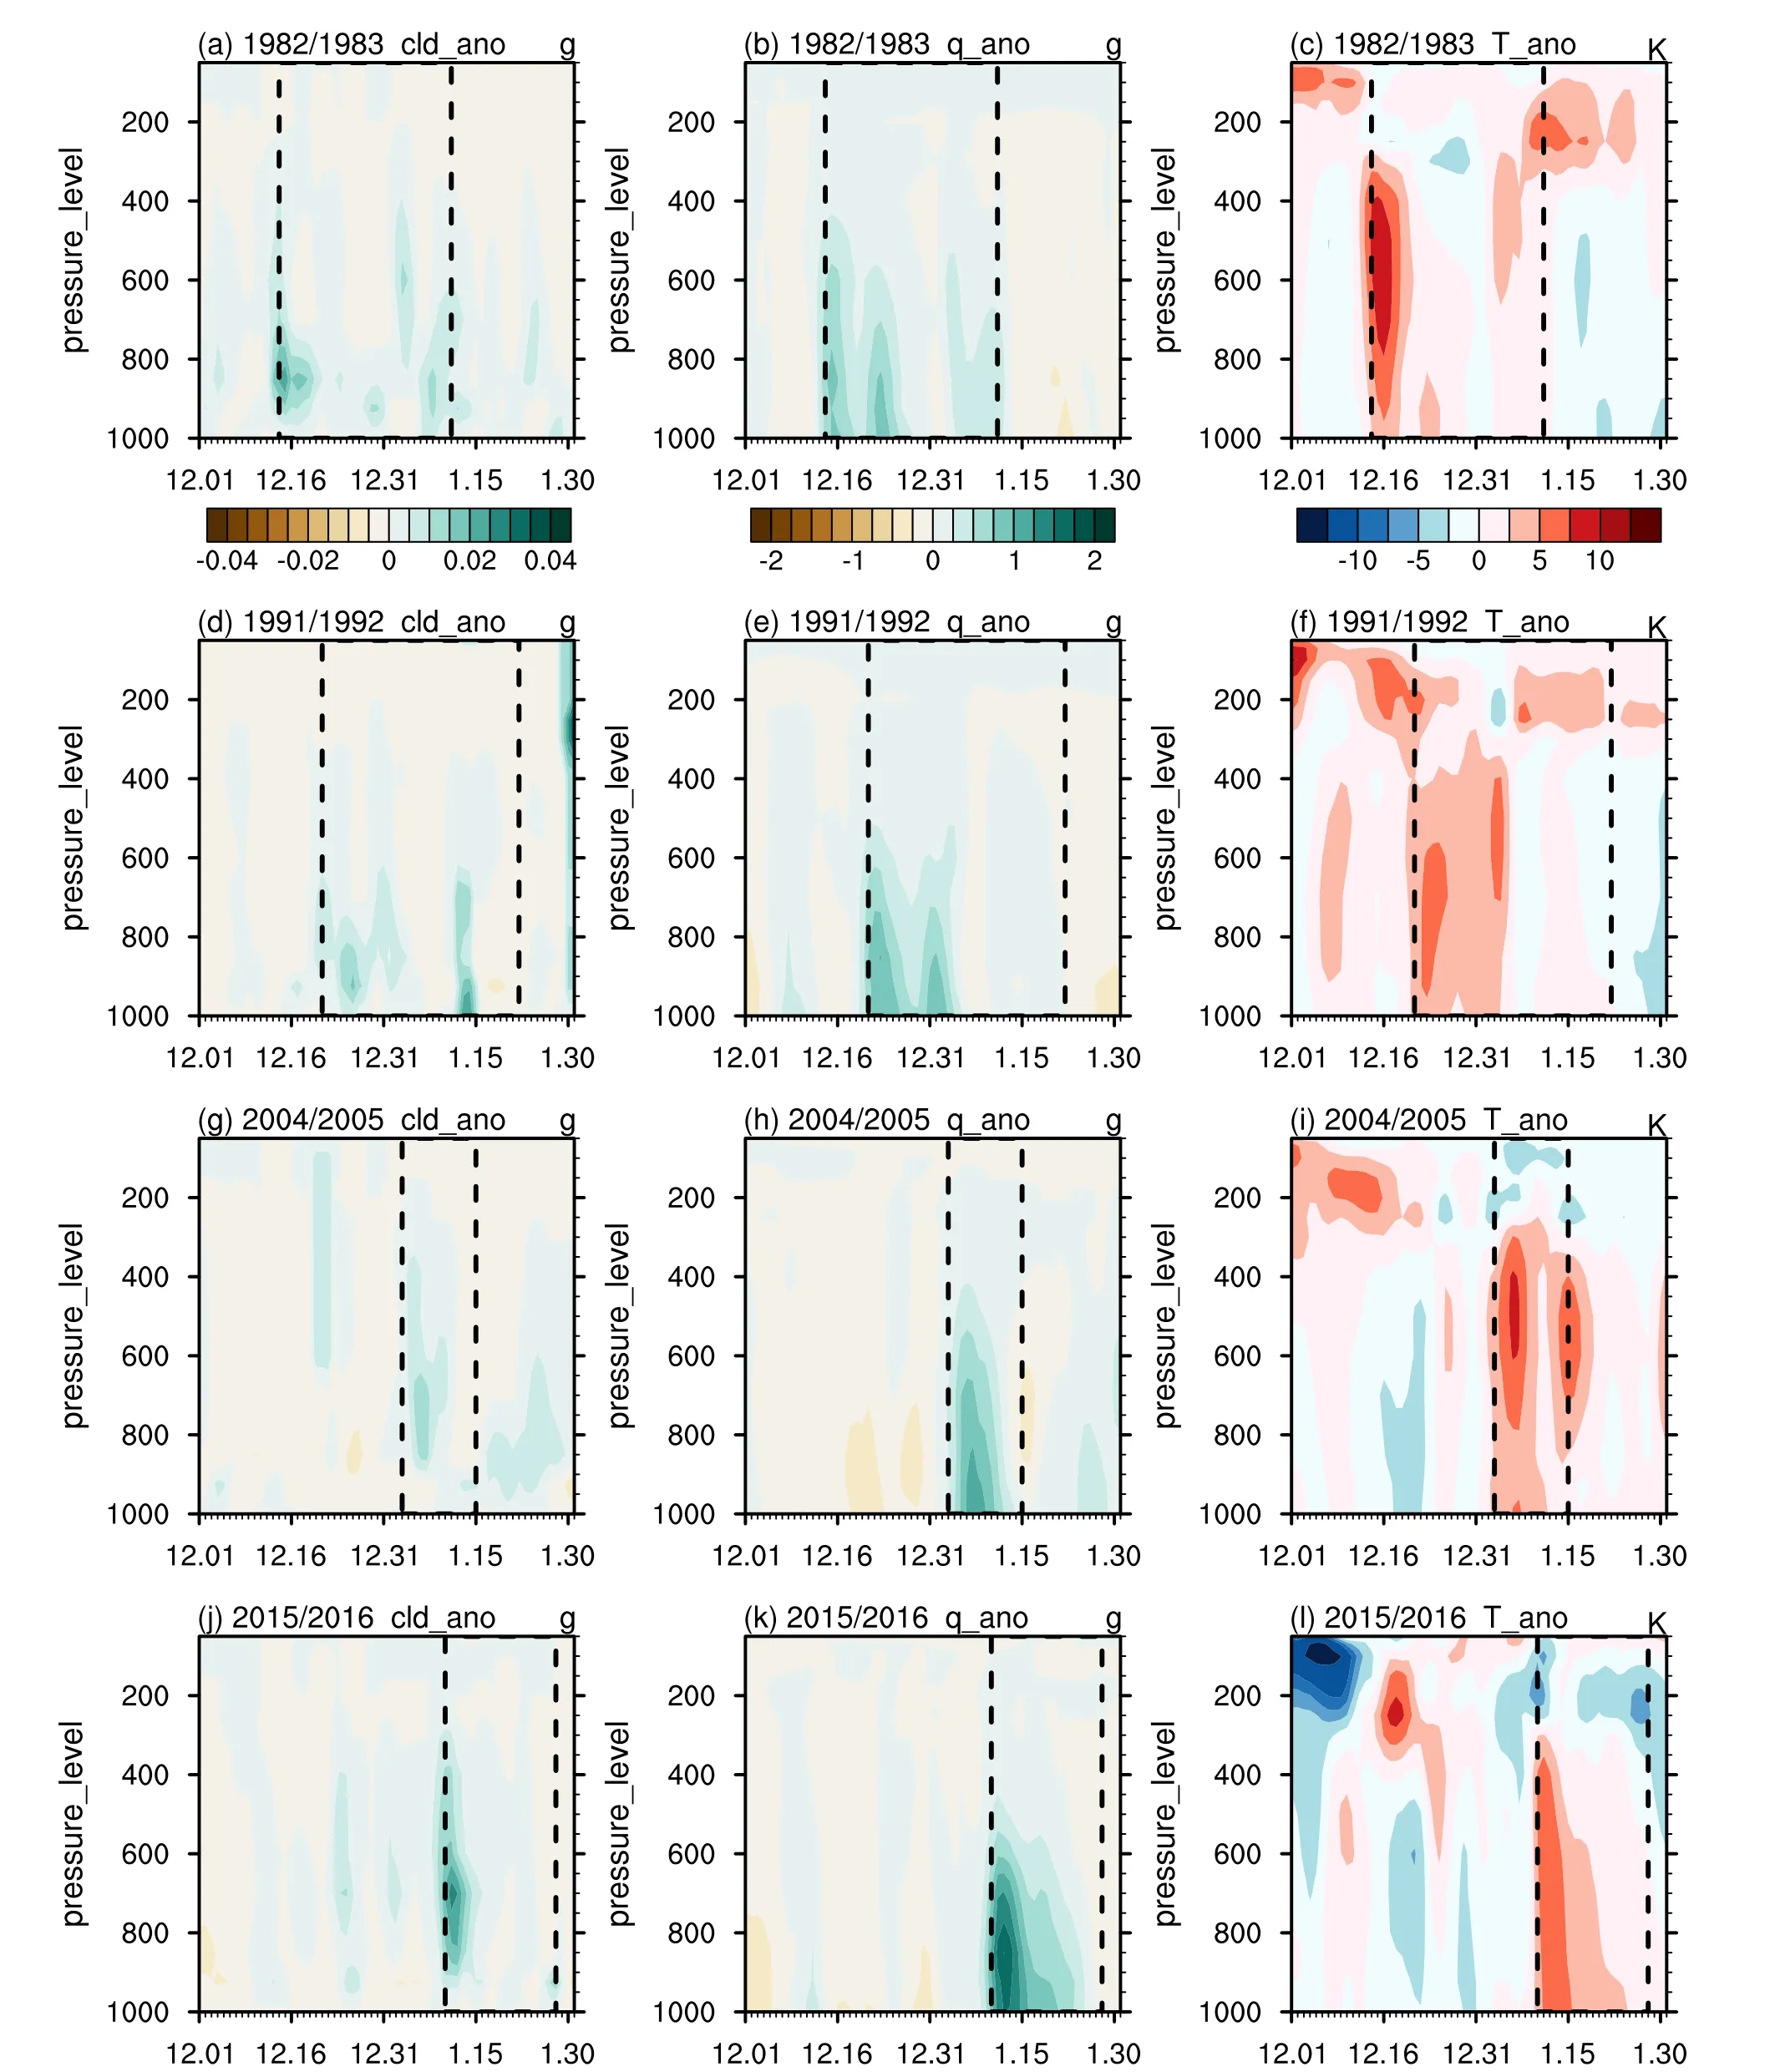
Fig.5.Vertical-time cross-section diagrams of daily anomalies of regionally averaged (180°—120°W, 75°—85°S) cloud water content (cld), specific humidity (q), and air temperature (T) for the four melt cases.The dashed black straight lines mark the melting period.
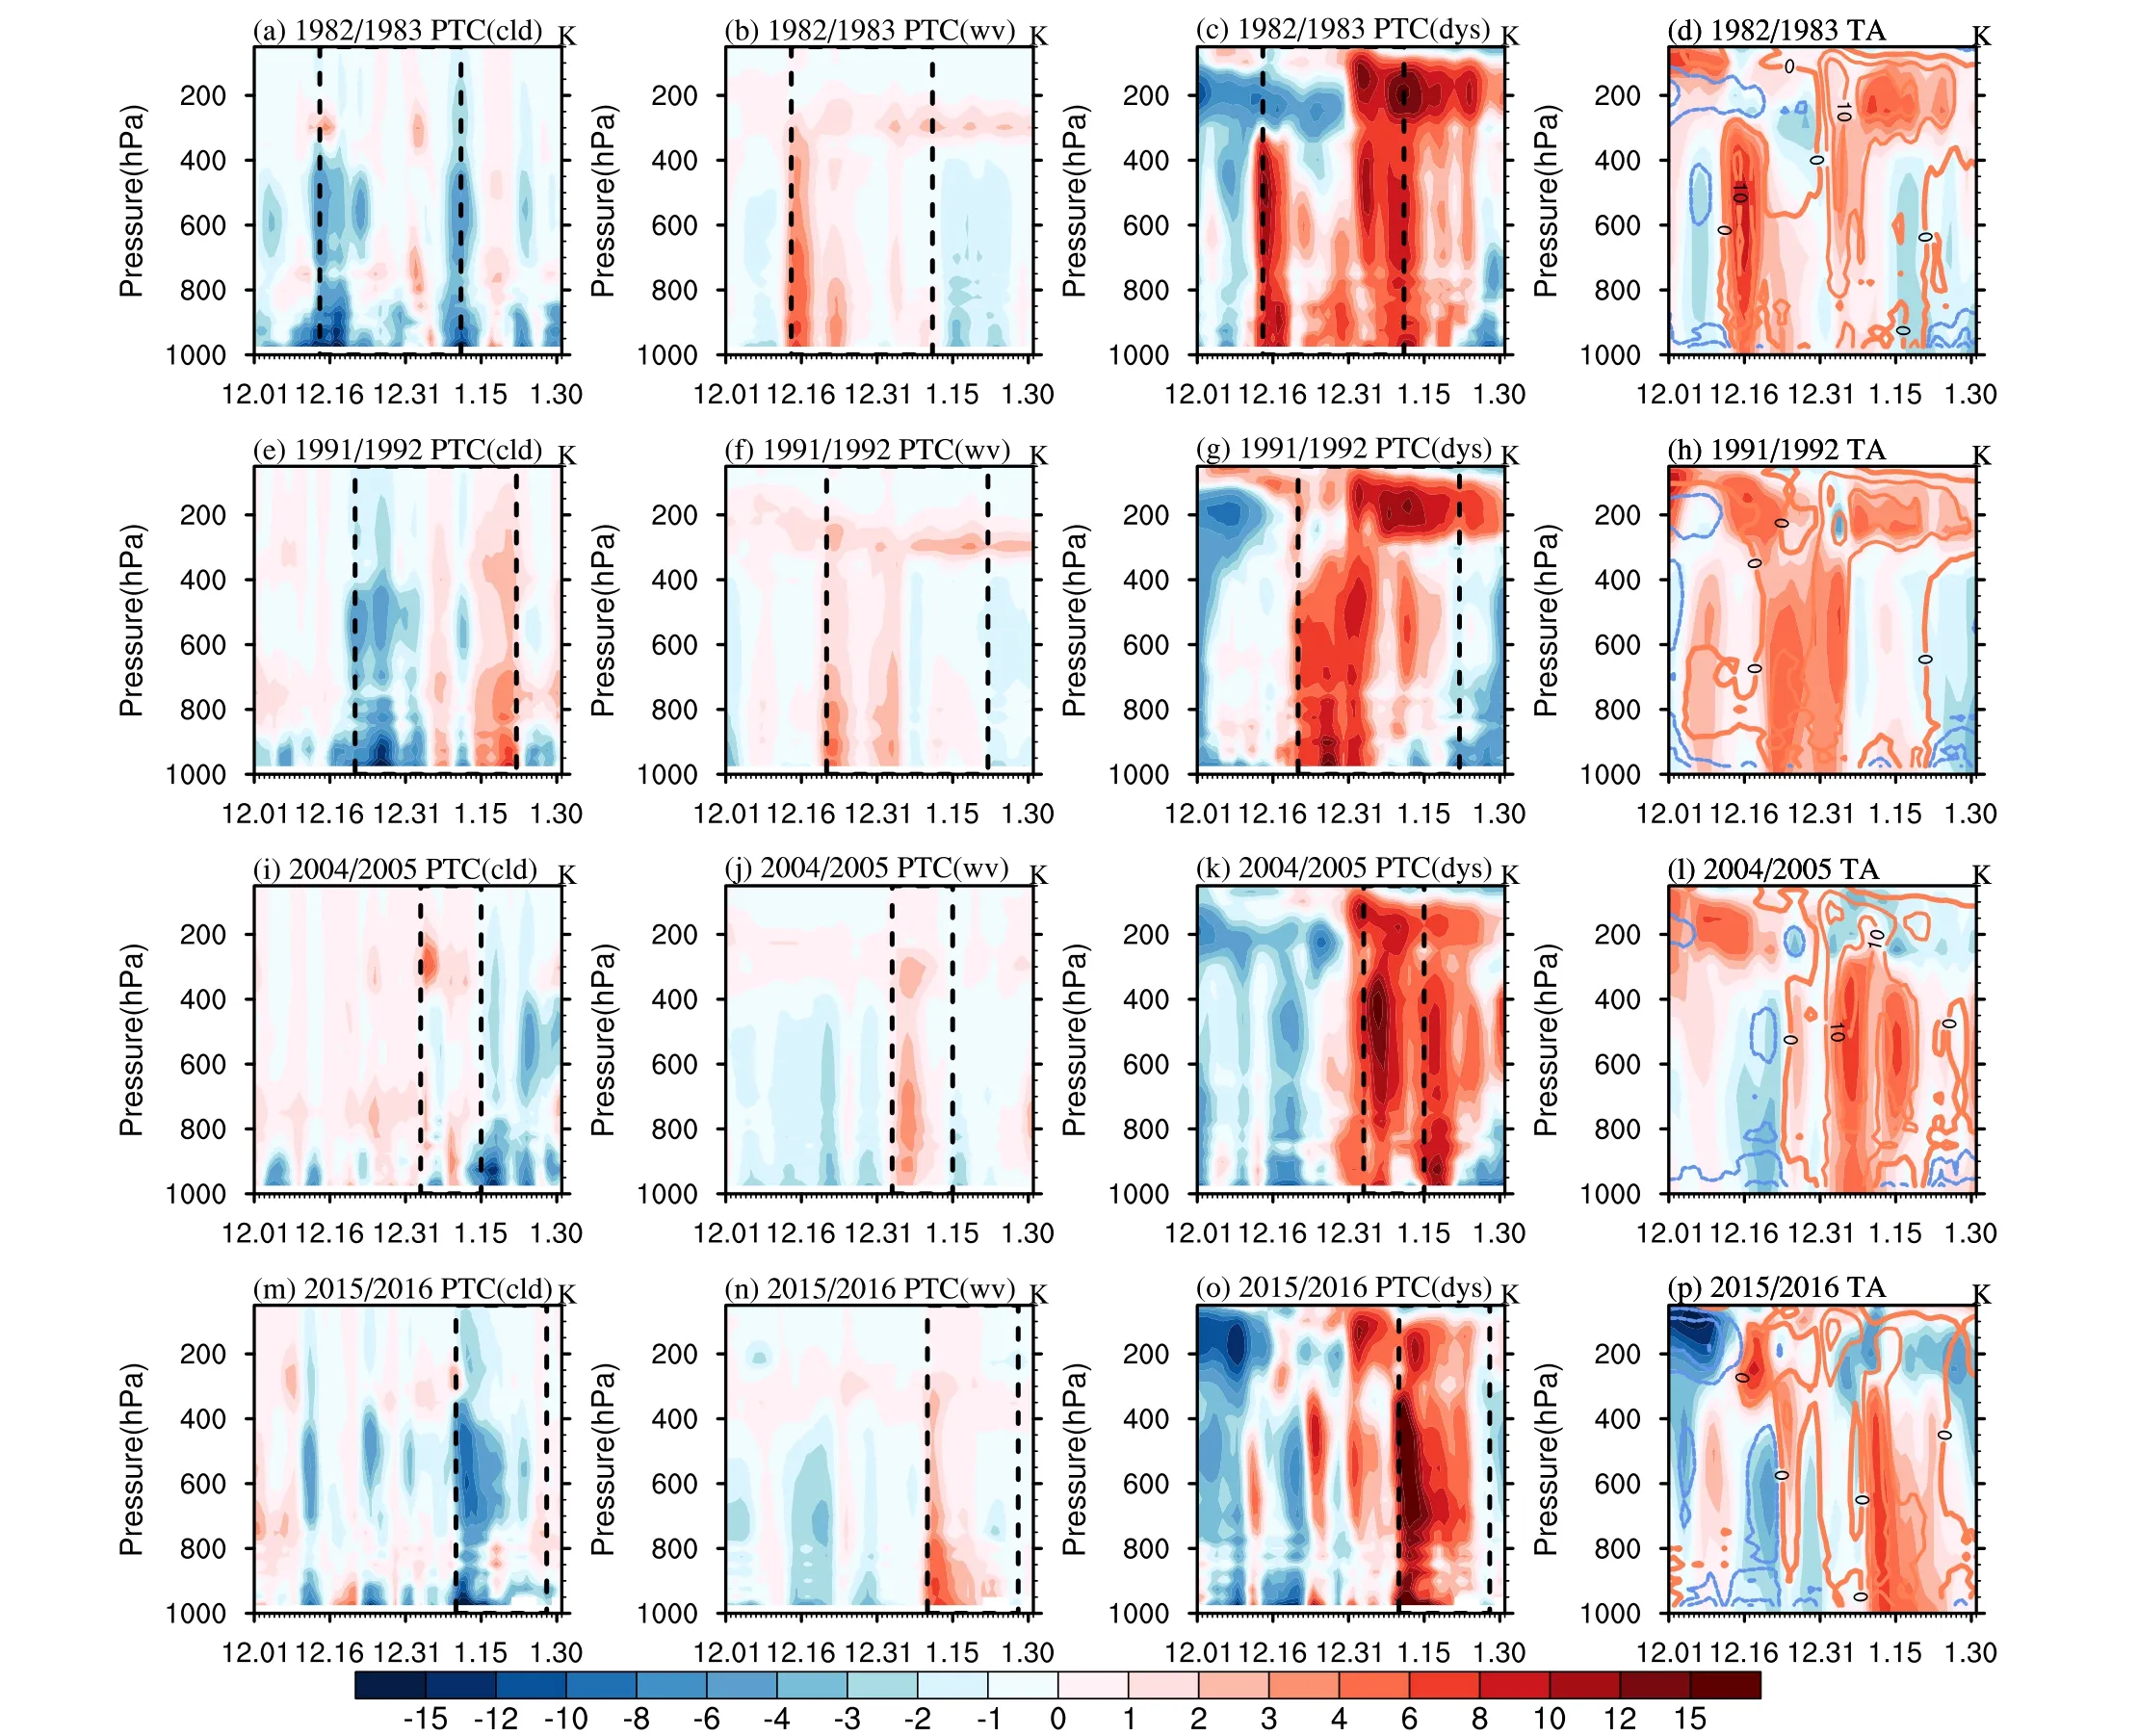
Fig.6.Vertical-time cross-section diagrams of daily partial air temperature anomalies (PTC, K) of clouds (cld), water vapor(wv), and atmospheric advective/convective processes (dys) for the four melt cases.The dashed black straight lines mark the melting period.The diagrams in the fourth column represent daily air temperature anomalies (shaded), and the contours represent the sum of PTC of clouds, water vapor, and dynamic processes.The area for the regional averaging is the same as in Figs.3—5.
This study has not yet addressed the nature of the climate variability modes that cause the anomalously strong warm and humid air advection from lower latitudes to the RIS.The warm and humid air intrusions, namely the north wind intrusion, are regulated not only by the large-scale circulation, such as Rossby wave teleconnections (Li et al., 2021)but also by synoptic-scale storms (Turner et al., 2022).Previous work (Nicolas et al., 2017) indicates that strong surface melting events in austral summer are favored by concurrent El Niño-related atmospheric circulation, which promotes warm air advection to the RIS.However, strong surface melting events have also occurred during La Niña years.The interannual variability of surface melting over the RIS as it relates to ENSO is worthy of further investigation.We plan for our future work to investigate the dominant mode among climate factors or systems responsible for anomalous north wind intrusions over the RIS on interannual timescales.
Acknowledgements.The authors are grateful for the insightful comments from the editor and two anonymous reviewers that helped to greatly improve the paper.This study was supported by the National Natural Science Foundation of China (Grant Nos.42075028 and 42222502) and the Southern Marine Science and Engineering Guangdong Laboratory (Zhuhai) (Grant SML2021SP302).
杂志排行
Advances in Atmospheric Sciences的其它文章
- The 17th Workshop on Antarctic Meteorology and Climate and 7th Year of Polar Prediction in the Southern Hemisphere Meeting
- Modulation of the Wind Field Structure of Initial Vortex on the Relationship between Tropical Cyclone Size and Intensity
- A Lagrangian Trajectory Analysis of Azimuthally Asymmetric Equivalent Potential Temperature in the Outer Core of Sheared Tropical Cyclones
- Coupling of the Calculated Freezing and Thawing Front Parameterization in the Earth System Model CAS-ESM
- Hybrid Seasonal Prediction of Meridional Temperature Gradient Associated with “Warm Arctic-Cold Eurasia”
- Enhanced Seasonal Predictability of Spring Soil Moisture over the Indo-China Peninsula for Eastern China Summer Precipitation under Non-ENSO Conditions
