A Scd1-mediated metabolic alteration participates in liver responses to low-dose bavachin
2023-09-05PnShenZhiJieBiLeiZhouNingNingWngZheXinNiDeZhiSunCongShuHungYngYiHuChengRongXioWeiZhouBoLiZhngYueGo
Pn Shen ,Zhi-Jie Bi ,Lei Zhou ,Ning-Ning Wng ,Zhe-Xin Ni ,De-Zhi Sun ,Cong-Shu Hung ,Yng-Yi Hu ,Cheng-Rong Xio ,Wei Zhou ,***,Bo-Li Zhng ,Yue Go ,*
a Department of Pharmaceutical Sciences,Beijing Institute of Radiation Medicine,Beijing,100850,China
b State Key Laboratory of Component-based Chinese Medicine,Tianjin University of Traditional Chinese Medicine,Tianjin,301617,China
Keywords: Bavachin Hepatotoxicity Scd1 Lipid metabolism Single-cell RNA-Seq
ABSTRACT Hepatotoxicity induced by bioactive constituents in traditional Chinese medicines or herbs,such as bavachin(BV)in Fructus Psoraleae,has a prolonged latency to overt drug-induced liver injury in the clinic.Several studies have described BV-induced liver damage and underlying toxicity mechanisms,but little attention has been paid to the deciphering of organisms or cellular responses to BV at no-observedadverse-effect level,and the underlying molecular mechanisms and specific indicators are also lacking during the asymptomatic phase,making it much harder for early recognition of hepatotoxicity.Here,we treated mice with BV for 7 days and did not detect any abnormalities in biochemical tests,but found subtle steatosis in BV-treated hepatocytes.We then profiled the gene expression of hepatocytes and nonparenchymal cells at single-cell resolution and discovered three types of hepatocyte subsets in the BVtreated liver.Among these,the hepa3 subtype suffered from a vast alteration in lipid metabolism,which was characterized by enhanced expression of apolipoproteins,carboxylesterases,and stearoyl-CoA desaturase 1 (Scd1).In particular,increased Scd1 promoted monounsaturated fatty acids (MUFAs) synthesis and was considered to be related to BV-induced steatosis and polyunsaturated fatty acids(PUFAs)generation,which participates in the initiation of ferroptosis.Additionally,we demonstrated that multiple intrinsic transcription factors,including Srebf1 and Hnf4a,and extrinsic signals from niche cells may regulate the above-mentioned molecular events in BV-treated hepatocytes.Collectively,our study deciphered the features of hepatocytes in response to BV insult,decoded the underlying molecular mechanisms,and suggested that Scd1 could be a hub molecule for the prediction of hepatotoxicity at an early stage.
1.Introduction
In China,up to 27% of drug-induced liver injuries (DILI) are ascribed to traditional or herbal medicines,both of which are key components of the healthcare system [1,2].However,it is undeniable that some hepatotoxic traditional Chinese medicines (TCMs)have unique curative effects and cannot be completely used clinically.For instance,Fructus Psoraleae(FP),the dried fruit ofPsoraleacorylifolia Linn.,is a type of tonic TCMs that is commonly used in clinics for the treatment of various diseases (such as vitiligo and osteoporosis) [3,4],even though adverse events related to liver injuries are frequently reported after FP or FP-containing formula administration [5-8].Hence,restricting the intake of toxic ingredients and the early detection of hepatotoxicity could assist in the management of DILI risk associated with FP and other TCMs.
Bavachin (BV),the main flavonoid in FP,not only regulates multifunctional processes,such as coagulation[9],bone formation[10],anti-cancer [11],anti-inflammatory [12],and antiviral activities [13],but also causes adverse effects,especially liver injury.Accumulated experimental evidence has demonstrated that excessive doses of BV usually cause a cascade of adverse outcomes in hepatocytes,such as redox oxidative stress,organelle damage and dysfunction (especially in the mitochondria and endoplasmic reticulum(ER)) [14],inhibition of key metabolic enzymes (such as UDP-glucuronosyltransferase 1A1 (UGT1A1)) [15],programmed cell death (including apoptosis and ferroptosis) [16,17],and pathological damage to the liver,all of which are the typical mechanisms of action of termed intrinsic and dose-related DILI [18].Moreover,BV exposure can trigger immunological stress conditions and eventually result in idiosyncratic hepatotoxicity that might be individual-specific.However,most TCM-induced DILI,both intrinsic and idiosyncratic,progress slowly to overt clinical symptoms after long-term exposure to toxic constituents at very low concentrations [1].Complete determination of the cellular response to BV during the asymptomatic phase of hepatic injury would contribute to early prediction and intervention of BVinduced hepatotoxicity.Unfortunately,little attention has been paid to the landscape of the toxic damage response in the liver under repeated or chronic BV exposure at non-acute toxic levels.
As one of the largest organs of the body,the liver consists of many cell types,including hepatocytes,sinusoidal endothelia,and intrahepatic biliary epithelial cells,and plays an irreplaceable role in material metabolism[19].Upon encountering low levels of toxic insults,heterogeneous responses of these cells are devoted to cellular damage repair and conservation of liver function.In addition,the robust renewal capability of hepatocytes guarantees a timely supplement to injured sensitive cells that cannot be repaired completely.Exposure to low doses of BV and other toxic agents usually results in homeostasis,where different types of cells can deal with induced toxic reactions,resulting in liver adaptation without non-detectable injury and possibly along with the appearance of different cell subtypes.However,when catastrophic injuries exceed the self-repair ability,the adaptive responses of the liver would be inadequate.At present,some specific responses emerging in specific cell populations can disrupt homeostasis and initiate the onset of liver injuries,ultimately progressing to various DILI manifestations [1].A comprehensive cell type-specific response profile to BV under these conditions can help elucidate the molecular toxicological mechanism underlying BV-induced hepatocellular injury,as well as the discovery of cell subtypes and related biomarkers that predict the DILI risk of BV.
Unprecedented advances in single-cell RNA sequencing(scRNAseq) enhanced the detection sensitivity of potential toxic effects and helped decipher heterogeneous responses,even subtle changes or perturbations in the transcriptional profile and/or trajectories caused by low-dose toxic agents at different cell masses [20,21],instead of the average responses of organisms detected by conventional bulk assays that obfuscate intracellular heterogeneity.In this study,we evaluated the adverse effects of low-dose BV administration on mouse liver via serum biochemical tests and pathological examination and profiled the gene expression of hepatocytes and non-parenchymal cells in BV-treated (at a dose that did not induce any detectable clinical manifestations) and normal livers using scRNA-seq.Our work is the first to display the landscape of gene expression in hepatocytes responding to BV insult before the advent of overt acute hepatic injury and revealed the critical role of stearoyl-CoA desaturase 1 (Scd1)-mediated changes in lipid metabolism.These findings would greatly enhance our understanding of the development of hepatotoxicity induced by BV or BV-containing formulas and offer clues for the prediction of early liver injury caused by BV in the clinic.
2.Materials and methods
2.1.Reagents and chemicals
BV (high performance liquid chromatography (HPLC) ≥98%)was purchased from Yuanye Bio-Technology Co.,Ltd.(Shanghai,China).Ethylene glycol bis-(2-aminoethyl ether)-N,N,N′,N′-tetraacetic acid (EGTA,purity ≥97%),4-(2-hydroxyethyl)-piperazine-1-ethanesulfonic acid (HEPES,purity ≥99%),collagenase IV,trypsin inhibitor,and bovine serum albumin (BSA) were purchased from Solarbio Science and Technology (Beijing,China).Anti-Albumin(ALB,16475-1-AP) was obtained from Proteintech Co.,Ltd.(Wuhan,China).Anti-SCD1 (#2794) was purchased from Cell Signaling Technology Inc.(Danvers,MA,USA).Lipid peroxidation malondialdehyde (MDA) assay kit (S0131S) was obtained from Beyotime Biotechnology Co.Ltd.(Shanghai,China).Enzyme-linked immunosorbent assay(ELISA)kits for monounsaturated fatty acids(MUFAs,JM-0685201),polyunsaturated fatty acids (PUFAs,JM-0684701),and saturated fatty acids (SFAs,JM-0685701) were purchased from Jiangsu Jingmei Biological Technology Co.,Ltd.(Yancheng,China).The tissue triglyceride content assay kit(E1013)and tissue total iron content colorimetric assay kit (E1050) were obtained from Applygen Technologies Inc.(Beijing,China).
2.2.Mice feeding and drug treatment
Female Kunming mice (6-8 weeks old) were purchased from the Beijing Vital River Laboratory Animal Technology Co.,Ltd.(Beijing,China).After 3 days of adaptive feeding,mice were randomly divided into eight groups (n=6),including a normal control group (0.9% normal saline) and seven BV administration groups (12.5,25,50,100,200,400,and 800 mg/kg).BV was prepared with an aqueous solution of 0.5% sodium carboxymethyl cellulose and intragastrically administered to mice in each group once a day for seven consecutive days.The animal experiments were performed in accordance with national and institutional guidelines and the experimental protocols were approved by the Ethics Committee of Animal Experiments of Beijing Institute of Radiation Medicine (Approval number: IACUC-DWZX-2020-605).
2.3.Serum biochemical test
The total body and liver weights of the mice were recorded at sacrifice around 24 h after the last administration.Blood samples were collected from the femoral artery for biochemical serum analysis.After standing at room temperature for 1 h,mouse blood was placed in a centrifuge at 4°C and centrifuged at 1,000gfor 10 min.The supernatant was collected to determine the serum biochemical indices,including the concentrations of alanine aminotransferase (ALT) and aspartate aminotransferase (AST),using an automatic biochemical analyzer Cobas c 311 (Roche,Basel,Switzerland).
2.4.Liver histochemical and immunofluorescence staining
Fresh liver was fixed in 4%paraformaldehyde and embedded in paraffin.Liver paraffin sections were stained with hematoxylin and eosin,and images were collected using a scanner (Nikon DS-U3,Nikon,Tokyo,Japan) to observe pathological changes in the murine liver.For immunofluorescence staining,after deparaffinization and rehydration,paraffin sections were blocked with BSA at 25°C for 30 min and incubated with primary antibodies,including anti-ALB (diluted 1:200),anti-SCD1 (diluted 1:200) at 4°C overnight.After three times of thorough washes,the sections were incubated with a secondary antibody corresponding to the primary antibody at room temperature for 1 h and washed.The 4′,6-diamidino-2-phenylindole (DAPI) dye was subsequently stained for 10 min in the dark.Liver tissue sections were imaged using a full-section imaging microscope equipped with Pannoramic Scanner software(Pannoramic DESK,Budapest,Hungary).
2.5.Benchmark dose modeling
Benchmark dose (BMD) modeling is now generally recognized for determining the point of departure for risk assessment[22].The BMD of hepatotoxicity caused by BV was calculated according to a previous study [23].Briefly,the number of pathological liver sections in mice with or without liver injury at each dose was manually counted as the input dataset.Then,the BMD of BV in the murine liver was calculated using the frequentist dichotomous hill model by the U.S.Environmental Protection Agency's (EPA's) benchmark dose software (BMDS,version 3.2) with 0.1 benchmark response(BMR) and a 95% confidence level [23].
2.6.Measurement of SFAs,MUFAs,PUFAs,triglycerides,total iron,and MDA concentration
50 mg liver tissue was taken from each mouse into a 1.5 mL centrifuge tube with 400 μL phosphate-buffered saline (PBS) for thorough grinding.The supernatant was diluted five times for subsequent measurements.The concentrations of SFAs,MUFAs,PUFAs,triglycerides,total iron,and MDA in each sample were individually measured using ELISA kits for SFAs,MUFAs,and PUFAs,and assay kits for triglycerides,total iron,and MDA.The optical density (OD) of each well in the microtiter plate was measured using a 2030 Multilabel Reader VICTOR™X5 from PerkinElmer(Waltham,MA,USA)at a detection wavelength of 450 nm for SFAs,MUFAs,and PUFAs,550 nm for triglycerides and total iron,and 531 nm for MDA.The relative concentration of each sample was calculated using a standard curve plotted against the OD values of the standard solution.
2.7.Liver single-cell isolation and sequencing
Mice were anesthetized using pentobarbital sodium and the livers were perfused using a two-step perfusion method through the portal vein.The pre-warmed first perfusion solution (ionized water containing 8 mg/mL NaCl,0.402 mg/mL KCl,0.094 mg/mL NaH2PO4·2H2O,0.2865 mg/mL Na2HPO4·12H2O,2.383 mg/mL HEPES,0.19 mg/mL EGTA,0.3528 mg/mL NaHCO3and 0.901 mg/mL glucose,pH=7.4) was perfused at a rate of 6 mL/min for approximately 8 min,followed by the perfusion of the pre-warmed second perfusion solution (Dulbecco's modified Eagle medium (DMEM)containing 0.6 mg/mL collagenase VI,0.1 mg/mL trypsin inhibitor,1 mg/mL DNase I,5 mg/mL BSA,5 mM CaCl2,pH=7.4)at a rate of 5 mL/min for 6 min.The perfused liver was subsequently dissected using forceps and dissociated with digestion solution (DMEM containing 5 mg/mL BSA and 5 mM ethylene diamine tetraacetic acid (EDTA)) for 10 min to obtain a single-cell suspension.Hepatocytes and non-parenchymal cells (NPCs) were separated by centrifugation at 50gfor 3 min.
For each group,equal amounts of the same type of cells from different mice were mixed.Dead cells in hepatocytes and nonparenchymal cells were removed separately using a Dead Cell Removal Kit(130-090-101,Miltenyi Biotec,Cologne,Germany)for higher sequencing quality.Hepatocytes and NPCs from each group were then mixed and subjected to a 10x Chromium Controller(10x Genomics,Pleasanton,CA,USA) to form single-cell Gel Bead-inemulsions (GEMs).Single-cell transcriptome libraries were constructed following the 10x Genomics protocol.
2.8.ScRNA-seq data analysis
Primary sequencing data were mapped to the mouse reference genome mm10 using the CellRanger software (version 7.0.0) to obtain expression matrices.Cells that 1) expressed less than 500 genes,2)had less than 500 unique molecular identifiers(UMIs),and 3) the ratio of mitochondrial transcripts to all transcripts detected was more than 50%were removed from the data for further analysis.Doublets were detected and removed using the R/Bioconductor package DoubletFinder (version 2.0.3) [24].Downstream analyses were performed using the Seurat (version 4.1.1) framework [25].Data from the two groups were integrated using 2,000 anchors filtered based on canonical correlation analysis (CCA) [26].Bias effects caused by the cell cycle were eliminated using the CellCycleScoring function.Genes with adjustedPvalue <0.05 and |log2(fold change)|>0.25 were identified as differentially expressed genes(DEGs).Clusters were then obtained without supervision and their identities were identified based on the DEGs.
2.9.Pseudotime analysis
The expression matrix and annotation for cell identity of all cells were extracted from the Seurat object for pseudotime analysis using previously reported Harmony[27]and Palantir[28].Diffusion maps and MAGIC imputation [29] were performed to obtain a continuous pseudo-time axis.A cell in Hepa1 was set as a starting point and in two directions,including one towards the control group and one towards the BV administration group.
2.10.Gene function enrichment analysis
The R/Bioconductor package ClusterProfiler (version 4.2.1) [30]was used to analyze the enrichment degree of biological processes and Kyoto Encyclopedia of Genes and Genomes(KEGG)pathways of the DEGs.All parameters were set to their default values.ThePvalue adjusted by Benjamin-Hochberg's method represents the degree of enrichment of each term.
2.11.Regulatory factors anticipation and visualization
Transcription factors(TFs)potentially regulating the DEGs were enriched using the Transcriptional Regulatory Relationships Unraveled by Sentence-based Text mining (TRRUST) database(https://www.grnpedia.org/trrust/).All TFs with aPvalue less than 0.05 were included as curated regulatory factors accounting for the changes in gene expression in hepatocytes.The regulatory network was constructed using the R/Bioconductor package,ggraph(version 2.0.6).
2.12.Cell-cell communication analysis
Three hepatocyte clusters and all non-parenchymal clusters from the normal control and administration groups were analyzed separately for inter-cell communication using the R/Bioconductor package CellChat (version 1.5.0) [31].Overexpressed ligands and receptors were identified,and the data were projected onto a builtin protein-protein interaction network.The communication strengths between any two cell groups were then computed using computeCommunProb function with ‘population.size’ set as TRUE and ‘type’ set as ‘truncatedMean’.After filtering the communications by setting the minimum number of cells in each cell group to five,the communication probability of the signaling pathway was computed.The number of interaction links was counted by the aggregateNet function with the threshold ofPvalue set as 0.05.
2.13.Statistical analysis
All quantification values were expressed as mean ± standard error of the mean (SEM).Differences between groups were analyzed using the Student'st-test or the Wilcoxon rank-sum test in R,and a threshold ofPvalue <0.05 was considered statistically significant.
3.Results and discussion
3.1.The subtle hepatotoxicity caused by low-dose BV
The median lethal dose(LD50)of BV in rodents is 2,000 mg/kg,as predicted by the PROTOX-II oral toxicity model[32].To capture the early stage of BV-induced toxicity in the liver,we administered mice a gradient dose of BV from extremely low (12.5 mg/kg) to medium (800 mg/kg) for 7 days.One day after the last administration,the liver index (percentage of liver weight in total body weight) and two serum biochemical indices (ALT and AST) closely associated with liver function in the clinical examination were identified.We found that low-dose(less than or at 200 mg/kg)BV did not affect all the above-mentioned indices,while significant increases in ALT and AST concentrations were observed at doses of 400 and 800 mg/kg,and a decreased liver index was observed at a dose of 800 mg/kg(Fig.1A).
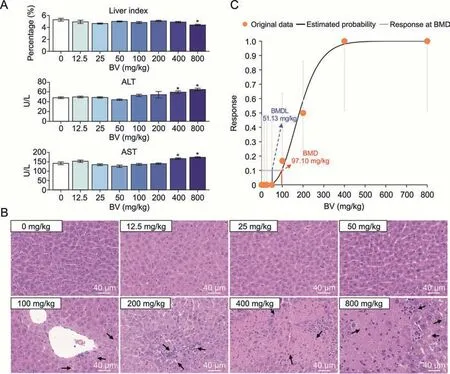
Fig.1.Evaluation of adverse effects of different doses of bavachin (BV) on the murine liver.(A) Changes of indices in mice liver induced by different doses of BV.The liver index representing the percentage of liver weight in body weight,and two serum biochemical indices including alanine aminotransferase (ALT) and aspartate aminotransferase (AST)concentrations in the blood are presented.*P <0.05 based on Student's t-test between control and BV-administered group.U/L representing the unit of enzyme activity per liter of liquid.(B)Hematoxylin-eosin-stained histochemical images of murine liver under different doses of BV.The black arrows indicate injury areas in the liver.(C) Frequentist gamma model with benchmark response of 10% extra risk for the benchmark dose (BMD) and 95% lower confidence limit for the BMD lower confidence limit (BMDL).
However,hematoxylin-eosin(HE)staining of the liver showed steatosis after 100 mg/kg BV administration,while necrosis with mild immune cell infiltration appeared after 200 mg/kg BV administration.The degree of the above adverse effects was further aggravated by massive hepatocyte death after administration of 400 mg/kg BV (Fig.1B).The proportion of livers with pathological changes increased from 16.7%at 100 mg/kg to 50%at 200 mg/kg,and reached 100% at 400 mg/kg (Table S1).The BMD has been proposed as a point of departure for establishing safe exposure limits for risk assessments [22].Taking the ratios of injured sections in all HE-stained sections as inputs,the BMD model showed that the minimum dose of BV causing hepatotoxicity was 97.10 mg/kg (Fig.1C).Therefore,the histologically observed cytotoxicity caused by BV at doses less than 400 mg/kg represents the early stage of hepatotoxicity,which was difficult to detect by routine clinical tests.Considering the appearance of severe injuries when BV is administered at higher doses,responses in hepatocytes themselves and signals from nonparenchymal cells may play a role in maintaining homeostasis at this early stage.
3.2.Single-cell atlas in healthy and BV-administered murine livers
To elucidate the molecular changes in the murine liver in response to low-dose BV administration,we performed scRNA-seq on liver cells isolated from mice that were treated with normal saline (healthy liver) and low-dose (200 mg/kg) BV for 7 days(Fig.2A).Overall,15,051 single-cell transcriptomes were obtained(Fig.2B),consisting of 7,863 from healthy livers and 7,188 from BVtreated livers.An average of 1,125 and 722 genes were detected for each cell in the two sets of data (Fig.S1).
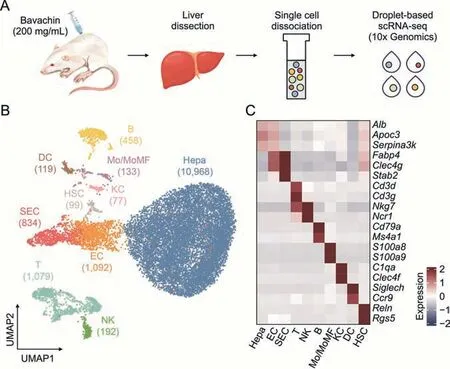
Fig.2.Decoding of lineages in healthy and bavachin (BV)-administered liver at the single-cell level.(A) Schematic of experimental design including cell dissociation and RNA sequencing.(B) Uniform manifold approximation and projection (UMAP) visualization of 15,051 cells in healthy and BV-administered livers.Cell numbers for distinct clusters are marked in parentheses.(C) Heatmap of representative marker genes for each cell type.The expressions of genes was scaled for presentation.Hepa: hepatocytes;EC: endothelial cells;SEC: sinusoidal endothelial cells;T:T cells;NK: natural killer cells;B:B cells;Mo/MoMF: monocyte or monocyte-derived macrophage;KC:Kupffer cells;DC: dendritic cells;HSC: hepatic stellate cells;scRNA-seq: single-cell RNA sequencing.
In detail,ten major liver cell types contributed by both healthy and BV-treated livers were identified based on their expression of corresponding marker genes (Figs.2B,2C,S2,and S3),including hepatocytes (Hepa) expressingAlb,apolipoprotein C3 (Apoc3) and serpin family A member 3 (Serpina3k),endothelial cells (EC) expressing fatty acid binding protein 4(Fabp4) and C-type lectin domain family 4 member G (Clec4g),sinusoidal endothelial cells (SEC) highly expressingFabp4,Clec4gand stabilin 2 (Stab2),T cells (T) expressing CD3 delta and gamma subunit of T-cell receptor complex (Cd3dandCd3g),natural killer cells (NK) expressing natural killer cell granule protein 7 (Nkg7) and natural cytotoxicity triggering receptor 1(Ncr1),B cells (B) expressingCd79aand membrane spanning 4-domains A1 (Ms4a1),monocyte or monocyte-derived macrophage (Mo/MoMF) expressing S100 calcium binding protein a8 and a9 (S100a8andS100a9),Kupffer cells (KC) expressing complement C1q A chain (C1qa) andClec4f,dendritic cells (DC)expressing sialic acid binding Ig-like lectin H (Siglech) and C-C motif chemokine receptor 9 (Ccr9),and hepatic stellate cells(HSC) highly expressing reelin (Reln) and regulator of G protein signaling 5 (Rgs5).
3.3.Alterations of molecular characteristics in BV-treated hepatocytes
Hepatocytes account for more than 60% of the total number of liver cells and are the main executors in the liver,performing vital functions in metabolism,detoxification,and immunity [33].Based on the critical role of hepatocytes and our observation that hepatocytes showed obvious morphological alterations (Fig.1B),we focused on the effects of BV on hepatocytes.A total of 197 and 154 upregulated and downregulated genes,respectively,were identified by differential gene expression analysis in BV-treated hepatocytes when compared with healthy hepatocytes (Fig.S4A).Functional enrichment analysis of DEGs revealed distinct functions related to these two sets of genes.The genes downregulated by BV treatment had enriched functions,including nucleotide,amino acid,and energy metabolism (Figs.S4B and C),indicating a disrupting effect of BV on the metabolic functions of hepatocytes.The upregulated genes tended to participate in more diverse functions,such as steroid and fatty acid metabolism,humoral immunity,hemostasis,and the peroxisome proliferator-activated receptors(PPAR)signaling pathway,implying that these hepatocytes were faced with lipid and immune stress (Figs.S4B and C).These results indicate multifaceted changes in hepatocytes following BV administration,which is consistent with previously reported adverse effects caused by BV[14,16,34,35]before the appearance of detectable clinical indices.
To more specifically depict the molecular alteration of hepatocytes induced by BV treatment without the interference of cells irrelevant to hepatotoxicity,hepatocytes were subdivided into three clusters,namely Hepa1,Hepa2,and Hepa3,and were visualized using force-directed layouts.Hepa1 was considered a mixed group of healthy and BV-treated hepatocytes,while almost all Hepa2 were healthy hepatocytes and most Hepa3 were BV-induced hepatocytes (Figs.3A,3B,and S5).Harmony [27] and Palantir [28]were used to create a bifurcation model for physiological and pathological features.The most marginal cell in Hepa1 was chosen as the start cell,and two transition directions were found,one from Hepa1 to Hepa2 and the other from Hepa1 to Hepa3 (Figs.3B and C).In this context,the axis towards Hpea2 represented the physiological part,and the axis towards Hepa3 represented the pathological development after BV administration.Hepa2 and Hepa3 both appeared at the end of the pseudotime,but Hepa3 showed a relatively higher pseudotime (Figs.3C and D).The cell cycle phase prediction showed no obvious differences among the three subpopulations,suggesting that BV did not affect the cell cycle status of hepatocytes(Fig.S6).
The majority of DEGs in Hepa1 cells were involved in metabolic processes,which was consistent with the basic function of hepatocytes (Fig.S7).Since Hepa2 and Hepa3 were mostly contributed by hepatocytes from BV-treated and control livers,respectively,we focused on the functional differences between Hepa1 and Hepa2.Differential expression analysis identified 165 and 345 DEGs in Hepa2 and Hepa3,respectively (Fig.3E).Generally,similar to the findings above,the DEGs in Hepa2 were mainly enriched in functions related to energy metabolism and nucleotide metabolism (Figs.3F and G).In contrast,the expression of genes related to immunity and hemostasis was significantly upregulated in Hepa3,includingFga,Fgb,andFggencoding fibrinogen alpha,beta,and gamma chains;Serping1andSerpinf2encoding highly glycosylated plasma proteins G1 and F2,Kng1andKng2encoding kininogen 1 and 2,C3encoding complement C3,Wfdc21encoding WAP four-disulfide core domain 21,B2mencoding beta-2-microglobulin,and six cytochrome P450 proteins(Fig.S8).Fibrinogen,expressed primarily in hepatocytes,can be converted to fibrin,which stabilizes blood clots,promotes hemostasis,and contributes to inflammation [36].Highly glycosylated plasma proteins and complement C3 are involved in the regulation of complement cascade-mediated immune and inflammatory responses [37].Furthermore,high-molecular-weight kininogens are essential for blood coagulation and assembly of the kallikrein-kinin system[38,39].Together,the inflammation in the liver caused by low-dose BV administration (Fig.1B) stimulated the activation of the coagulation and complement systems by upregulation of proteins,which mainly participated in hemostasis and complement and coagulation cascades.This upregulation of immune features within hepatocytes positively indicated that immune cells might exert a specific influence on hepatocytes,whether as a part of hepatotoxicity induced by BV or as a resistance of the liver against the adverse effects of BV.Additionally,five genes involved in ferroptosis were also upregulated in Hepa3(Fig.3H),includingCp(ceruloplasmin),Trf(transferrin),Acsl1/5(long-chain acyl-CoA synthetase 1 and 5),and1300017J02Rik,indicating disturbed iron homeostasis and a potential trend towards ferroptosis caused by BV.
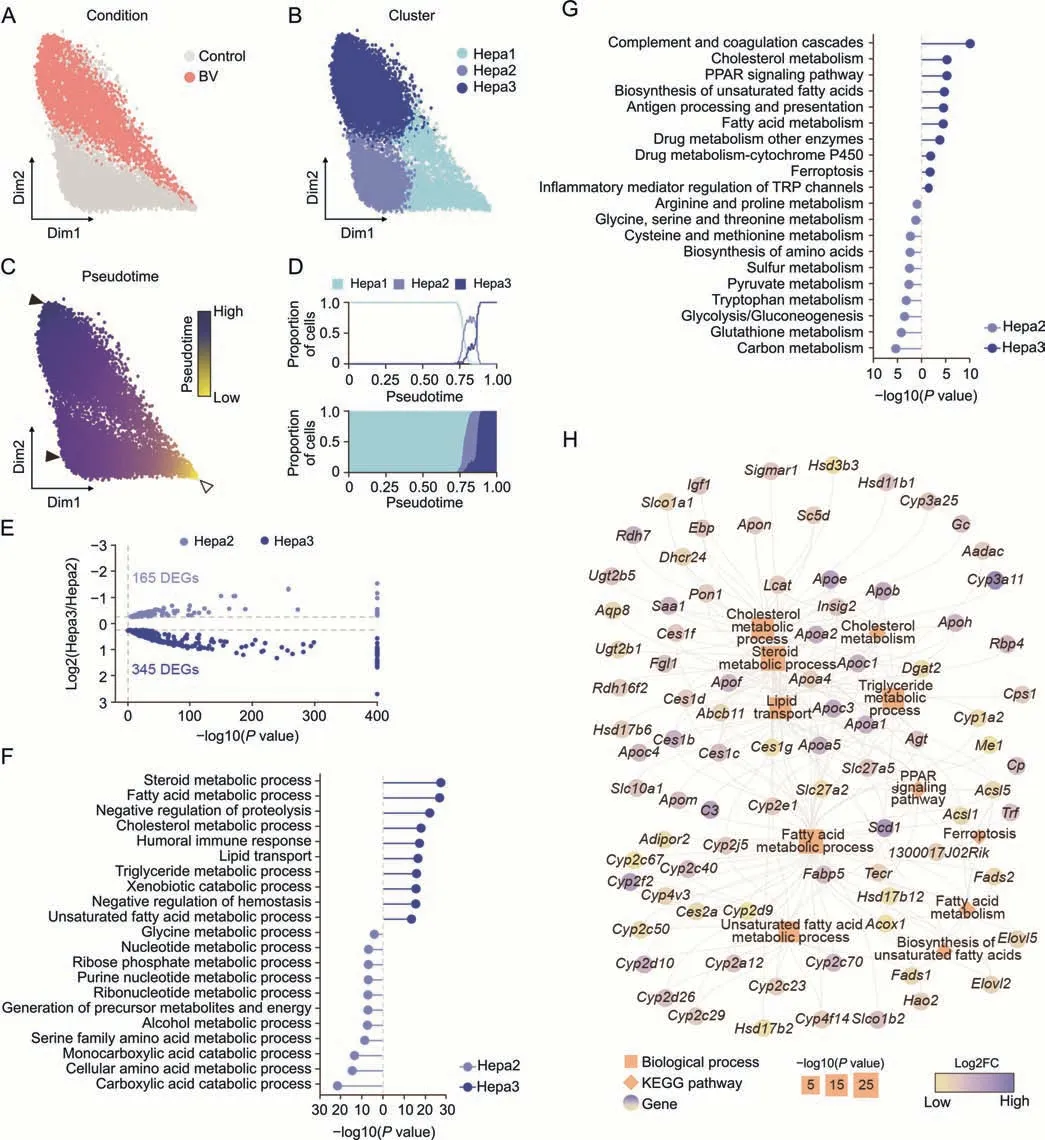
Fig.3.Bavachin (BV)-induced feature alteration in hepatocytes.(A-C) Force-directed graph showing hepatocytes (Hepa) colored by condition (A),subpopulation (B),and pseudotime(C).The start cell and terminal states are indicated by hollow and solid arrowheads in Fig.3C,respectively.(D)Proportion of the three subpopulations along the pseudotime.(E)Volcano plot for differentially expressed genes(DEGs)between Hepa2 and Hepa3.(F,G)Enriched terms of biological process(F)and Kyoto Encyclopedia of Genes and Genomes(KEGG) pathway (G) of DEGs in Hepa2 (blue) and Hepa3 (dark blue).(H) DEGs involved in enriched functions related to lipid homeostasis in Hepa3.Orange squares: biological processes;orange diamonds:KEGG pathways.The sizes of the squares and diamonds represent the degree of enrichment.Genes are indicated by the fold changes(FC)in expression levels between Hepa3 and Hepa2.PPAR: peroxisome proliferator-activated receptors;TRP: transient receptor potential.
Importantly,DEGs in Hepa3 tended to be involved in many metabolic pathways of lipids,such as the metabolism of fatty acids,steroids,cholesterol,and triglycerides,lipid transport,and the PPAR signaling pathway(Figs.3F and G).Specifically,18 members of the cytochrome P450 family,13 apolipoproteins,and six carboxylesterases were highly expressed in Hepa3(Fig.3H).These results,together with histological observations,indicate that dysregulation of lipid homeostasis is one of the main characteristics of hepatocytes under BV-induced hepatotoxicity at an early stage.
3.4.Hub function of Scd1 in the response of hepatocytes to BV
Both histopathological data and functional enrichment analysis suggested that dysregulated lipid metabolism was the core course of hepatotoxicity following BV exposure (Figs.1B,3F and 3G).To reveal which highly expressed DEGs caused hepatic steatosis following low-dose BV administration,we further surveyed the genes involved in pathways related to lipid homeostasis.Scd1,a gene encoding stearoyl-CoA desaturase 1,which is located in the ER,caught our attention because of its high expression in Hepa3 and its indispensable role in the process of liver steatosis [40].SCD1 catalyzes the transition from SFAs to MUFAs,including oleic acid and palmitoleic acid [41],the increase of which causes an increased triglyceride level and accumulation of lipids in hepatocytes,finally leading to hepatocyte steatosis [42-45].Suppression ofScd1showed inhibition of liver steatosis by regulating lipid metabolism [46,47].Consistent with the scRNA-seq data,the immunofluorescence and Western blot experiments demonstrated that the expression of SCD1 was upregulated in BV-treated hepatocytes (Figs.4A and S9A).Furthermore,there was a statistically significant increase in MUFAs concentration in the liver after BV treatment,while the concentration of SFAs and PUFAs (another production of SFAs) remained unchanged (Figs.4B and S9B).The concentration of triglycerides in the BV-induced liver also increased slightly (Fig.S9C),especially at 200 mg/kg BV.These results collectively indicate thatScd1plays an important role in lipid accumulation and steatosis in hepatocytes caused by lowdose BV administration (Fig.4C).

Fig.4.The molecular basis of response in hepatocytes(Hepa)to low-dose bavachin(BV).(A)Albumin(ALB)and stearoyl-CoA desaturase 1(SCD1)immunostaining in healthy and 200 mg/kg BV-induced murine livers.(B) The relative concentration of malondialdehyde (MDA),monounsaturated fatty acids (MUFA),polyunsaturated fatty acids (PUFA) and saturated fatty acids (SFA) in the livers of healthy and BV-administered mice.*P <0.05 based on the Student's t-test between the control and BV-administered group.(C) The schematic depicting the molecular changes and mechanism of steatosis in Hepa3 at the early stage of cytotoxicity induced by BV.DAPI: 40,6-diamidino-2-phenylindole.
In contrast,a recent study reported that BV induces ferroptosis via the STAT3/P53/SLC7A11 axis in osteosarcoma cells [17].Consistent with this finding,we observed significantly increased PUFAs and slightly increased MDA and total iron in the livers treated with 400 mg/kg and 800 mg/kg BV (Figs.S9B,D and E),indicating an increased potential for BV-induced ferroptosis caused by BV.Although genes indirectly related to ferroptosis were upregulated by Hepa3,no significant feature of ferroptosis was found in hepatocytes treated with 200 mg/kg BV (Fig.1B).This can be partially explained by the upregulation ofScd1.The promoted transition to MUFAs mediated by SCD1 prevented the increase in PUFAs,which would consequently reduce the possibility of ferroptosis,reflected by the downregulation of MDA levels (Figs.4B,S9B and S9D) [48,49].Additionally,the upregulated apolipoproteins in Hepa3 can also help reduce intracellular reactive oxygen species (ROS) and lipid peroxidation levels [50],thereby ensuring intracellular lipid levels.These results suggest that upregulation ofScd1and apolipoprotein-encoding genes might inhibit ferroptosis in hepatocytes exposed to low-dose BV.
Collectively,these data suggest that under low-dose BV administration,the upregulation ofScd1in hepatocytes promoted lipid accumulation and the process of hepatic steatosis.Simultaneously,highly expressedScd1prevented an increase in PUFAs,which further prevented the occurrence of ferroptosis.
3.5.Genes related to steatosis regulated by TFs in the early stage of hepatotoxicity induced by BV
TFs play vital roles in regulating the expression of genes involved in various functions.To clarify the TFs responsible for the molecular changes in the transcriptome of hepatocytes following low-dose BV administration,we performed regulatory factor enrichment using the TRRUST database [51].Among the 12 TFs screened,hepatocyte nuclear factor 1 and 4 alpha (Hnf1aandHnf4a) showed the most significant enrichment (Fig.5A).Given their vital functions in regulating the differentiation,metabolism,and proliferation of hepatocytes,the downregulation or mutation of these two factors is related to several pathological conditions,including epithelial-to-mesenchymal transition and non-alcoholic liver steatosis [52-54].In our dataset,Hnf4aandHnf1ashowed lower expression in Hepa3 than in Hepa2 and were predicted to regulate the expression ofApoa4andApoc3(Fig.5),which encode apolipoproteins involved in intrahepatic lipid metabolism and triglyceride homeostasis [55].Other apolipoprotein-encoding genes,includingApoe,Apoa1,andApoa5were predicted to be upregulated bySp1,Rora,Usf1,andUsf2,which also showed significantly different expressions in Hepa2 and Hepa3 (Fig.5B).
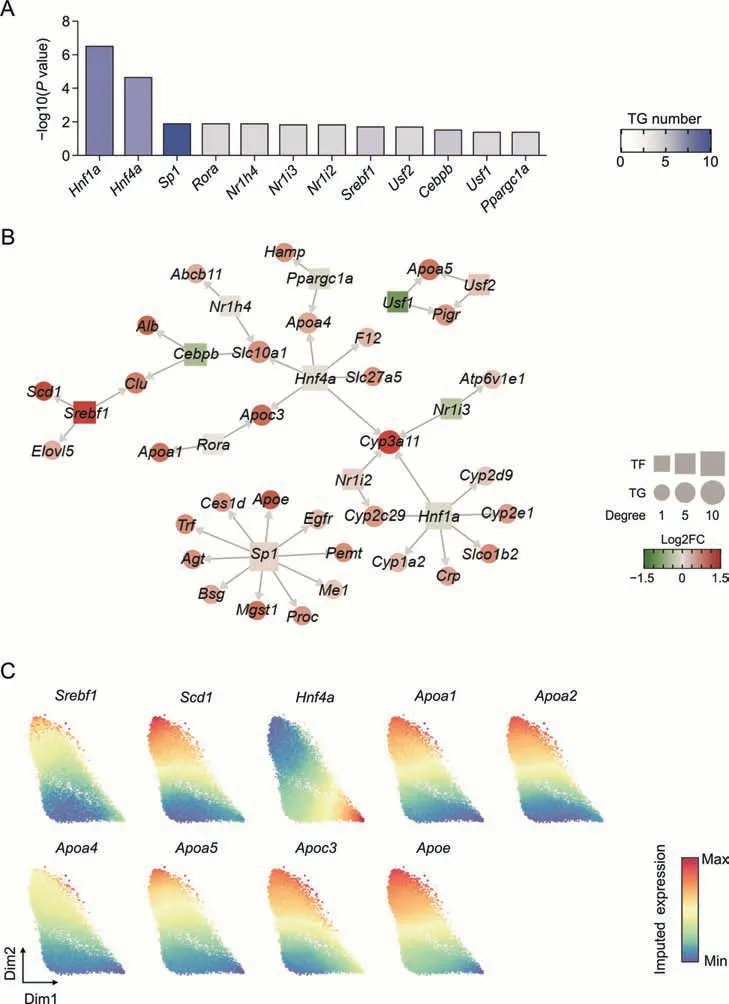
Fig.5.The gene expression regulation network in hepatocytes(Hepa)induced by low-dose bavachin(BV)treatment.(A)The degree of enrichment of each transcription factor(TF).The darker the blue color,the more target genes(TGs)are regulated by the TFs.(B)Gene regulation networks.TFs and TGs are squares and points colored by the fold changes(FC)of expression levels between Hepa3 and Hepa2.The sizes of the squares and points represent the connectivity degree.(C) Force-directed graphs for ferroptosis resistance-related genes colored by gene expression.Gene expressions were imputed by MAGIC algorithm.
Sterol regulatory element binding transcription factor 1 encoded bySrebf1was reported to activate the expression of genes involved in fatty acid and triglyceride synthesis and is upregulated in the livers of patients with non-alcoholic fatty acid liver disease [56,57].Consistent with these findings,the expression ofSrebf1in Hepa3 showed a dramatic increase compared to Hepa2,verifying the steatosis of hepatocytes caused by BV exposure (Fig.5C).Importantly,SREBF1 was predicted to positively regulate the expression ofScd1(Fig.5B),suggesting that lipogenesis by highly expressedScd1is mediated by upregulated SREBF1 [58-60].
Combining the expression of these two TFs and the expression of their target genes,it can be speculated that BV administration caused upregulation ofSrebf1and downregulation ofHnf4a,which subsequently led to altered expression of genes carrying specific functions and further induced steatosis of hepatocytes.
3.6.Niche cells may offer signals to regulate lipid metabolism in hepatocytes
To further understand the roles of NPCs in the changes of hepatocytes in response to BV administration,interaction analyses between NPCs and hepatocyte subpopulations in healthy and BV livers were separately performed.In healthy livers,most ligands received by hepatocytes were collagen-coding genes (Col1a1,Col1a2,Col4a1,Col4a2,Col6a1,Col6a2,Col6a3,Col6a5) from endothelial cells (EC and SEC) and HSC (Fig.S10A),consistent with previous reports that hepatocytes adhere to and are supported by the extracellular matrix(ECM),which is shared by EC and HSC[61].Other signals includedFn1,which encodes fibronectin and is involved in cell adhesion and migration processes,andThbs1/2,which encodes thrombospondin 1 and mediates cell-to-cell and cell-to-matrix interactions [62,63].These interactions collectively imply that the ECM is the main source of signals for hepatocytes under physiological conditions.
Significantly enhanced interactions between NPCs and hepatocyte subpopulations were observed when BV was administered(Fig.6A),most of which were come-in signals for hepatocyte subpopulations,indicating a strong and relatively specific effect of BV on the hepatocytes.Interestingly,a significant enhancement inTnr-Sdc4interaction was detected between NPCs and hepatocyte subpopulations,especially Hepa3 (Figs.6A and B).Tenascin-R,encoded byTnr,is principally expressed in the nervous system and regulates the adhesion and growth of target cells [64].The expression ofTnrwas up-regulated after different types of damage in the mammalian central venous system[65-67].Syndecan 4,encoded bySdc4,forms a connection between the ECM and intracellular signaling cascades,thereby provoking many pathways that affect cell proliferation,adhesion,migration,and survival [68-71].Based on these previous findings,the relatively stronger enhancement ofTnr-Sdc4interaction,which represented a stronger tenascin signal received by Hepa3,and the unexpected upregulation ofTnrexpression in T,B,NK,and SEC clusters strongly indicated that tenascin signaling from immune cells and sinusoidal endothelial cells might play an important regulatory role in the response of hepatocytes to BV administration (Figs.6B-D).Recently,overexpression ofSdc4in hepatocytes was reported to reduce liver steatosis by regulating lipid metabolism [72].Therefore,the significantly higher expression ofSdc4in Hepa3 than in Hepa2 (Fig.S10B) indicated that hepatocytes might upregulate the expression ofSdc4to receive signals from niche cells and alleviate the lipid accumulation caused by BV exposure.
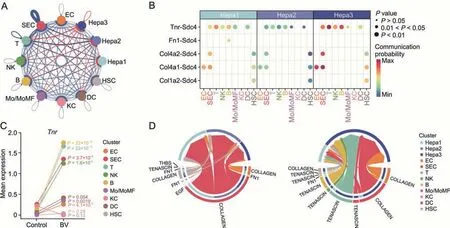
Fig.6.Tenascin signals received by hepatocytes were up-regulated with bavachin(BV)treatment.(A)Summary of changes of interaction strength among all clusters in BV-treated liver.The thickness of the edges indicates the strength of the corresponding interactions while the colors of the edges indicate whether the interactions were up-regulated(red)or down-regulated (blue).(B) Communication probability of significant ligand-receptor pairs where the ligands were expressed in non-parenchymal clusters and the receptors were expressed in hepatocyte clusters after BV treatment.Permutation test was applied for the significance of inter-cellular interactions predicted.(C) Mean expressions of Tnr in nonparenchymal clusters with or without BV treatment.P values were calculated based on the Wilcoxon rank-sum test between the control and BV-administered group.(D)Circle plots showing signals enriched by the ligand-receptor pairs displayed in Fig.6B.In each circle,sources of the signals are drawn at the bottom and receptors are drawn at the top.The colors of the circles indicate distinct clusters and the colors of the links indicate individual signals.Hepa: hepatocytes;EC:endothelial cells;SEC: sinusoidal endothelial cells;T:T cells;NK: natural killer cells;B: B cells;Mo/MoMF: monocyte or monocytederived macrophage;KC: Kupffer cells;DC: dendritic cells;HSC: hepatic stellate cells.
4.Conclusions
In this study,we exposed mice to BV for 7 days without generating any biochemical test abnormalities and deciphered the landscape of gene expression in hepatocytes at single-cell resolution in response to BV insult before the advent of overt acute hepatic injury.We demonstrated that elevatedScd1and obvious alterations in lipid metabolism were the core components of cellular responses to BV before the advent of acute hepatocyte injuries.The upregulation ofScd1in these hepatocytes,which is potentially regulated by TFs includingSrebf1andHnf4a,facilitated the generation of MUFAs,which on the one hand caused lipid accumulation and hepatocyte steatosis,and on the other hand,possibly suppressed the course of ferroptosis.At the same time,tenascin signals from nonparenchymal cells (immune cells including NK/T/B cells and sinusoidal endothelial cells) were received by up-regulatedSdc4in hepatocytes,which might regulate downstream pathways in response to BV treatment.In summary,this study captured the response of hepatocytes to low-dose BV treatment,described the molecular mechanisms therein,and screened outScd1as a candidate for the early prediction of BV-induced hepatotoxicity,all of which would contribute to the monitoring and prevention of liver injuries induced by BV-containing TCM formula.
CRediT author statement
Pan Shen:Investigation,Visualization,Formal analysis,Writing-Original draft preparation;Zhi-jie Bai: Methodology,Formal analysis,Writing -Original draft preparation;Lei Zhou: Data curation,Validation;Ning-ning Wang: Data curation,Validation;Zhe-xin Ni:Investigation;De-zhi Sun:Formal analysis;Cong-shu Huang: Data curation;Yang-yi Hu: Formal analysis;Cheng-rong Xiao: Investigation;Wei Zhou: Supervision,Writing -Reviewing and Editing;Bo-li Zhang: Supervision;Yue Gao: Conceptualization,Project administration,Funding acquisition.
Data availability
Single-cell RNA-seq data were deposited in the GEO database under accession number GSE216336.
Declaration of competing interest
The authors declare that there are no conflicts of interest.
Acknowledgments
This work was supported by the National Natural Science Foundation of China(Grant Nos.:82192910 and 82192911)and the Innovation Team and Talents Cultivation Program of the National Administration of Traditional Chinese Medicine (Grant No.:ZYYCXTD-D-202207).
Appendix A.Supplementary data
Supplementary data to this article can be found online at https://doi.org/10.1016/j.jpha.2023.03.010.
杂志排行
Journal of Pharmaceutical Analysis的其它文章
- Preface for Special Issue: Single-Cell and Spatially Resolved Omics
- Single-cell transcriptome analysis reveals the regulatory effects of artesunate on splenic immune cells in polymicrobial sepsis
- The role of signaling crosstalk of microglia in hippocampus on progression of ageing and Alzheimer's disease
- Discovering metabolic vulnerability using spatially resolved metabolomics for antitumor small molecule-drug conjugates development as a precise cancer therapy strategy
- Single-cell analysis of cellular heterogeneity and interactions in the ischemia-reperfusion injured mouse intestine
- Cux1+ proliferative basal cells promote epidermal hyperplasia in chronic dry skin disease identified by single-cell RNA transcriptomics
