Sports compression garments improve resting markers of venous return and muscle blood flow in male basketball players
2023-08-02ShneRiornRoMGregorShonHlsonDviBishopJmesBroth
Shne F.O’Riorn *,Ro MGregor ,Shon L.Hlson ,Dvi J.Bishop ,Jmes R.Broth,b
a Institute for Health and Sport(iHeS),Victoria University,Footscray,VIC 3011,Australia
b Department of Physiology,Australian Institute of Sport,Bruce,ACT 2617,Australia
c Faculty of Health,University of Canberra,Bruce,ACT 2617,Australia
d School of Behavioural and Health Sciences,Australian Catholic University,Banyo,QLD 4014,Australia
Abstract Background:The benefits associated with sports compression garments are thought to be closely related to enhanced blood flow.However,findings are equivocal,possibly due to heterogeneity in the techniques used for measuring blood flow,the garment types used,and the pressures applied.This study combined Doppler ultrasound and near-infrared spectroscopy technologies to provide the first comprehensive assessment of the effects of 3 sports compression garment types on markers of venous return and muscle blood flow at rest.Methods: Resting lower-limb blood flow measures (markers of venous return,muscle blood flow,and muscle oxygenation) of 22 elite,junior,male basketball players(age=17.2±0.9 years,mean±SD)were assessed in 4 separate conditions:no compression(CON),compression tights(TIGHTS),compression shorts (SHORTS),and compression socks (SOCKS).Markers of venous return (cross-sectional area,time-averaged mean and peak blood flow velocity,and venous blood flow)were measured via Doppler ultrasound at the popliteal and common femoral veins.Muscle blood flow and muscle oxygenation were measured in the gastrocnemius medialis and vastus lateralis using near-infrared spectroscopy.Results:Popliteal markers of venous return were higher in TIGHTS compared to CON(p<0.01)and SHORTS(p<0.01),with SOCKS values higher compared with CON (p<0.05).Common femoral vein markers of venous return were higher for all conditions compared to CON(p<0.05),with TIGHTS values also higher compared to SOCKS (p<0.05).Gastrocnemius medialis blood flow was higher for TIGHTS compared to CON (p=0.000),SOCKS (p=0.012),and SHORTS (p=0.000),with SOCKS higher compared to SHORTS (p=0.046).Vastus lateralis blood flow was higher for TIGHTS compared to CON(p=0.028)and SOCKS(p=0.019),with SHORTS also higher compared to CON(p=0.012) and SOCKS (p=0.005).Gastrocnemius medialis oxygenation was higher for TIGHTS compared to CON (p=0.003),SOCKS(p=0.033),and SHORTS(p=0.003),with SOCKS higher compared to CON(p=0.044)and SHORTS(p=0.032).Vastus lateralis oxygenation was higher for TIGHTS compared to CON(p=0.020)and SOCKS(p=0.006).Conclusion:Markers of venous return,muscle blood flow,and muscle oxygenation are increased with sports compression garments.TIGHTS are most effective,potentially because of the larger body area compressed.
Keywords: Arterial perfusion;Lower-limb compression;Pressure;Venous flow
1.Introduction
Sports compression garments are commonly used in an attempt to improve exercise performance and recovery.1However,the underlying mechanisms of action have yet to be established,and a better understanding will help to optimize the use of compression as an ergogenic aid.The compressioninduced benefits are thought to be closely related to alterations in blood flow,consistent with that reported in therapeutic medicine.2-4Medical compression garments,which apply a higher level of pressure than sports compression garments,5decrease vein diameter,improve valve competence,and reduce venous reflux.6As a result,blood is diverted from superficial veins,through perforator veins,and into deep veins,leading to an increase in deep venous velocity,reduced venous pooling,and improved venous return.2,3The mechanisms by which compression improves arterial and/or muscle blood flow is less clear.Due to the thick-walled structure of the arterioles,compression-induced changes in arterial blood flow are not related to a mechanical reduction in arteriole vessel size.7Instead,compression is commonly proposed to reduce arteriolar transmural pressure,resulting in a reflex increase in arteriole vessel size (i.e.,vasodilation).7,8This myogenic response7will lead to a decrease in arterial flow resistance and subsequently improve muscle blood flow.7,9Other mechanisms underlying the compressioninduced increased muscle blood flow could be a result of venular-arteriolar communication and/or skin vasomotor reflexes;7however,these mechanisms remain speculative.Alterations in blood flow with compression have been reported primarily in individuals with circulatory issues who were using high-pressure medical compression (>30 mmHg);4however,there are few available data concerning the effect of sports compression on venous and muscle blood flow in healthy or athletic individuals.
Research assessing changes in blood flow with the use of sports compression garments have reported increases,9,10no effects,11,12or even decreases13in various measures of blood flow.A potential explanation for these contradictory findings is the large heterogeneity in the techniques used in measuring blood flow.For instance,alterations in muscle oxygenation,limb volume,stroke volume,cardiac output,blood pressure,and heart rate have all been used as indirect markers of compression-induced changes to blood flow.9,14-16Although these measures provide important information regarding circulatory and cardiac parameters,the use of more direct measurement techniques for assessing venous return and muscle blood flow is warranted.Doppler ultrasound,regarded as a criterion standard,17provides reliable and real-time information about venous structure and flow in the lower extremities.18,19However,Doppler ultrasound has yet to be used in sports compression research to assess markers of venous return.Similarly,very few studies have investigated the effects of sports compression on muscle blood flow.9,12,20Although commonly used as an indicator of muscle oxygenation and/or overall limb blood volume,11,21near-infrared spectroscopy(NIRS)with venous occlusion can also provide a noninvasive and reliable measurement of localized(i.e.,muscle)blood flow.22Previous research has used this technique to measure the effects of sports compression on muscle blood flow during exercise.9,12,20Our study combines Doppler ultrasound and NIRS (with venous occlusion) technologies to provide a holistic assessment of the effects of sports compression garments on resting markers of venous return and muscle blood flow.
Another important gap in the literature is that no study has directly assessed the effects of garment characteristics (i.e.,pressure and type)on blood flow.The level of pressure and the gradient distribution (i.e.,the difference between 2 points) applied to the limbs,and the body area compressed(e.g.,calf,thigh,leg,arm,or upper body),have varied in available sports compression research to date,23and pressure values are often not reported.24This is a crucial omission because pressure and gradient distribution are considered critical for the garments’ effectiveness.5,25Sports compression garment-sizing guidelines are typically acquired from crude anthropometric measurements,such as height,mass,and limb circumference.In addition,large variations exist in these measurements,with ranges varying by up to 40 cm for height,25 kg for mass,and 7 cm for calf circumference for the same garment size (2XU,Melbourne,Australia).These nonspecific guidelines can result in compression that elicits pressures less than the minimum suggested to improve venous return (thigh: 15 mmHg;calf: 17.3 mmHg).23,25Therefore,sports compression garments fitted to target pressure ranges previously shown to alter blood flow measures9,25,26or to enhance exercise performance and recovery,9,27,28as opposed to manufacturers’ guidelines,may provide greater insight into full understanding of the underlying mechanisms associated with the beneficial effects of sports compression garments.Furthermore,despite the range of sports compression garment types available (e.g.,socks,shorts,and tights),no study has directly compared the effects of sports compression garment type on resting lower-limb bloodflow measures.Compression-induced changes in lowerlimb blood flow might differ among garment types because garments apply pressure only to the limb and the underlying blood vessels they are covering (e.g.,compression socks apply pressure to the lower-leg only).Insight from compression-induced changes in blood flow away from(markers of venous return) and to the muscle may have important implications during recovery postexercise,when athletes are typically resting after competition or training.
We aimed to elucidate the potential reasons for equivocal findings in the efficacy of sports compression garments in altering blood flow by addressing measurement techniques,garment types,and the level of pressure applied.The aim of our study,therefore,was to assess for the first time the influence of various sports compression garments,when fitted to target pressures,on markers of venous return and muscle blood flow.We hypothesized that sports compression garments would alter measures of blood flow.In addition,we further hypothesized that these alterations would be dependent on the type of sports compression garment used due to differences in the total area of the lower limb exposed to compression.
2.Materials and methods
2.1.Participants
Twenty-two elite,junior,male basketball players from the Australian Centre of Excellence Men’s Basketball and National Basketball Association Global Academy teams(age=17.2±0.9 years,height=199.8±9.3 cm,body mass=90.0±9.9 kg;mean±SD)completed our study.This sample size was powered to detect a moderate difference in calf blood flow with and without compression (d=0.65),21with an a value of 0.05 and 80% statistical power (G*Power Version 3.1.9.2;Universität Düsseldorf,Düsseldorf,Germany).Written informed consent was obtained prior to participation,and all participants were screened for cardiovascular risk factors associated with exercise and specific risk factors associated with blood flow,including blood pressure,peripheral arterial disease,and diabetes.All procedures were approved by the Victoria University Human Research Ethics Committee (HRE18-087).The experimental approach was a randomized controlled study with a within-subject crossover design in which all participants completed the testing protocol under 4 conditions: (1) a nongarment control (CON),(2)compression socks (SOCKS),(3) compression shorts(SHORTS),and(4)compression tights(TIGHTS).
2.2.Overview
Participants reported to the laboratory on 2 separate occasions.The first session familiarized them with the Doppler ultrasound and venous occlusion techniques.The pressure of each sports compression garment(SOCKS,SHORTS,and TIGHTS)was also measured.Approximately 48 h after the familiarization session,participants reported to the laboratory for the experimental session.The trial was set up during an initial 10 min of supine rest that included fitting the NIRS oximeters,locating and marking the Doppler ultrasound sites,and collecting a fingertip capillary blood sample.Participants were assigned to one of the 4 conditions(CON,SOCKS,SHORTS,or TIGHTS) in a randomized order.With 4 conditions,there were 24 possible condition orders.Once a participant was randomly assigned to one of the 24 different condition orders,that condition order was not available for other participants.This process was repeated until all 22 participants had been assigned their condition order.Following 5 min of supine rest,markers of venous return,muscle blood flow,and muscle oxygenation measures were collected while participants were in a supine position.This process was repeated 3 additional times (i.e.,4 conditions in total),with 5 min of supine rest between conditions,as previously described.11,21A supine position was chosen because it closely replicates the recovery position performed following exercise.Participants arrived at the laboratory following an overnight fast(>8 h)and were asked to refrain from strenuous exercise(<24 h)and caffeine(<12 h)prior to testing sessions.
2.3.Sports compression garments
A total of 3 different types of sports compression garments were tested;SOCKS (Recovery Compression Socks;2XU),SHORTS (Accelerate Compression Shorts;2XU),and TIGHTS(Refresh Recovery Tights;2XU).The pressure of the sports compression garments was measured via the Kikuhime pressure monitor device(MedGroup EBI,Melbourne,Australia)which is created by BioRender (https://biorender.com/),at 6 different landmarks along the leg (Fig.1).29The desired target pressures were 23-32 mmHg at Landmark C and 12-17 mmHg at Landmark E.These target pressures were chosen because they have previously been shown either to alter blood flow9,25,26or to have resulted in enhanced exercise performance or recovery.9,27,28The pressure exerted at each landmark was measured in both standing and supine positions,as previously described.29In the event that target pressure was not achieved in the supine position with manufacturer’s sizing guidelines(height and body mass),another sports compression garment size was tested until the desired pressure was achieved.TIGHTS was fitted according to manufacturer’s guidelines because pilot data showed that it was not possible to achieve these target pressures simultaneously on both Landmark C and Landmark E.As a result,target pressure in TIGHTS was not achieved at Landmark C for 19 participants nor was it achieved at Landmark E for 3 participants.
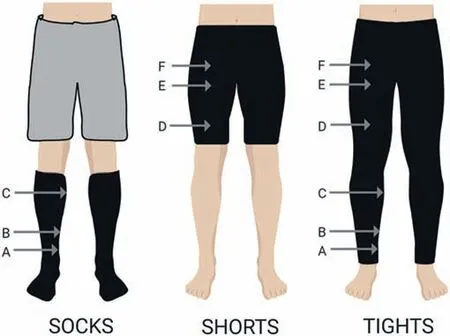
Fig.1.Landmarks where garment pressures were measured for SOCKS(A-C),SHORTS(D-F),and TIGHTS(A-F).A:5 cm proximal to the distal border of the medial malleolus;B: 5 cm proximal to A;C: medial aspect of the maximal calf circumference;D: anterior aspect of the thigh 10 cm below landmark E;E: midpoint between the inguinal crease and the superior-posterior border of the patella;and F: 5 cm proximal to Landmark E.SHORTS=compression shorts; SOCKS=compression socks;TIGHTS=compression tights.
2.4.Venous return
Markers of venous return were measured at the popliteal and common femoral veins via Doppler ultrasound.The ultrasound examinations were performed using an Aplio 500(Canon Corporation,Tokyo,Japan),with a 5-14 MHz linear transducer and venous presets.A single experienced sonographer performed flow studies in a temperature-controlled(20 °C) environment after 5 min of rest.All measurements were obtained when the participants were in a supine position.Transverse and longitudinal images of the popliteal and common femoral veins were obtained using copious gel and minimal transducer pressure to avoid vein compression for each sports compression garment and control condition.The measurements of inner vessel transverse cross-sectional area(CSA (cm2)),time-averaged mean blood flow velocity(Vmean(cm/s)),and time-averaged peak blood-flow velocity(Vpeak(cm/s)) were obtained for each participant.Previous research has reported that the coefficient of variation for these measures,when conducted by an experienced sonographer,is 4.8%±1.3%.30Angles of insonation between 55° and 60°between the transducer and the vessels were used to obtain appropriate color and spectral Doppler signals.Spectral Doppler waveforms were recorded in longitudinal image acquisition from a large sampling volume that included the whole-vessel diameter.Manual venous blood flow (mL/min)was calculated as (CSA (mm2)×Vmean(cm/s))×60/100.31The common femoral veins were examined 2 cm above the saphenofemoral junction,with sports compression garments(TIGHTS and SHORTS) turned down slightly to gain access.The popliteal veins were examined at the level of the knee crease.Prior to participants’ wearing TIGHTS in the experimental session,a small incision was made in the garment at the knee crease to create a window for the transducer to access the popliteal vein.Pilot data confirmed that the pressure of TIGHTS was not altered by the small incision.
2.5.Muscle blood flow and oxygenation
Muscle blood flow and muscle oxygenation were assessed in the lower-leg muscles while participants were in a supine position by using NIRS.This technique provides continuous,noninvasive measurement of concentration changes in oxyhemoglobin(O2Hb) and deoxyhemoglobin (HHb).Oximeters at the gastrocnemius medialis (calf) and vastus lateralis (thigh) muscles were set up as previously described.9,20Pilot data confirmed that the pressure was not altered by the oximeter placement under the garment.Muscle oxygenation was calculated via the tissue saturation index(expressed as a percentage and calculated as[O2Hb]/([O2Hb]+[HHb])×100.32Muscle blood flow was assessed using multiple venous occlusions,as previously described.9Blood flow into the muscle,presented as milliliters of blood per minute,per 100 grams of muscle tissue(mL/min/100 g),9was estimated from the following equation:
where the slope of the rise in total hemoglobin (tHb=O2Hb+HHb) was measured during three 20-s venous occlusions separated by 45 s of rest.20A single capillary blood sample(approximately 100 μL) was obtained from the participants’ fingertip and immediately analyzed (OSM-3 Hemoximeter;Blood Gas Analyser,Radiometer,Copenhagen,Denmark)to measure relative hemoglobin concentration in g/dL.A conversion factor of 0.6206 was used to calculate absolute hemoglobin concentration([Hb],mmol/L).9,22Venous occlusions were performed immediately following markers of venous return measures for each condition,with the average of the 3 occlusions (coefficient of variation:12.1%±7.3%)used for data analysis.
2.6.Statistical analyses
Data are presented as mean ± SD and were analyzed using IBM SPSS Statistics (Version 19.0;IBM Corp.,Chicago,IL,USA).A one-way repeated measures analysis of variance(ANOVA)was used to analyze markers of venous return,muscle blood flow,and muscle oxygenation.Normality of distribution was confirmed using the Shapiro-Wilk test.For validation of repeated measurements,the Mauchly sphericity test was used,and the Greenhouse-Geisser correction was applied if necessary.Where significant condition effects were observed,a Fisher LSDpost hocanalysis was used.Differences in sports compression garments’ pressure values between garment types and postures were analyzed using one-way ANOVA.Significance was set atp<0.05.Data in the Results section are expressed as the percentage of change relative to the comparative compression garment.To complement the statistical testing,effect sizes(ESs)were calculated to assess the magnitude of observed condition effects in markers of venous return,muscle blood flow,and muscle oxygenation.All ESs were log-transformed before analysis,and the magnitudes of effects were determined by standardization of the log-transformed variable.The Cohen conventions for ESs (with 95% confidence intervals) were used for interpretation.ES values were defined as small (0.20-0.49),medium(0.50-0.79),or large(≥0.80),33and were reported only when there was a ≥75% likelihood of the effects being equal to or greater than the smallest worthwhile change(ES=0.20).
3.Results
3.1.Markers of venous return
3.1.1.Popliteal CSA
No condition effect was detected for popliteal CSA(p=0.134;ES=0.33±0.34) (CONvs.TIGHTS) (Fig.2A and Supplementary Table 1).

Table 1 Pressure profiles of each sports compression garment in the supine and standing positions(mean±SD).
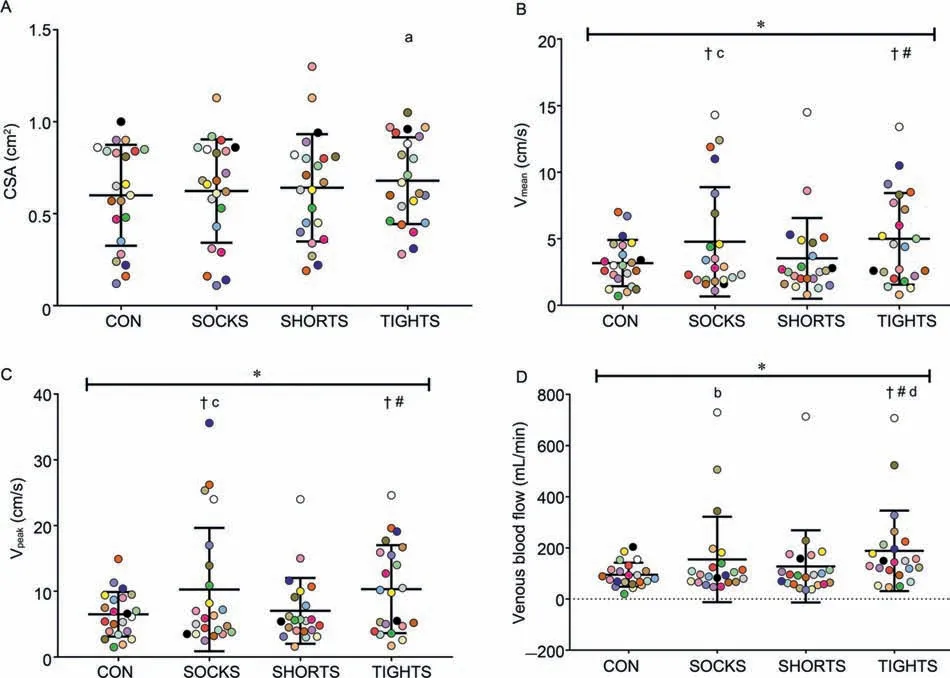
Fig.2.Popliteal vein markers of venous return for each sports compression garment condition.Markers measured include(A)CSA,(B)Vmean,(C)Vpeak,and(D)venous blood flow.Bars are the mean ± SD.Individual colored data points indicate individual participants.*p<0.05,significant condition effect;#p<0.01,significant effect compared to SHORTS;†p<0.05,significant effect compared to CON.a Small effect compared to CON;b Medium effect compared to CON;c Small effect compared to SHORTS;d Medium effect compared to SOCKS.CON=no compression;CSA=cross-sectional area;SHORTS=compression shorts;SOCKS=compression socks;TIGHTS=compression tights;Vmean=mean flow velocity;Vpeak=peak flow velocity.
3.1.2.Popliteal Vmean
There was a condition effect for popliteal Vmean(p=0.014),with Vmeanincreased in TIGHTS as compared with CON(57.3%±90.1%,p=0.007;ES=0.58±0.42) and SHORTS(41.5%±67.7%,p=0.009;ES=0.53±0.39).In addition,popliteal Vmeanwas increased in SOCKS as compared with CON(50.4%±109.5%,p=0.042;ES=0.43±0.56),but was not significantly different in SOCKS as compared with SHORTS (35.3%±93.8%,p=0.092;ES=0.38±0.48)(Fig.2B and Supplementary Table 1).
3.1.3.Popliteal Vpeak
There was a condition effect for popliteal Vpeak(p=0.008),with Vpeakincreased in TIGHTS as compared with CON(58.9%±84.4%,p=0.004;ES=0.62±0.42) and SHORTS(47.2%±64.5%,p=0.003;ES=0.55±0.38).In addition,popliteal Vpeakwas increased in SOCKS as compared with CON(57.9%±122.5%,p=0.038;ES=0.46±0.58),but was not significantly different in SOCKS as compared with SHORTS(46.2%±112.0%,p=0.067;ES=0.40±0.50) (Fig.2C and Supplementary Table 1).
3.1.4.Popliteal venous blood flow
There was a condition effect for popliteal venous blood flow(p=0.013),with increases in TIGHTS as compared with CON(98.6% ± 161.7%,p=0.009;ES=1.06±0.56) and SHORTS(47.9%±77.5%,p=0.009;ES=0.82±0.56).Popliteal venous blood flow was not significantly different in TIGHTS compared with SOCKS (21.7%±85.5%,p=0.246;ES=0.51±0.69) or in SOCKS compared with CON (63.1%±176.8%,p=0.109;ES=0.55±0.74)(Fig.2D and Supplementary Table 1).
3.1.5.Femoral CSA
No condition effect was detected for femoral CSA(p=0.807)(Fig.3A and Supplementary Table 1).
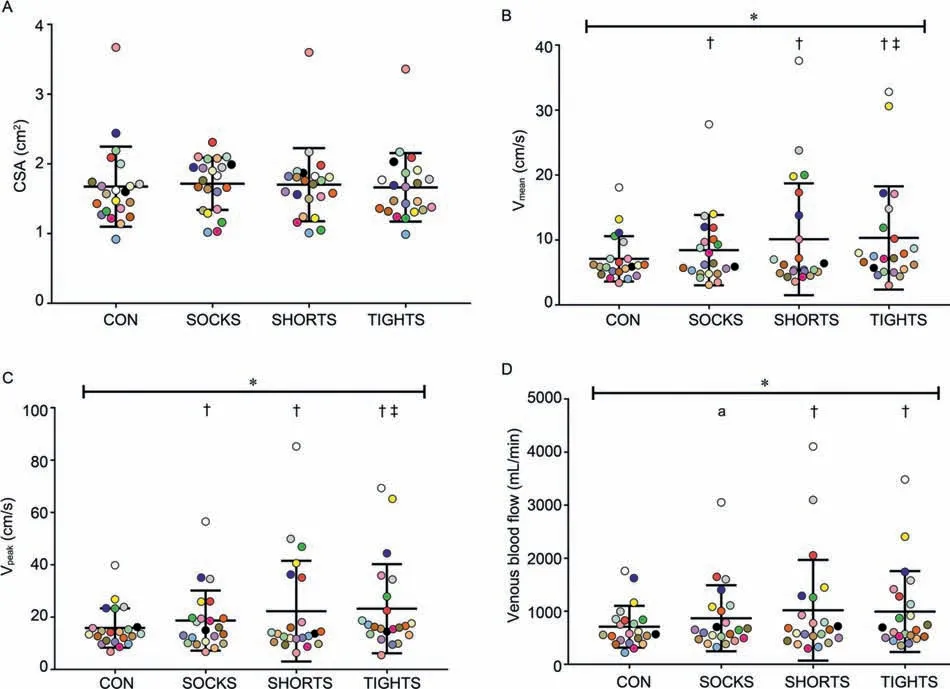
Fig.3.Common femoral vein markers of venous return for each sports compression garment condition.Markers measured include(A)CSA,(B)Vmean,(C)Vpeak,and(D)venous blood flow.Bars are the mean±SD.Individual coloured data points indicate individual participants.*p<0.05,significant condition effect;†p<0.05,significant effect compared with CON;‡p<0.05,significant effect compared with SOCKS.a Small effect compared with CON;b Medium effect compared with CON.CON=no compression;CSA=cross-sectional area;SHORTS=compression shorts;SOCKS=compression socks;TIGHTS=compression tights;Vmean=mean flow velocity;Vpeak=peak flow velocity.
3.1.6.Femoral Vmean
There was a condition effect for femoral Vmean(p=0.007),with increased Vmeanin TIGHTS when compared with CON(45.4%±69.4%,p=0.006;ES=0.63 ±0.35) and SOCKS (22.4% ±48.3%,p=0.042;ES=0.35±0.32).In addition,femoral Vmeanwas increased in SOCKS (18.8%±39.2%,p=0.035;ES=0.28±0.34) and SHORTS (42.4%±78.5%,p=0.019;ES=0.47±0.37) as compared with CON(Fig.3B and Supplementary Table 1).
3.1.7.Femoral Vpeak
3.1.8.Femoral venous blood flow
There was a condition effect for femoral venous blood flow(p=0.033),with femoral venous blood flow increased in TIGHTS(40.3%±65.2%,p=0.009;ES=0.51±0.30) and SHORTS(43.9%±97.6%,p=0.047;ES=0.43±0.34)as compared with CON.Femoral venous blood flow was not significantly different in SOCKS when compared with CON(22.6% ±53.2%,p=0.060;ES=0.31±0.31(Fig.3D and Supplementary Table 1).
3.2.Muscle blood flow
3.2.1.Calf muscle blood flow
There was a condition effect for calf muscle blood flow(p=0.000).Specifically,calf muscle blood flow was increased in TIGHTS as compared with all other conditions (CON: 82.4%±80.6%,p=0.000;ES=1.34±0.53;SOCKS: 35.4%±60.0%,p=0.012;ES=0.78±0.51;SHORTS: 73.9%±72.1%,p=0.000;ES=1.24±0.45) and when SOCKS was compared with SHORTS (28.4%±62.8%,p=0.046;ES=0.46±0.43).Calf muscle blood flow was not significantly different in SOCKS when compared with CON (34.7%±82.4%,p=0.062;ES=0.56±0.59)(Fig.4 and Supplementary Table 1).
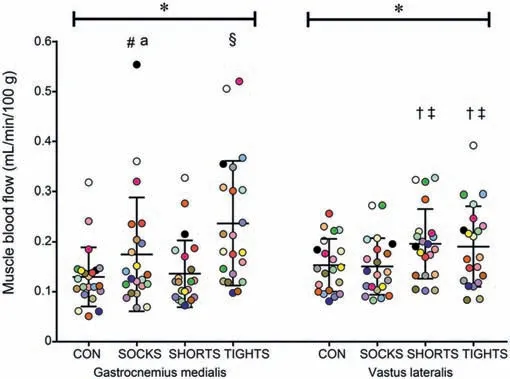
Fig.4.Muscle blood flow (mL/min/100 g) to the gastrocnemius medialis(calf)and vastus lateralis(thigh)muscles for the CON and sports compression garment conditions (SOCKS,SHORTS,and TIGHTS).Bars are the mean ±SD.Individual colored data points indicate individual participants.*p<0.01,significant condition effect;#p<0.05,significant effect compared with SHORTS;†p<0.05,significant effect compared with CON;‡p<0.05,significant effect compared with SOCKS;§p<0.05,significant effect compared with all other conditions.a Medium effect compared with CON.CON=no compression;CSA=cross-sectional area;SHORTS=compression shorts;SOCKS=compression socks;TIGHTS=compression tights.
3.2.2.Thigh muscle blood flow
There was a condition effect for thigh muscle blood flow(p=0.001),with thigh muscle blood flow increased in TIGHTS as compared with CON (24.4%±47.3%,p=0.028;ES=0.54 ±0.51)and SOCKS(26.5%±47.3%,p=0.019;ES=0.61±0.59).In addition,thigh muscle blood flow was increased when SHORTS was compared with CON (28.0%±46.3%,p=0.012;ES=0.70±0.54) and SOCKS (30.1%±43.2%,p=0.005;ES=0.76±0.55)(Fig.4 and Supplementary Table 1).
3.3.Muscle oxygenation
3.3.1.Calf muscle oxygenation
When I first started driving a cab, Park Avenue was mostly a bunch of coal yards. Hoofer s Brewery4 was right next to where the Waldorf-Astoria is now. I did pretty well, even in those days.
There was a condition effect for calf muscle oxygenation(p=0.002).Specifically,calf muscle oxygenation was increased in TIGHTS as compared with all other conditions (CON: 3.0%±4.2%,p=0.003;ES=0.55±0.33;SOCKS: 1.6%±3.0%,p=0.033;ES=0.29±0.26;SHORTS:3.1%±4.0%,p=0.003;ES=0.57±0.35).Calf muscle oxygenation was also increased in SOCKS as compared with CON (1.4%±3.0%,p=0.044;ES=0.26±0.25) and SHORTS (1.5%±3.0%,p=0.032;ES=0.28±0.25)(Fig.5 and Supplementary Table 1).
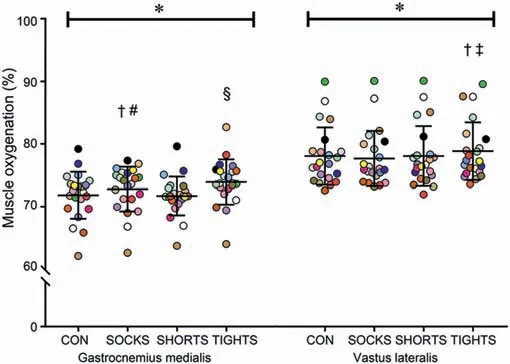
Fig.5.Muscle oxygenation (%) of the gastrocnemius medialis (calf) and vastus lateralis (thigh) muscles for the CON and sports compression garment conditions(SOCKS,SHORTS,and TIGHTS).Bars are the mean±SD.Individual colored data points indicate individual participants.*p<0.01,significant condition effect;#p<0.05,significant effect as compared with SHORTS;†p<0.05,significant effect as compared with CON;‡p<0.05,significant effect as compared with SOCKS;§p<0.05,significant effect as compared with all other conditions.CON=no compression;CSA=crosssectional area;SHORTS=compression shorts;SOCKS=compression socks;TIGHTS=compression tights.
3.3.2.Thigh muscle oxygenation
There was a condition effect for thigh muscle oxygenation(p=0.009),with thigh muscle oxygenation increased in TIGHTS as compared with CON (1.0%±1.8%,p=0.020;ES=0.18±0.15) and SOCKS (1.5%±2.0%,p=0.006;ES=0.26±0.18)(Fig.5 and Supplementary Table 1).
3.4.Pressure profiles
A supine posture resulted in lower pressures at Landmarks B through F for all garments,as compared with standing (p<0.05).In addition,pressure readings at Landmarks A,B,and C were increased for SOCKS as compared with TIGHTS (p<0.05),irrespective of posture (Table 1).
4.Discussion
This study provides the first comprehensive assessment of the effects of different sports compression garment types on markers of venous return and muscle blood flow.The main findings were that lower-limb sports compression garments,fitted to target pressures (SOCKS and SHORTS) and worn according to manufacturers’ guidelines (TIGHTS),increased resting markers of venous return and muscle blood flow.Additionally,the increase in muscle blood flow with SOCKS and TIGHTS was coupled with an increase in muscle oxygenation.When comparing garments,TIGHTS elicited the greatest enhancement in resting blood flow measures of the lower limbs.Taken together,these results support the notion that sports compression garments are effective in improving markers of venous return and muscle blood flow and are most pronounced in garments covering the whole leg(i.e.,compression tights).
A novel component of this study was the use of Doppler ultrasound to determine the effect of sports compression garments on markers of venous return.This technique,which is the criterion standard for measuring venous structure and flow,17has yet to be used in studies related to sports compression garments.The current study is,therefore,the first to compare the effects of different sports compression garment types on markers of venous return,including venous blood velocity and venous blood flow,with all 3 compression garments having a positive effect on these markers.The changes in venous blood flow occurred with limited changes in the deep venous cross-sectional area,suggesting that the increase in venous blood flow observed with sports compression is a result primarily of increased mean flow velocity.This may result from compression of the superficial venous system,thereby shunting blood into the deep venous system and increasing blood volume for the skeletal muscle pump to eject.4
The positive effects observed in our study are supported by previous research reporting compression-induced increases in similar markers of venous return in healthy individuals with medical compression,as measured by Doppler ultrasound.25,26,34However,1 study reported no effect of medical compression on the same markers of venous return.35Potential explanations for these differing results include the manner in which ultrasound measurements were collected(i.e.,supinevs.standing)as well as the level of pressure being applied to the limb.Standing requires the contraction of postural muscles,which may reduce the influence of compression due to muscle contraction (i.e.,skeletal muscle pump).29In a study by Stein et al.,35the levels of pressure applied,when standing,at the calf (14 mmHg) and midthigh (10 mmHg) were considerably lower than those measured forTIGHTS in our study(standing values:21 mmHg and 16 mmHg,respectively).However,the pressure values reported in Stein et al.35were based on manufacturer’s guidelines only (i.e.,not directly measured),highlighting that measuring compression pressure is essential when determining the effectiveness of compression garments in altering blood flow.Notably,the pressure exerted by sports compression garments in our study (calf:~29 mmHg;thigh:~13 mmHg)is comparable to the level achieved in previous studies (calf:~26 mmHg;thigh:~12 mmHg) that showed compression-induced changes in markers of venous return25,26,34and/or muscle blood flow.3,9,10,20
Our study is the first to compare various sports compression garment types on muscle blood flow,and the results identified TIGHTS as the most effective garment for improving resting muscle blood flow in the calf and thigh musculature.In support of the proposed mechanisms for muscle blood flow (i.e.,myogenic response,venule-arteriolar communication,and skin vasomotor reflexes7),all compression garments increased muscle blood flow in the underlying musculature.For example,TIGHTS improved calf and thigh muscle blood flow,whereas SOCKS (calf only) and SHORTS (thigh only) increased muscle blood flow in the compressed muscle only.Similarly,compression was previously reported to increase muscle blood flow (as measured by venous occlusion with NIRS) in the thigh with compression tights9and in the calf with compression socks20but to have no effect on thigh muscle blood flow with compression socks.12Thus,our study’s results support the notion that TIGHTS may be the most appropriate garment for improving resting blood flow in the entire lower limb,which may have implications for recovery from exercise that incorporates large lower-body muscle recruitment (e.g.,running,jumping,resistance exercise).
By combining Doppler ultrasound and NIRS with venous occlusion to measure compression-induced changes in blood flow,our study provides novel evidence that enhanced markers of venous return are coupled with an increase in muscle blood flow.The observed increases in muscle blood flow may be associated with the parallel increase in venous return.Increased venous return causes venous pressure to decrease,36which may consequently enhance muscle blood flow via increases in the arteriovenous pressure gradient.37In addition,greater venous return with compression may lower heart rate9and cardiovascular stress via improved stroke volume,cardiac output,and heart rate variability,38subsequently leading to enhanced muscle blood flow.In support of this,TIGHTS were the most effective compression garment for increasing both markers of venous return and muscle blood flow of the entire lower limb (i.e.,in the popliteal and common femoral veins and in the calf and thigh muscles).The enhanced markers of venous return with TIGHTS likely contributed to the greater compression-induced increases in muscle blood flow with TIGHTS.Although SOCKS and SHORTS were beneficial in enhancing markers of venous return in the popliteal and common femoral veins,respectively,ours is the first study to find that TIGHTS were more effective in enhancing these markers.Furthermore,the concurrent increase in muscle blood flow may lead to improved blood flow in the capillary bed and,therefore,increase the amount of oxygen delivered to the muscle.
The association between greater muscle blood flow and enhanced muscle oxygenation was evident in our study.Increased muscle blood flow to the calf and thigh musculature in TIGHTS was coupled with enhanced muscle oxygenation.Similarly,enhanced muscle blood flow to the calf with SOCKS resulted in improved muscle oxygenation.These results are in agreement with previous studies showing that compression enhanced muscle oxygenation at rest,with reduced venous pooling (i.e.,increased venous return) and increased muscle blood flow also evident.7,21Conversely,muscle oxygenation was not improved at the thigh with SHORTS,despite increased muscle blood flow.The level of pressure exerted by SHORTS (~13 mmHg) may not have been sufficient to enhance muscle oxygenation because compression is frequently reported to enhance muscle oxygenation with exerted garment pressures >13 mmHg20,39or garments covering the entire lower limb.40,41The higher level of pressure with SOCKS (~29 mmHg) and greater surface area covered with TIGHTS may help to explain the increased muscle oxygenation with SOCKS and TIGHTS only.However,the exact mechanism of this lack of enhanced muscle oxygenation with SHORTS remains unclear because no other study has investigated the effect of compression shorts on muscle oxygenation.Ours is the first study to identify TIGHTS as the most effective garment for enhancing muscle oxygenation to the lower limb (i.e.,thigh and calf musculature).This is likely due to the greater effect of TIGHTS on markers of venous return and muscle blood flow in the lower limb compared to the other garment types.
When comparing pressure by garment,TIGHTS had a lower pressure than SOCKS at all landmarks on the lower leg(i.e.,Landmarks A,B,and C)(Fig.1).However,TIGHTS was superior at increasing popliteal markers of venous return(Fig.2),calf blood flow (Fig.4),and oxygenation (Fig.5).A potential explanation for this is that the surface area of the lower limb compressed by TIGHTS is greater than that of SOCKS (i.e.,entire lower limbvs.lower leg),thus compressing more superficial veins and increasing venous return.These findings are supported by Benkö et al.,34who reported stockings covering the entire lower limb were more effective in improving venous return compared with stockings covering the lower leg only.In our cohort of elite male junior basketball players,manufacturer’s sizing guidelines were appropriate for providing sufficient pressure to improve blood flow measures,particularly in the TIGHTS condition.The interface pressure changes observed with posture changes(Table 1) are attributed to the muscles’ contraction upon standing,29which is supported by the lack of difference in pressure observed between postures at the ankle (i.e.,Landmark A).In general,manufacturers’ sizing guidelines were appropriate for achieving the target pressures for SOCKS and SHORTS.However,caution is advised in regard to sizing because some participants (SOCKS:n=3;SHORTS:n=4)did require a sports compression garment 1 size smaller than the manufacturer’s recommended size in order to achieve target pressures.For TIGHTS,the use of manufacturer’s guidelines achieved simultaneous target pressures at Landmarks C and E in only 3 participants.Considering that the level of pressure applied is critical for the effectiveness of sports compression garments,25these data highlight the importance of garment type as well as posture,when prescribing sports compression garments.
Research to date investigating sports compression garments have often failed to report a pressure profile,24whereas the studies that have reported it have commonly measured pressure only at the calf and midthigh.10,42The pressure differences between these 2 sites create the impression of a graduated profile (decreasing pressure values from distal to proximal)in TIGHTS.However,the use of additional pressure landmarks (Fig.1) shows that compression applied to the upper leg(SHORTS and TIGHTS)is graduated in nature,with no graduated profile for the lower leg (Table 1).Similar to findings by Brophy-Williams et al.,29SOCKS and TIGHTS exerted a higher interface pressure at maximal calf girth(Landmark C) than at the lower leg (Landmark B) and upper ankle (Landmark A),creating a progressive (increasing pressure from distal to proximal) pressure gradient6in the lower leg.Traditionally,a graduated profile is recommended for effective compression treatment due to regular distal pooling of blood and fluid as a result of gravity in clinical populations.2,36However,young athletic populations are less likely to suffer from venous issues that result in pooling around the ankles (e.g.,chronic venous insufficiency,deep vein thrombosis,etc.).In addition,in our study,markers of venous return were collected in the supine position,potentially limiting any pooling in the ankles that may occur when standing or in seated postures.Increased pressure applied to the muscle belly has previously been shown to enhance venous pump function,6which is similar to the observations in our study.A potential explanation for this is that higher blood volumes will pool at the muscle belly(i.e.,the calf musculature)compared with the distal parts of the leg (i.e.,the ankle).6Thus,to maximize the effect of sports compression garments on skeletal muscle pump function and venous return,the highest level of external pressure should be applied to the underlying musculature.
5.Conclusion
Compression tights were the most effective garment for increasing markers of venous return and muscle blood flow in the lower limbs at rest,although compression shorts and compression socks also had positive effects.These improvements in blood flow were coupled with an improvement in muscle oxygenation for compression tights and socks.Manufacturers’ guidelines were appropriate for most participants in exerting pressures required to alter measures of blood flow.Therefore,sports compression garments may be a practical intervention for enhancing markers of venous return and muscle blood flow in the lower limbs while at rest.
Acknowledgments
The authors acknowledge the Australian Centre of Excellence Men’s Basketball and National Basketball Association Global Academy Team athletes and support/coaching staff for their involvement in this study.
Authors’contributions
SFO designed the study,collected the data,performed the statistical analysis,interpreted the data,and drafted the manuscript;JRB designed the study,performed the statistical analysis,interpreted the data,and drafted the manuscript;SLH designed the study,interpreted the data,and critically revised the manuscript;DJB designed the study,interpreted the data,and critically revised the manuscript;RM collected the data.All authors have read and approved the final version of the manuscript,and agree with the order of presentation of the authors.
Competing interests
SFO,JRB,SLH,and DJB received a research grant from compression manufacturer 2XU (Melbourne,Australia),which also supported SFO and JRB.RM was externally sourced to conduct ultrasound measurement and has no conflict of interest.2XU had no input into the study design,the collection and analysis of data,the writing of the manuscript,or the decision to submit the article for publication.None of the authors has any financial or other interest in the production and/or distribution of 2XU products.
Supplementary materials
Supplementary materials associated with this article can be found in the online version at doi:10.1016/j.jshs.2021.07.010.
杂志排行
Journal of Sport and Health Science的其它文章
- Exercise and quality of life in cancer
- The good,the bad,and the ugly of consumer sleep technologies use among athletes:A call for action
- Author biographies of EIC’s choice
- Feasibility of the 2-point method to determine the load-velocity relationship variables during the countermovement jump exercise
- Indirect contact matters:Mid-flight external trunk perturbation increased unilateral anterior cruciate ligament loading variables during jump-landings
- Eccentric exercise-induced muscle weakness abolishes sex differences in fatigability during sustained submaximal isometric contractions
