In-plane and out-of-plane quasi-static compression performance enhancement of 3D printed re-entrant diamond auxetic metamaterial with geometrical tuning and fiber reinforcement
2023-07-31NirnjnChikknnShnkrKrishnpilliVelmurugnRmchndrn
Nirnjn Chikknn ,Shnkr Krishnpilli ,Velmurugn Rmchndrn
a Department of Mechanical Engineering, Indian Institute of Technology Madras, 600036, India
b Department of Aerospace Engineering, Indian Institute of Technology Madras, 600036, India
Keywords:Auxeticity Fibre reinforcement Tailorability Anisotropy Geometrical influence Property enhancement
ABSTRACT Auxetic materials are cellular materials with a unique property of negative Poisson's ratio.The auxeticity and performance of these metamaterials utterly depend on the geometrical parameters and loading direction.For the first time,the quasi-static uniaxial compression performance of fused filament fabricated re-entrant diamond auxetic metamaterial is evaluated in the x-direction(in-plane)and z-direction(out-of-plane).The most commonly used thermoplastic feedstock,Acrylonitrile butadiene styrene,is considered a material of choice.The effect of influential geometrical parameters of the re-entrant diamond structure and printing parameter is systematically studied using Taguchi's design of experiments.Grey-based multi-objective optimisation technique has been adopted to arrive at the optimal structure.Efforts are made to improve the stiffness and strength of the structure with fibre reinforcements.Micro glass fibre reinforcements have enhanced specific strength and stiffness in both in-plane and out-ofplane directions.A sevenfold and thirteen times increase in specific strength and energy absorption is evident for glass fibre-reinforced structures in out-of-plane directions compared to in-plane ones.Proper tuning of geometrical parameters of the re-entrant diamond structure can result in a Poisson's ratio of up to -3.49 when tested in the x-direction.The parametric study has illustrated the tailorability of the structure according to the application requirements.The statistical study has signified each considered parameter's contribution to the compression performance characteristics of the 3D printed re-entrant diamond auxetic metamaterial.
1.Introduction
Auxetics are non-conventional structures with a negative Poisson's ratio (NPR).Auxetics expand in the transverse and/or thickness direction when stretched longitudinally and shrinks when compressed perpendicularly.This unique behaviour of auxetics has resulted in a feature that the materials can concentrate under compression with substantially improved load resistance [1].The auxetic behaviour of structures has improved several remarkable properties,including hardness [2],blast resistance [3],shear strength and strain [4],energy absorption [5],indentation and impact resistance[6].NPR metamaterials have gained pronounced attention in recent years due to their exceptional properties and the high application potential in different areas,including defence [7],medical[8],engineering[9,10],bio-medical[11],and sports[12]are few.
Generally,the performance of the cellular materials dramatically depends on the structure's geometry.Zied et al.[13] have modified the re-entrant structure to enhance the in-plane stiffness and confirm the effect of rib length and thickness on the in-plane moduli numerically.To know the parametric effects on dynamic performance and bearing capacity of re-entrant honeycomb,Zhang et al.[14]have performed numerical and experimental studies and confirmed the parametric influence.Khoshravan et al.[15] have studied the impact of cell size and cell wall thickness on the compression performance of honeycomb core and obtained improved compressive strength with increased cell wall thickness and decreased cell size.Scarpa et al.[16] have performed finite element analysis on re-entrant honeycomb to realise the effect of cell aspect ratio,re-entrant angle,and relative thickness and found dependency of mechanical properties over a range of geometrical parameters.Zhang et al.[17] have confirmed the dependence of dynamic compressive properties on the auxetic honeycombs' reentrant angle and aspect ratio.
The cellular structures are generally anisotropic [18],and their mechanical performance depends on the loading direction.Most two-dimensional cellular structures are weaker in the in-plane direction than the out-of-plane (transverse) direction [19].Even the mechanical behaviour of the cellular structures in two in-plane directions is significantly different [20].Wei et al.[21] have confirmed that the energy absorption capacity of star-triangular honeycomb in thex-direction is much higher than in they-direction.Zhang et al.[22]have investigated the post-yield behaviour of re-entrant hexagonal honeycombs in tension and reported Poisson's ratio dependency on the loading direction.Khan et al.[23]have conducted in-plane and out-of-plane crushing experiments for aluminium honeycomb and found various mechanical properties in all three directions.The authors confirmed the honeycomb's significantly high crushing strength and elastic modulus in the transverse direction compared to the other two in-plane directions.Lu et al.[24] explained the large plastic deformation and folding mechanism during the axisymmetric crushing of the thin-walled tubes by revisiting the Alexander theoretical model.Alomarah et al.[25] have performed experimental and numerical investigations on the compressive performance of 3D printed auxetic structures and demonstrated anisotropic compressive performance.
Currently,processing these complicated cellular geometries via conventional manufacturing methods is not a feasible option.3D printing has relieved the exertion of fabricating complex geometries [26].Recent improvements in 3D printing techniques have further advanced our ability to manipulate the structure to modulate the magnitude of the Poisson's ratio from positive to negative [27].Fused filament fabrication (FFF) is a material extrusion additive manufacturing/3D printing process where the thermoplastic polymer filament is melt-deposited layer-wise according to the specified geometrical requirements [28].FFF is the most commonly used,low-cost,reliable 3D printing technique with comprehensive material options to process.There are examples of realising nanocomposites [29],short fibre-reinforced composites[30],continuous fibre-reinforced composites [31] and metals [32]via FFF.FFF can effortlessly be used to process intricate 2D cellular geometries.Zhang et al.[33]have studied the large deformation of a 3D printed metal and polymer auxetic structure in tension.Ingrole et al.[34] have fabricated honeycomb,re-entrant honeycomb,locally reinforced auxetic-strut structure and hybrid structure using FFF and comparatively studied the in-plane uniaxial compression behaviour.Pandaa et al.[35] have demonstrated the fabrication capabilities of the cellular honeycomb structures using FFF and studied the design parameters' effect on the mechanical properties of cellular structures.Vyavahare et al.[36]have printed auxetic re-entrant structures via FFF and examined them under compressive performance.Zhang et al.[37]have reviewed the large deformation and energy absorption characteristics of additively manufactured auxetic structures and described the association of energy absorption on the deformation mechanism and forcedisplacement relationships.
The existing literature confirms that the performance of cellular material dramatically depends on the geometrical parameters and loading direction.FFF printing parameters can also significantly influence the printability and performance of these complicated structures.Our previously developed re-entrant diamond auxetic metamaterial has better specific energy absorption compared to the regular re-entrant structure of the same relative density [38].Our other study also demonstrates the tailorability,and performance enhancement for the particular application needs through geometry tuning for re-entrant diamond auxetic metamaterial inydirection compression [39].Thex-direction and transverse direction compressive performance of the re-entrant diamond auxetic metamaterial has not been studied and needs to be explored to understand the behaviour for practical applications.The current study evaluates the quasi-static compression performance of the re-entrant diamond auxetic metamaterial enabled via FFF in inplane (x) and transverse (z) directions for the first time.The influence of geometrical parameters and the most influential printing parameter on the re-entrant diamond auxetic metamaterial performance has been systematically studied using Design of Experiments (DoE).The multi-objective optimisation technique was adopted to have a combined best performance in thex-direction,and transverse directional properties are evaluated for optimised structure.In the current study,efforts are made to enhance specific properties through carbon and glass microfibers reinforcements.
2.Materials and methodology
2.1.Materials and fabrication
Most commonly used Acrylonitrile butadiene styrene(ABS),10%chopped carbon fibre (CF),and glass fibre (GF) reinforced ABS filaments were procured from 3DXTech (USA).Procured filaments were dried for 8 h at 85°C in a convective oven(Industrial Heaters,India).The current study adopts Taguchi's design of experiments(DoE) method to evaluate the mechanical performance of the reentrant diamond metamaterial.The suitable Taguchi's L9 orthogonal array for four factors at three levels has been considered[40-42] and is given in Table 1.The most influential geometrical parameters,re-entrant angle (θ1),diamond angle (θ2),cell wall thickness to length(t/l)ratio,and FFF process parameter layer thickness (h) were chosen as independent input parameters (factors)and few are illustrated in Fig.1.

Fig.1.Geometrical parameters of the re-entrant diamond auxetic unit cell.
A minimum number of nine cells are required to eliminate the size effect during compression [18,36,43-45].The least out-ofplane thickness of 15 mm is essential to avoid out-of-plane displacements during the in-plane compression[46].Thus the out-ofplane thickness of 20 mm [39] is adopted in our study,and the adoption was also validated using preliminary tests where no outof-plane displacements were observed.Computer-aided 3D models were designed following the design matrix in Table 1.Developed models were tessellated using commercially available Slic3r slicing software and generated G-codes.Generated G-code has been fed to CoLiDo X3045 FFF single nozzle printer with a motion accuracy of 0.2 mm.The FFF process parameters are tweaked to fabricate these complicated structures before printing and are given in Table 2.

Table 2 FFF process parameters.
Each sample at a time was printed concerning the design matrixin random order,and two samples per configuration were considered to establish repeatability.The angled diamond outer walls of the regular re-entrant diamond structure only at the compressive ends initially become flat (horizontal) due to local stress concentration as expressed in Fig.4 (point 0),and the expected global deformation picks up hereafter in uniaxial compression.The initial deformation of the wall changes the direction of the stress-strain curve marked as point (1) in Figs.3 and 4,forcing us to consider the localised effect as the strength of the metamaterial,thus undervaluing the structure's performance.The structure was modified to test in thex-direction to eliminate the localised effect.Fig.2(b) shows the modified re-entrant diamond structure forxdirection compression performance evaluation;however,thezdirection compression samples remain unchanged with a 3×3 cell size with the same sample thickness of 20 mm,as shown in Fig.2(a).

Fig.2.(a) Regular and (b) modified re-entrant diamond structure.

Fig.3.Stress vs Strain for regular and modified re-entrant diamond metamaterial.

Fig.4.Deformation behaviour corresponds to different points in Fig.3.
Fig.3 represents the in-plane uniaxial compression performance of the trail case's regular and modified re-entrant diamond metamaterial.
2.2.Methodology
Uniaxial quasi-static compression tests along thex-axis (inplane)were carried out using Shimadzu(Japan)AG-X series 50 kN table-top universal testing machine at a crosshead speed of 5 mm/min [38],as depicted in Fig.5.Obtained load-displacement data was converted to nominal stress-strain using nominal area and undeformed distance between two compressive ends of the structure.

Fig.5.Quasi-static in-plane and out-of-plane compression setup.
Deformation images were captured at five frames/sec using a points grey(currently FLIR,USA)camera and were used to calculate Poisson's ratio (ν) using the image processing technique [38].Microscopic images were captured using Dino-Lite digital microscope.Effect of each parameter on the specific compressive strength (σsp),specific stiffness (Esp),specific energy absorption(SEA),and Poisson's ratio (ν) were analysed using mean effect and signal-to-noise(S/N)ratios.In terms of DoE,measured outputs are called responses.In our case,experimental results σsp,Esp,SEA,and ν are called responses henceforth.The interrelated parameters on measured responses were combined to obtain the optimised structure using Grey Relational Analysis (GRA).An optimal structure was derived with an equal preference for individual responses.Micro Carbon (CF) and Glass (GF) fibres were reinforced to the optimised structure,and the uniaxial compression performance was evaluated in both in-plane and out-of-plane directions.The out-of-plane quasi-static compression tests were carried out using Zwick Roell (Germany) Z100 TEW 100 kN universal testing machine.
2.3.Grey Relational Analysis (GRA)
Adopted Taguchi's DoE method can only perform singleobjective optimisation and is not feasible for multi-objective optimisation.Julong Deng initiated the concept of grey system theory in 1982 [47].Grey strategy of a situation deals with strategy-making based on multiple objectives,which are contradictory in the ordinary way[47].The Grey Relation Analysis(GRA)combines different interrelated performance objectives to form a single value called grade.In the current study,GRA was adopted as a multi-objective optimisation tool along with Taguchi's DoE method to come out with a single output parameter level of θ1,(t/l),θ2,andhfor the required responses.The objective of the study is to maximise all the responses,hence,larger-the-better criterion is adopted.The mathematical formulations involved in the process are adopted[39,48] and have not been shown here in detail.
3.Experimental results
A typical stress-strain curve of cellular structures can express three significant regimes,(I)elastic regime,(II)plateau regime,and(III)densification regime,as shown in Fig.3 for modified re-entrant diamond auxetic structure.The peak stress in the stress-strain curve's elastic regime is considered the structure's compressive strength.The stiffness of the metamaterial is calculated as the slope of the linear-elastic region of the stress-strain curve.Poisson's ratio is noted in the linear-elastic region of the stress-strain curve [27].Obtained strength and stiffness are divided by the structure's nominal density to nullify the effect of weight on the compression performance.That will result in a strength-to-weight ratio and stiffness-to-weight ratio.The obtained are noted as specific strengths(σsp)and specific stiffness(Esp)of the cellular material in the present study.Specific energy absorption(SEA)is the ability of the structure to absorb energy during loading and practically is the ratio of area under a stress-strain curve to the density of the structure.The results obtained experimentally according to the design matrix are given in Table 3.

Table 3 Experimental results according to L9 orthogonal array.
3.1.Multi-objective optimisation
Though the σsp,Esp,andSEAhave similar trend with the parameters,ν have shown different trend with the(t/l)ratio variation,elucidating the need for multi-objective optimisation.The signal-to-noise ratio (S/N ratios) among the tests are calculated to determine the influence and variation caused by each parameter relative to the total variation observed in the result.The statistical term S/N ratio measures how the response varies relative to the target value under different noise conditions.The advantage of using the S/N ratio is that it incorporates changes in mean and variation with equal priority.It is always desired to consider the S/N ratio when there exists more than one sample per experimental level and proceed further with Taguchi's DoE method.Also,results behave linearly when expressed in the S/N ratio.The calculated S/N ratios considering the larger-the-better case for experimental levels are given in Table 4.

Table 4 S/N ratios of experimental responses.
The GRA consists of three significant steps.(I) Grey relational generation,(II)grey relational coefficient(λ)and(III)grey relational grade (GRG).The relationships involved in arriving at these are explained elsewhere [39,48].Obtained grey relational generation,grey relational coefficients(λ)and grey relational grades(GRG)for the S/N ratios are given in Table 5.The factorwjrequired to calculateGRGis utterly a decision maker's judgment based on the structure of the proposed problem and=1.Considering all output responses of equal importance,wjfor the current study is considered to be 1/4.

Table 5 Grey Relational Analysis for the obtained S/N ratios.
The level total table for generatedGRGis constructed and is given in Table 6.The particular level at whichGRGattains maximum value for a factor can be considered the optimum level for the combined responses.From Table 6,θ1at level 3(40°),(t/l)ratio at level 3(0.15),θ2at level 3(60°),andhat level 1(0.26 mm)can be considered the optimum set of parameters considering σsp,Esp,SEA,and ν with equal importance.

Table 6 Level total table for GRG.
3.2.In-plane performance
The optimised samples with θ1=40°,t/l=0.15,θ2=60°,andh=0.26 mm were fabricated,and micro CF and GF fibres were reinforced to the structure.Figs.6-8 illustrate the stress-strain andSEA-strain plots for optimised ABS,CF and GF structures,respectively.Corresponding deformation images are given in Fig.9.
When the ABS structure is loaded,the structure deforms elastically until point 1 in Fig.6.As deformation progresses,a slight rotation of the diamond at point 1 changes the direction of the stress-strain curve and point 1 is noted as the strength of the structure.Further increase in compression densifies the structure in the compression zone,as depicted in Fig.9.It improves the stress value with the overlap of the re-entrant walls on diamond walls starting at point 2.The progressive densification of the structure hikes the stress values up to point 3 as in Fig.6(a),thus the improvedSEAin the plateau region of the stress-strain curve in Fig.6(b).At point 3,the first local failure of the structure appears in the junction,stress redistributes,and continues to deform plastically.Upon reaching point 4,the structure experiences multiple failure sites and approaches global densification.

Fig.6.In-plane (a) Stress-strain curves and (b) SEA-strain plot for optimised ABS.
When the CF-ABS structure is loaded,a steep increase in stress is observed over a strain with improved deformation resistance of the material.At a strain corresponding to point 1 in Fig.7,the plastic deformation starts from the compression end and the stress-strain curve changes direction.As deformation advances,the first-row unit cells corresponding to the compression end deforms,densify locally,and hike the stress values starting at point 2.With a further increase in compression,the failure of the material starts from the compression end row-wise,and the structure begins to fail in a brittle manner,as shown in Fig.9 for CF-ABS.Material starts to flow out of the compression zone,and complete structure failure is observed at point 4.

Fig.7.In-plane (a) Stress-strain curves and (b) SEA-strain plot for optimised CF-ABS.

Fig.8.In-plane (a) Stress-strain curves and (b) SEA-strain plot for optimised GF-ABS.

Fig.9.Deformation behaviour corresponds to points in Figs.6-8,respectively.

Fig.10.Out-of-plane (a) Stress-strain curves and (b) SEA-strain plot for optimised ABS.
When the GF-ABS structure is loaded,similar to the CF-ABS structure,a steep increase in stress is observed over a strain with improved deformation resistance of the material.GF-ABS behaves identically to CF-ABS till point 2.After point 2,the GF-ABS structure starts to densify at the compression site with the overlap of re-entrant walls over diamond walls,as depicted in Fig.9 for GF-ABS.Until point 3,the GF-ABS structure behaves similar to the ABS structure with improved stiffness and stress values.Upon exceeding point 3,the local failure of the structure starts from the compression end,and the stress values suddenly drop with a maximum peak at point 3.A shoulder is observed at point 3.As the compression progresses,the material starts to flow out of the contraction zone and the structure collapse entirely at point 4.
3.3.Out-of-plane performance
The optimised structure is tested for the out-of-plane uniaxial compression performance.Figs.10-12 illustrate the stress-strain curves andSEA-strain plots for ABS,CF-ABS,and GF-ABS,respectively.The deformation images corresponding to the points in Figs.10-12 are given in Fig.13.For all out-of-plane results,SEAis considered at a strain of 0.6,and ν is not a criterion to evaluate the structure's out-of-plane performance,hence neglected.
Both ABS and composites deform similarly in the elastic regime during out-of-plane uniaxial compression,as shown in Fig.13.Initially,the structure resists deformation till point 1.As deformation progresses,the structure cross the elastic regime with the side walls deformation at point 2,and the diamond end face starts bulging with plastic deformation.At point 3,the structure begins densifying with a deformation pattern shown in Fig.13.The typical difference between ABS and composites is that ABS structures experience massive plastic deformation with layer debonding in the densification regime.However,the CF-ABS structure starts to collapse soon after the elastic regime,with layer debonding and multi-site damage leading to a considerable drop in stress values after the elastic regime (point 2),as illustrated in Fig.11.GF-ABS structures behave similarly to ABS structures with improved stress values and deformation resistance in the elastic regime.A considerable drop in stress value is not seen after point 2,as illustrated in Fig.12 for GF-ABS,leading to the improvedSEA.Multisite failure for GF-ABS can be seen in the densification region,whereas the CF-ABS structure experiences multi-site failure soon after the elastic regime.

Fig.11.Out-of-plane (a) Stress-strain curves and (b) SEA-strain plot for optimised CF-ABS.

Fig.12.Out-of-plane (a) Stress-strain curves and (b) SEA-strain plot for optimised GF-ABS.
4.Parametric effect
4.1.Specific strength (σsp)
The effect of parameters θ1,(t/l)ratio,θ2,andhon σspin the considered range is illustrated in Fig.14 in terms of mean effect and S/N ratio at a particular level.

Fig.14.(a) Mean and (b) S/N ratio for specific strength.
From Fig.14,it appears that(t/l)ratio is the most dominating parameter compared to all other parameters considered.Much variations among the levels of θ1,θ2,andhhave not been observed in Fig.14.With the increase in(t/l)ratio,σsptends to increase since the increased thickness of the structure has elevated the initial deformation strength of the metamaterial in the elastic regime.The critical observation is that the delamination among the printed layers can be observed during uniaxial compression for the structure with(t/l)ratio 0.15,as shown in Fig.15(a).The debonding has occurred because of the improved strength due to an increase in(t/l)ratio exceeds the layer bonding strength of the 3D printed structure either in plateau or densification regime.The same has not been observed for the thin structure with(t/l)ratio 0.09 after the uniaxial in-plane compression,as illustrated in Fig.15(b).
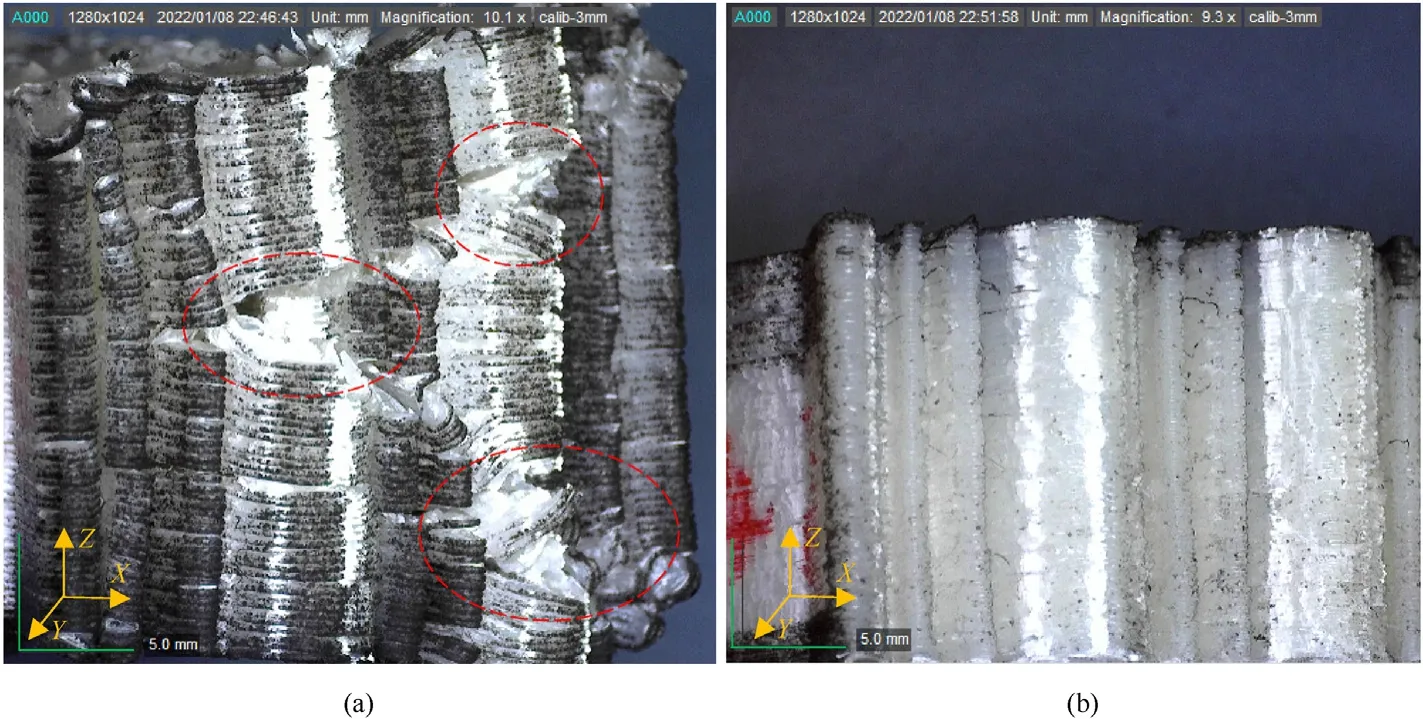
Fig.15.(a) Layer debonding for(t/l)ratio 0.15 and (b) no layer debonding for(t/l)Ratio 0.09 after compression.
4.2.Specific stiffness(Esp)
The effect of factors at a particular level onEspis illustrated in Fig.16 in terms of mean effect and S/N ratio.From Fig.16,it can be observed that all the considered geometrical parameters of the reentrant diamond structure influence theEsp.

Fig.16.(a) Mean and (b) S/N ratio for specific stiffness.
High the θ1,and θ2,better the stiffness of the material in the linear elastic region due to the resolution of the applied load.Increase in θ1slants the inclined re-entrant walls more toward the vertical axis,hiking the deformation resistance.Increase in(t/l)ratio improves the thickness of the cell walls,thus the stiffness.However,considering the stiffness to weight ratio,the higher(t/l)ratio has provided the bestEspof the metamaterial.If the design criterion is to have a stiff structure,θ1=40°,(t/l)=0.15,θ2=60°can be chosen as the best case.
4.3.Specific energy absorption (SEA)
The effect of factors at considered levels onSEAis shown in Fig.17 in terms of mean effect and S/N ratio.Higher the(t/l)ratio superior theSEAbecause of the improved stress values at both elastic and plateau regimes.Long-stroke without densification is the requirement of any cellular material in the viewpoint ofSEA.

Fig.17.(a) Mean and (b) S/N ratio for specific energy absorption.
Globally θ1,and θ2appears to have no significant effect on SEA since SEA was considered the value at the beginning of the densification regime.The critical observation is that θ1,and θ2has a significant influence on the deformation behaviour of the metamaterial.To explain the effect,θ1,and θ2at two extreme cases with constant(t/l)ratio are compared (DoE 1 and DoE 7).The stress-strain curves andSEA-strain plots are illustrated in Fig.18 for DoE 1 and corresponding deformation images in Fig.19.

Fig.18.(a) Stress-strain curves and (b) SEA-strain plot for DoE 1.

Fig.19.Deformation images correspond to Fig.18(a).
Initially,a slight rotation of the diamond can be seen at the elastic regime,leading to the overlap of re-entrant walls on the diamond walls.The slight rotation of the diamond causes the directional change of the stress-strain curve noted as point 2 in Fig.18.The re-entrant and diamond walls overlap and increase the stress values over a strain increment,thus a hike in stress values after point 2 in Fig.18(a).The opposite diamond rotates at a strain corresponding to point 3.As deformation progresses,complete reentrant walls relay over diamond walls leading to a rise in stress values due to structure densification at the compression site.At point 4,the material densifies with uniform global deformation of each unit cell,as shown in Fig.19(4).When θ1and θ2are at lower levels considered will result in the deformation behaviour illustrated in Fig.19 irrespective of(t/l)ratio in the considered range was observed.The deformation mechanism is more stretchdominant than bending-dominant,as shown in Fig.19.
As θ1and θ2increases,the structural deformation majorly turns into a localised phenomenon.Fig.20 depicts the stress-strain curves and SEA-strain plot for DoE 7,and corresponding deformation images are illustrated in Fig.21 where θ1,and θ2are at maximum levels.

Fig.20.(a) Stress-strain curves and (b) SEA-strain plot for DoE 7.

Fig.21.Deformation images correspond to points in Fig.20.
Initially,the deformation starts with the top compression end since the increased θ1and θ2improved the stiffness of the material resisting deformation,as shown in Fig.21(1).Thus the material free and weak top compression end walls deform,changing the stress direction as in Fig.20(a) past point 1.The structure continues to compress,and locally re-entrant walls overlap on the diamond walls at particular regions,as shown in Fig.21(2),leading to a steep increase in stress value at point 2.As compression advances passing point 3,the diamonds resist deformation and redistribute applied load leading to local phenomena.Material starts flowing out of the compression zone due to the high stiffness of diamonds(either left or right),with non-uniform densification of each unit cell at the compression sites.At point 4,the structure's local failure (walls break at junctions) can be seen,as depicted in Fig.21(4).The deformation mechanism is more bending-dominant than stretchdominant,as shown in Fig.21.The critical argument here is that the local failure with significant plastic deformation and minimum reduction in stress values at failure strains extends the structure's densification strain improving theSEA.The current study is limited to a compressive deformation of 30 mm;theSEAimprovements beyond these strains are not considered.Compared to DoE 1 in Fig.18,complete densification has not been observed for DoE 7.Also,a considerable fraction of elastic recovery was observed for structures with high θ1and θ2upon removal of compressive load.Approximately up to 65%of elastic recovery has been observed for DoE 7 configuration compared to a total compressive strain of 0.53.Again to note here,this elastic recovery also depends on(t/l)ratio.Lesser the(t/l)ratio better the strain recovery.
The importance of a comparative study between DoE 1 and DoE 7 is to hint that,though theSEAremained the least variant at densification strain (or strain of 0.5) considered,an evident variation in deformation pattern can be seen with the variation of θ1and θ2at the considered levels.
4.4.Poisson's ratio (ν)
The effect of factors at considered levels on ν is shown in Fig.22 in terms of mean effect and S/N ratio.The criterion is to have the maximum (ν) in the present study.All geometrical parameters of re-entrant diamond auxetic metamaterial were found to influence ν.Greater values of θ1,and θ2and minimum value of(t/l)ratio is desirable to have a better auxeticity.The factorhwas found to have a very minimal impact on the auxeticity of the re-entrant diamond auxetic metamaterial.If the design criterion is to have an improved auxetic effect,θ1=40°,(t/l)=0.09,θ2=60°can be chosen as the best case.
5.Statistical analysis
Statistical analysis has been performed to measure the impact of each parameter on the measured responses.Analysis of Variance(ANOVA) has been chosen as a statistical tool to understand each parameter's contribution and significance on measured outputs.ANOVA is a statistical technique used to verify if the means of two or more factors are significantly different and to understand the impact of one or more factors through a statistical approach.ANOVA tables have been constructed for each experimental output considering the S/N ratios in the present study.ANOVA for σspis given in Table 7,where SS is the sum of squares,DOF is degrees of freedom and %jis the % contribution to variation.The selected L9 orthogonal array can handle up to 8 DOF and is sufficient for a 4-factor system at a 3-level,thus ignoring the error DOF.In those cases,the term with the least significance (least SS value) can be considered a pooled error factor,and the analysis can be continued[49].

Table 7 ANOVA for σsp.
Considering σsp,(t/l)ratio is the most dominant factor,with an F-Test value of 73.78 in a confidence interval of 95%.The(t/l)ratio alone is responsible for about 92.52% of the total variation in the mean experimental data.F-critical value for the system with a total DOF of 8 and factor DOF of 2 is 4.459 at an α=0.05.The F-Test values of any other factor in Table 7 apart for(t/l)ratio is below the F-Critical,and there is no statistically significant difference among the groups' mean scores for all other factors.A null hypothesis for θ1,θ2,andhcannot be neglected.The(t/l)ratio is the only factor that affects the σspof the re-entrant diamond structure in the elastic regime of the material performance.
The influence of geometrical parameters onEspis entirely distinct compared to σsp.Each geometrical parameter considered has a significant influence,with the F-Test values much higher than F-Critical.The null hypothesis for geometrical parameters of reentrant diamond structure can be neglected and are statistically significant.The(t/l)ratio alone contributes about 52.18% to the total variation,as given in Table 8,followed by θ1and θ2as influencing parameters.The printing parameterhhas minimum to no significance compared to the geometrical parameters and is pooled to perform F-Test.

Table 8 ANOVA for Esp.
a Pooled.
The ANOVA forSEAis given in Table 9.SEAwas considered at the end of the plateau region,as explained earlier.In this global sense,the geometrical parameters have no significant influence except for(t/l)ratio.The F-Test values of θ1,θ2andhis below the F-Critical value,and thus null hypothesis cannot be rejected for these factors and factors are considered statistically insignificant.The factors θ1,θ2andhcan be ignored consideringSEA.The only factor(t/l)ratio contributes about 89.65% variation to the overall mean and is a statistically significant parameter.

Table 9 ANOVA for SEA.
The ANOVA for ν is given in Table 10.In the view of ν,all considered geometrical parameters of the re-entrant diamond structure are statistically significant.The F-Test values are higher than the F-Critical values for θ1,t/l,and θ2thus the null hypothesis can be rejected.The factor θ1appeared to be the most influential parameter with the high F-Test value and 57.88% overall contribution,followed by θ2andt/lratio.The influence of printing parameterhis very minimum hence pooled and can be ignored considering ν.

Table 10 ANOVA for ν.
6.Discussion
The multi-objective optimisation developed a trade-off between the performance attributes with the improvements in σsp,Esp,andSEA.A reduction in ν is observed with optimisation.The optimised in-plane properties are given in Table 11 for ABS and composite structures.An average improvement of 10.63%,16.41%,and 13.17%in σsp,Esp,andSEA,respectively,are yielded for optimised ABS structure compared to the highest values of DoE in Table 4 with an 11.73% reduction in ν.Further 39.15%and 44.90%improvements inEspare observed for CF and GF reinforced structures compared to optimised ABS structures.GF reinforcement also enhanced σspby 5.38% compared to the ABS structure.The CF and GF microfiber reinforcement was found to be advantageous in the linear elastic strain range.A key point to note here is that GF reinforcement has excelled the in-plane compressive performance up to a deformation strain of 0.18 and is beneficial in small deformation auxetic applications.Though the micro carbon fibre reinforcement improved theEspconsiderably,the structure failed to perform postyielding due to a lack of interfacial bonding among CF and ABS.The deformation of the CF structures is limited to local sites with improved stiffness.The structure failure starts from the compression ends and collapses row-wise catastrophically.The ABS matrix failed to transfer the load to fibres,and fibre was pulled out from the matrix leading to a premature failure during uniaxial compression.Though ABS and GF-ABS performed similarly up to a strain of 0.2,the GF-ABS structure enhanced failure sites and experienced brittle failure.Both the composites' post-yielding performance is fragile compared to the ABS structures in the inplane direction.

Table 11 Optimised structural in-plane properties.
Strength-wise,the re-entrant diamond structure performed exceptionally well in the out-of-plane direction than in the inplane.The out-of-plane properties for the optimised structure are given in Table 12.The micro GF reinforcement further enhanced the out-of-plane compression performance with a 12.57% increase in σspand 16.24%increase inSEAcompared to the ABS structure.The reinforced glass fibres resist the dip in stress values up to a certain degree after the onset of plastic deformation,thus improving theSEAof the structure.The interlayer bonding deficiency of the CFABS structure has weakened the structure with multiple failure sites soon after the elastic regime.A notable shoulder with a significant fall in stress values can be seen for the CF-ABS structuresoon after deformation crossing the elastic regime has reduced theSEAof the structure.

Table 12 Optimised structural out-of-plane properties.
Overall,up to seven times increase in σsp,a two-fold increase inEsp,and thirteen times increase inSEAis evident in the out-of-plane direction compared to the in-plane direction for the GF-ABS structure as given in Tables 11 and 12.However,the auxetic effect has not been observed in the out-of-plane direction.Thus the study depicts the anisotropy of the re-entrant diamond structure.The study also illustrates the tailorability of the re-entrant diamond auxetic metamaterial according to application requirements either through tuning the geometrical parameters,selection of loading direction,or fibre reinforcements.
The key observation is that the microfiber reinforcements have significantly influenced the collapse mode of the structure in the in-plane compression and are minimum in out-of-plane compression.This is because the reinforced fibres tend to align in the direction of printing due to shear forces in the nozzle in FFF [50,51].The aligned fibres are longitudinal to the in-plane compression and responsible for load-carrying capacity.However,the microscopic studies in our previous study [39] for the re-entrant diamond auxetic structure confirms the weak bonding between fibre and matrix,leading to catastrophic failure of the CF-ABS structures.Though good bonding between fibre and matrix has been observed for GF-ABS,fibre breakage and high void fraction of GF-ABS composites failed to perform post-yielding.Similarly,for out-of-plane compression,fibres are oriented orthogonal to the loading direction and have a minimal role as load-bearing members.Thus the influence of fibre reinforcements on the out-of-plane collapse mode is minimum.
The systematic parametric study and statistical analysis revealed that the θ1and θ2can have the most negligible influence on the σspandSEAsince σspis considered at the end of the elastic regime andSEAat the end of the densification regime.The initial deformations correspond to σspfor all θ1and θ2levels considered are similar,thus making σspresistive to the change in θ1and θ2.However,the(t/l)ratio has a prominent effect on σspandSEA.The angles θ1and θ2in the considered range have an evident influence onEsp.The increase in the angle θ2improves the deformation resistance of the diamond leading to the change in deformation patterns for high θ1and θ2.The auxeticity of the re-entrant diamond metamaterial has an explicit dependency on the geometrical parameters.Higher θ1,θ2and lower(t/l)ratio is desirable to have better auxetic effects inx-direction compression.The considered printing parameterhmerely affected the compression performance of re-entrant diamond metamaterial.
Critical observation from the current study is that a ν of up to-3.49 can be obtained for the re-entrant diamond structure with the tuning of geometrical parameters and,if loaded in thex-direction making the structure suitable for high auxeticity requirement applications.The maximum auxetic effect observed in thexdirection compression is almost ten times higher than the effect observed in they-direction for the same re-entrant diamond metamaterial in our previous study[39].Improvements in σsp,andEspis also evident with the tuned structure inx-direction loading.The study can also serve as a roadmap in choosing loading direction,geometrical parameters,and fibre reinforcements to the reentrant diamond auxetic metamaterial for desired uniaxial compression loading needs.The statistical study can also help in the right and prominent selection of parameters for practical needs.
7.Conclusions
The in-plane and out-of-plane uniaxial compression performance of the 3D printed re-entrant diamond auxetic metamaterial was systematically studied considering Taguchi's DoE method.The influence of the most influential geometrical and printing parameters was postulated with the experiments,and statistical analysis was carried out to know the significance of each parameter on compression performance.The fibre reinforcements have significantly enhanced the deformation resistance of the structure with the cause ofSEAin the in-plane direction.The micro-glass fibre reinforcement excelled the performance of the structure in a short deformation strain range of 0.18 with significant improvements in σsp,Esp,andSEAwithout much alterations to ν.The current study reveals that the maximum ν for the re-entrant diamond structure could be during thex-direction compression,and a ν of up to-3.49 could be obtained.The glass fibre reinforcement surpassed the outof-plane performance and yielded a seven-times increase in σspand a thirteen times increase inSEAcompared to in-plane compression.The current study also reveals the tailorability of the re-entrant diamond auxetic metamaterial either by tuning geometrical parameters,altering loading direction or with the fibre reinforcements according to application needs.Though carbon fibre reinforcement improves the deformation resistance of the structure in an in-plane direction,it failed to perform post-yielding due to poor interfacial properties between fibre and matrix.Parametric studies disclose that the high(t/l)ratio is desirable to have a better σspandSEA.High θ1,(t/l)ratio,and θ2are desirable to have a betterEsp.High θ1,and θ2with low(t/l)ratio is required to improve ν of the structure.
Declaration of competing interest
The authors declare that they have no known competing financial interests or personal relationships that could have appeared to influence the work reported in this paper.
Acknowledgements
The authors are grateful to Dr.Ratna Kumar Annabattula,Dr.Ravi Sankar Kottada,Mr.Sujith Reddy,and Mr.Sabari Rajan S of IIT Madras for helping in the experimentation.Dr.Ratna Kumar Annabattula and Dr.Ravi Sankar Kottada shared 50 kN Shimadzu and 100 Zwick Roell UTMs available in their respective labs during the work.Mr.Sujith Reddy and Mr.Sabari Rajan S helped in UTM operations.
杂志排行

Defence Technology的其它文章
- Flame behavior,shock wave,and instantaneous thermal field generated by unconfined vapor-liquid propylene oxide/air cloud detonation
- Frequency domain analysis of pre-stressed elastomeric vibration isolators
- Burning surface formation mechanism of laser-controlled 5-aminotetrazole propellant
- Blast disruption using 3D grids/perforated plates for vehicle protection
- Nonlinear tight formation control of multiple UAVs based on model predictive control
- IQR-based approach for DDoS detection and mitigation in SDN