Distribution and conservation of near threatened plants in China
2023-07-11QinLiuTianTianXueXiaoXiaZhangXuDongYangFeiQinWenDiZhangLeiWuRainerBussmannShengXiangYu
Qin Liu , Tian-Tian Xue , Xiao-Xia Zhang , Xu-Dong Yang , Fei Qin ,Wen-Di Zhang , Lei Wu , Rainer W.Bussmann , Sheng-Xiang Yu ,*
a State Key Laboratory of Systematic and Evolutionary Botany, Institute of Botany, Chinese Academy of Sciences, Beijing 100093, China
b College of Forestry, Central South University of Forestry and Technology, Changsha 410004, China
c College of Life Sciences, University of Chinese Academy of Sciences, Beijing 100049, China
d Institute of Botany and Bakuriani Alpine Botanical Garden, Ilia State University, Botanical Str.1, Tbilisi 0105, Georgia
e Department of Botany, State Museum for Natural History Karlsruhe, Erbprinzenstraße 13, Karlsruhe 76133, Germany
Keywords:Conservation Distribution patterns Diversity hotspots Nature reserves Red list Near threatened species
A B S T R A C T Plants classified as Near Threatened (NT) are at high risk of becoming threatened because of anthropogenic interference and climate change.Especially in conservation efforts, such species have however long been overlooked.Here, we obtained 98,419 precise occurrence points for 2442 NT plants in China,and used species richness,species complementarity,and weighted endemism that consider all,endemic and narrow-ranged species in order to identify the diversity hotspots of NT plants.Then we evaluated the conservation effectiveness of current nature reserves for them.Our results indicate that the diversity hotspots of NT plants were mainly confined to southwestern and southern China, and only 35.87% of hotspots and 71.5% of species were protected by nature reserves.Numerous hotspots in southwestern China (e.g., Sichuan, Yunnan, Guangxi, and Hainan) were identified as conservation gaps.Given that NT plants include large proportions of endemic and narrow-ranged species, they represent an important value in conservation priority.So, more conservation efforts in the future should be tilted towards NT plants.Additionally, when comparing with the recently updated NT list, there are already 87 species raised to threatened categories, while 328 species were lowered to least concern, 56 species were now categorized as data deficient,and 119 species considered as uncertain due to changes of scientific names.It is essential to carry out a continuous assessment of species' threatened categories to realize targeting conservation.
1.Introduction
Biodiversity is fundamental to the maintenance of global ecosystems and human subsistence;however,anthropogenic activities and climate change have caused many species to experience habitat loss and extinction,with biodiversity loss currently occurring at an unparalleled rate(Millennium Ecosystem Assessment,2005;Rands et al.,2010).Due to limited global natural resources,priority should be given to the establishment of high-biodiversity conservation areas with high endemism and large concentrations of endangered species, and such efforts have become the focus of current biodiversity conservation researches (Dobson et al.,1997; Myers et al.,2000; Zhang and Ma, 2008; Zhang et al., 2015a).Threatened species have been regarded as one of the critical criteria in the identification of biodiversity hotspots and the prioritization of conservation efforts.Many researchers have conducted in-depth studies on the distribution patterns and conservation effectiveness for threatened species in various regions(Dobson et al.,1997;Grenyer et al., 2006; Zhang and Ma, 2008; Farashi et al.,2017).
However, plants classified as Near Threatened (NT) by the International Union for Conservation of Nature (IUCN) receive little attention, even though they are at high risk of shifting into threatened categories (Vulnerable, VU; Endangered, EN; and Critically Endangered,CR)in the future(Liu et al.,2019;Chatterjee et al., 2020; Qiu et al., 2020).Wang et al.(2013) reassessed the threatened status of 87 plant species in the Shegyla Mountains,Xizang, China,and upgraded 19 plants originally assessed as NT in the China Species Red List (Wang and Xie, 2004) to threatened categories because of human activities and other factors.Wang et al.(2017) reevaluated the threatened categories of 46 protected wild plants in Chongqing,China;five species classified as NT in the China Species Red List (Wang and Xie, 2004) were upgraded to VU.The overall trend of decreasing biodiversity is continuing, and many NT plants are threatened because of excessive human activities, alien species invasion, and habitat fragmentation and loss(Zhang et al.,2011;Dong et al.,2017).Therefore,these species have substantial conservation value, and should become priorities of biodiversity conservation efforts.However, few studies have focused on NT plants and research is urgently needed concerning the geographical distribution patterns and conservation effectiveness for NT plants.
The identification of biodiversity hotspots and assessment of conservation effectiveness are important for establishing conservation priorities (Yu et al., 2017).Biodiversity hotspots have traditionally been identified based on species richness (Myers et al.,2000; Orme et al., 2005; Brooks et al., 2006; Ceballos and Ehrlich,2006).It can identify the areas harboring most species, facilitating conservation planning even with limited information and resources (Veach et al., 2017).Recently, the complementary algorithm, which can avoid selecting much duplication of areas with similar species, has been increasingly applied to the identification of priority areas in combination with species richness (Dobson et al., 1997; Chi et al., 2017; Veach et al., 2017; Shrestha and Wang, 2018).Additionally, species with a narrow range are more likely to be threatened(Linder,1995;Gaston and Blackburn,1996),and thus, weighted endemism has been used to identify biodiversity hotspots (Linder, 2001; Huang et al., 2016).Conservation planning based on a single species index may be insufficient to provide systematic guidance for biodiversity conservation (Luo et al., 2015; Huang et al., 2016; Veach et al., 2017).The identification of biodiversity hotspots and implementation of comprehensive conservation priority actions based on multiple biodiversity conservation indices are essential activities for future conservation efforts (Xie et al., 2022).
China has extremely high plant diversity with many endemic,rare,and endangered species(Tang et al.,2006;Zhang et al.,2015a;Huang et al., 2016).However, because of rapid economic development and excessive anthropogenic activities, there is little optimism that the biodiversity status of China will be maintained.Numerous threatened species are in urgent need of protection(Wang et al., 2015).Qin et al.(2017a) comprehensively and systematically assessed the threatened status of 35,784 species of higher plants in China, among which 2818 plant species were classified as NT (comprising 7.88% of all higher plants).Previous studies have estimated that 15-20% of higher plants in China are threatened (Editorial Committee of China's Strategy for Plant Conservation, 2008; Editorial Committee of China National Biodiversity Conservation Strategy and Action Plan, 2011), but the assessment by Qin et al.(2017a) indicated that only 10.84% of higher plants were threatened,reflecting the possibility that more NT plants will be upgraded to threatened categories in the future.Therefore, further in-depth studies regarding the distribution patterns and conservation effectiveness of NT plants will help to clarify the overall situation of biodiversity conservation and provide an important reference for biodiversity conservation researches in China.
In this study, we complied a high-resolution geographic occurrence database of China's NT plants for the first time.We used the indices of species richness,species complementarity,and weighted endemism to explore the distribution patterns of various NT plant groups (all NT plants, endemic NT plants, and narrow-ranged NT plants)and their correlations;we then combined the three indices to identify diversity hotspots of NT plants in China.Moreover, we investigated conservation effectiveness and gaps in current nature reserves for NT plants by overlaying the NT plants' diversity hotspots with China's nature reserves.Our results provide a scientific basis for the long-term conservation of plant diversity in China based on NT plants.
2.Materials and methods
2.1.Inventory and occurrence data of NT plants
The NT plant species used in this study were compiled from the China Biodiversity Red List: Higher Plant Volume (https://www.mee.gov.cn/gkml/hbb/bgg/201309/t20130912_260061.htm), which was issued by the former Ministry of Ecology and Environment of the People's Republic of China in 2013 (MEP, 2013).The Red List contains 2723 NT plants including 94 bryophytes, 67 ferns, 12 gymnosperms,and 2550 angiosperms.It is based on the evaluation of 34,450 higher plant species in China by 294 experts in accordance with the IUCN Red List Categories and Criteria (v.3.1; IUCN,2001) and Guidelines for Application of IUCN Red List Criteria at Regional Levels (v.3.0; IUCN, 2003).In this study, we only focused on NT angiosperms.We updated the scientific names of NT plants in accordance with the Catalogue of Life China (2022) Annual Checklist (www.sp2000.org.cn/) by replacing the synonyms with accepted names.While the most recent assessment of China's seed plants was published in 2021 (Qin et al., 2021), our study is still based on the 2013 Red List, which was officially published by the Chinese government.In order to compare the differences between the two lists,we extracted the threatened status of 2013 NT plants from the 2021 list (Table S1).
Data regarding the geographic distributions of NT plants were downloaded from the Chinese Virtual Herbarium(www.cvh.ac.cn)and Global Biodiversity Information Facility(https://www.gbif.org).And we checked the scientific names of the specimens according to the Catalogue of Life China and excluded specimen records lacking precise locality.Then we geo-referenced these occurrence records with accurate coordinate information according to Gazetteer of China (Institute of Geographical Names, State Bureau of Surveying and Mapping, 1997) using the SQL Server Management Studio(Microsoft SQL Server, 2008) and manually fine-tuned the results with the help of maps.Moreover, we obtained the provincial distribution ranges of NT plants from the Flora of China (http://www.efloras.org/) and rescreened them to delete the records that did not belong to the species range.
A total of 98,419 occurrence records with longitude and latitude which contain 2442 NT plants and belonging to 724 genera and 138 families were finally obtained for the analysis of distribution patterns of NT plants.And the remaining 108 NT plants were excluded from our further analysis due to the difficulty in obtaining precise occurrence records from specimens and historical literature.Then,we divided the NT plants into three groups,including all,endemic,and narrow-ranged NT plants.Among the 2442 NT plants, 1650 were endemic species (67.57%) belonging to 476 genera and 102 families,while 954 were narrow-ranged species(39.07%)belonging to 92 families and 378 genera(Table S2).We defined the concept of endemism as described by Anderson (1994) and Huang et al.(2014), with reference to species restricted to China.The concept of narrow-ranged species was defined as described by Qin et al.(2017b), with reference to species that occurred in ≤3 counties,approximately equivalent to 4 grid cells (50 km × 50 km).
2.2.Distribution patterns and hotspots of NT plants
We divided the map of China into 3986 grid cells with a resolution of 50 km×50 km in ArcGIS 10.6 to visualize the geographical distribution patterns of NT plants and identify their hotspots.Then we converted the text file of species distribution data with precise latitude and longitude information to geographical distribution points and joined it with the grid cells.If multiple distribution points of a species were present within the same grid cell,only one point was retained.Eventually, a total of 44,328 geographical distribution points with the grid number were derived for the analysis of distribution patterns of species richness, species complementarity, and weighted endemism of the three NT plant groups (all,endemic and narrow-ranged species).And we comprehensively considered the three plant groups to identify the integrated diversity distribution patterns of each diversity indices.
Species richness was expressed as the total number of species in each grid cell (Prendergast et al.,1993; Orme et al., 2005; Richard et al., 2006).Species complementarity was assessed by complementary algorithm, by selecting the grid cell with the highest species richness,then excluding all species distributed therein from further consideration.This process was repeated iteratively until all species were included in the selected grid cell(Vane-Wright et al.,1991;Dobson et al.,1997).The number of species remaining in each selected grid cell was used to represent the species complementarity of this grid cell.When multiple grid cells had the same number of unselected species, they were all selected to avoid missing important species.Weighted endemism (WE) assigns different weights to species according to the number of spatial units that they cover, i.e., the reciprocal of the distribution area(Williams et al., 1996; Williams, 2000); the smaller the species distribution area, the higher weight assigned to it.The weight values of all species in each grid cell were summed to obtain the weight of the corresponding grid cell.Areas with a high WE are generally those with a relatively high concentration of species within a narrow range (Huang et al., 2016).The WE index was calculated as follows:
where n is the number of species distributed in the spatial unit of concern, and Wi is the weight of the ith species in that grid cell.Based on this formula,we calculated the WE values for all,endemic,and narrow-ranged NT plants in each grid cell.
In order to analyze the integrated diversity distribution patterns of species richness, species complementarity, and weighted endemism,we first calculated the value of each diversity indices for each of the three NT plant groups in each grid cell.Then we standardized it by converting it into the ratios of the maximum values of each diversity indices of their corresponding plant groups.Lastly, we summed the standardized values of the three plant groups calculated for each diversity indices as an integrated index of each diversity indices.
During the determination of NT plants’hotspots,we adhered to the principle of using the smallest area that covered the most species.Following Zhang et al.(2015b) and Xie et al.(2021), we selected the areas that contain over 90%species as the hotspots of species complementarity,and it needs about 158 grid cells(ca.4%of the landmass)(Fig.S1).And the top 5%is usually considered as an appropriate threshold in hotspots identification of species richness and weighted endemism (Prendergast et al.,1993; Grenyer et al.,2006; Huang et al., 2016; Yu et al., 2017; Xue et al., 2021; Xia et al., 2022; Xie et al., 2022).So in order to compare the differences of hotspots in geographical distribution among the three diversity indices, we selected an equal number of grid cells with the highest integrated index(comprising 5%of all grid cells)as hotspots for the three diversity indices.Finally, we identified diversity hotspots for NT plants by overlapping the hotspots of the three diversity indices.
2.3.Distribution pattern correlations among the three indices
Using the ‘corrplot’R package (v.4.0.3, Wei and Simko, 2017),Pearson correlation analysis was conducted on the distribution patterns of species richness, species complementarity, and weighted endemism for all,endemic,and narrow-ranged NT plants.We constructed a matrix for correlation analysis with the three plant groups as columns and grid cell identification codes as rows(Table S3).Because empty cells are not permitted by the program,we replaced missing values with “0”to enable analysis.Subsequently, the variables were standardized before running the correlation analysis.Based on Schober et al.(2018), the correlation coefficient r was classified as negligible (0 ≤ |r| < 0.10),weak (0.10 ≤|r| <0.40), moderate (0.40 ≤|r| <0.70), strong(0.70 ≤|r| <0.90), or very strong (0.90 ≤|r|≤1).
2.4.Analysis of conservation effectiveness and gaps
By the end of 2017, China had 2750 nature reserves, covering 14.9% of the country's land area (MEP, 2019).A list of the reserves was downloaded from the website of the Ministry of Ecology and Environment of the People's Republic of China (http://www.mee.gov.cn).In addition, geographic information system data for Chinese nature reserves were downloaded from the World Database on Protected Areas(https://ProtectedPlanet.net,accessed on March 14, 2019), and a geographic information database of the Chinese nature reserve network was constructed.The database contained information for 464 national nature reserves and 806 provincial nature reserves.Only major reserves were selected (i.e., national,and provincial nature reserves)because they represent the highest level of nature reserves, include the majority of nature reserves in China, are strictly managed, and have clearly defined boundaries(Quan et al., 2009; Zhao et al., 2013; Zhang et al., 2015a).
To analyze conservation effectiveness and gaps of the nature reserves for NT plants, we calculated the area occupied by nature reserves in each grid cell.A hotspot grid cell with nature reserves<10%coverage was regarded as a conservation gap(Xu et al.,2017,2019).Conservation effectiveness and gaps were calculated for national nature reserves,provincial nature reserves,and both types of reserves combined.To elucidate the relationships more clearly between conservation effectiveness and gaps for various plant groups, we divided all NT plants into three categories of narrowranged species (designated as the first level), endemic species with narrow-ranged species eliminated (second level), and the remaining NT plants (third level).Then, we used the ‘circlize’(Gu et al., 2014) and ‘tidyverse’(Wickham et al., 2019) packages in R(v.4.0.2;R Development Core Team,Vienna,Austria)to present the occupancy of these NT plant groups in hotspots, national nature reserves, and provincial nature reserves as chord diagrams and circular bar plots.
3.Results
3.1.Comparison of the 2013 list with the 2021 list
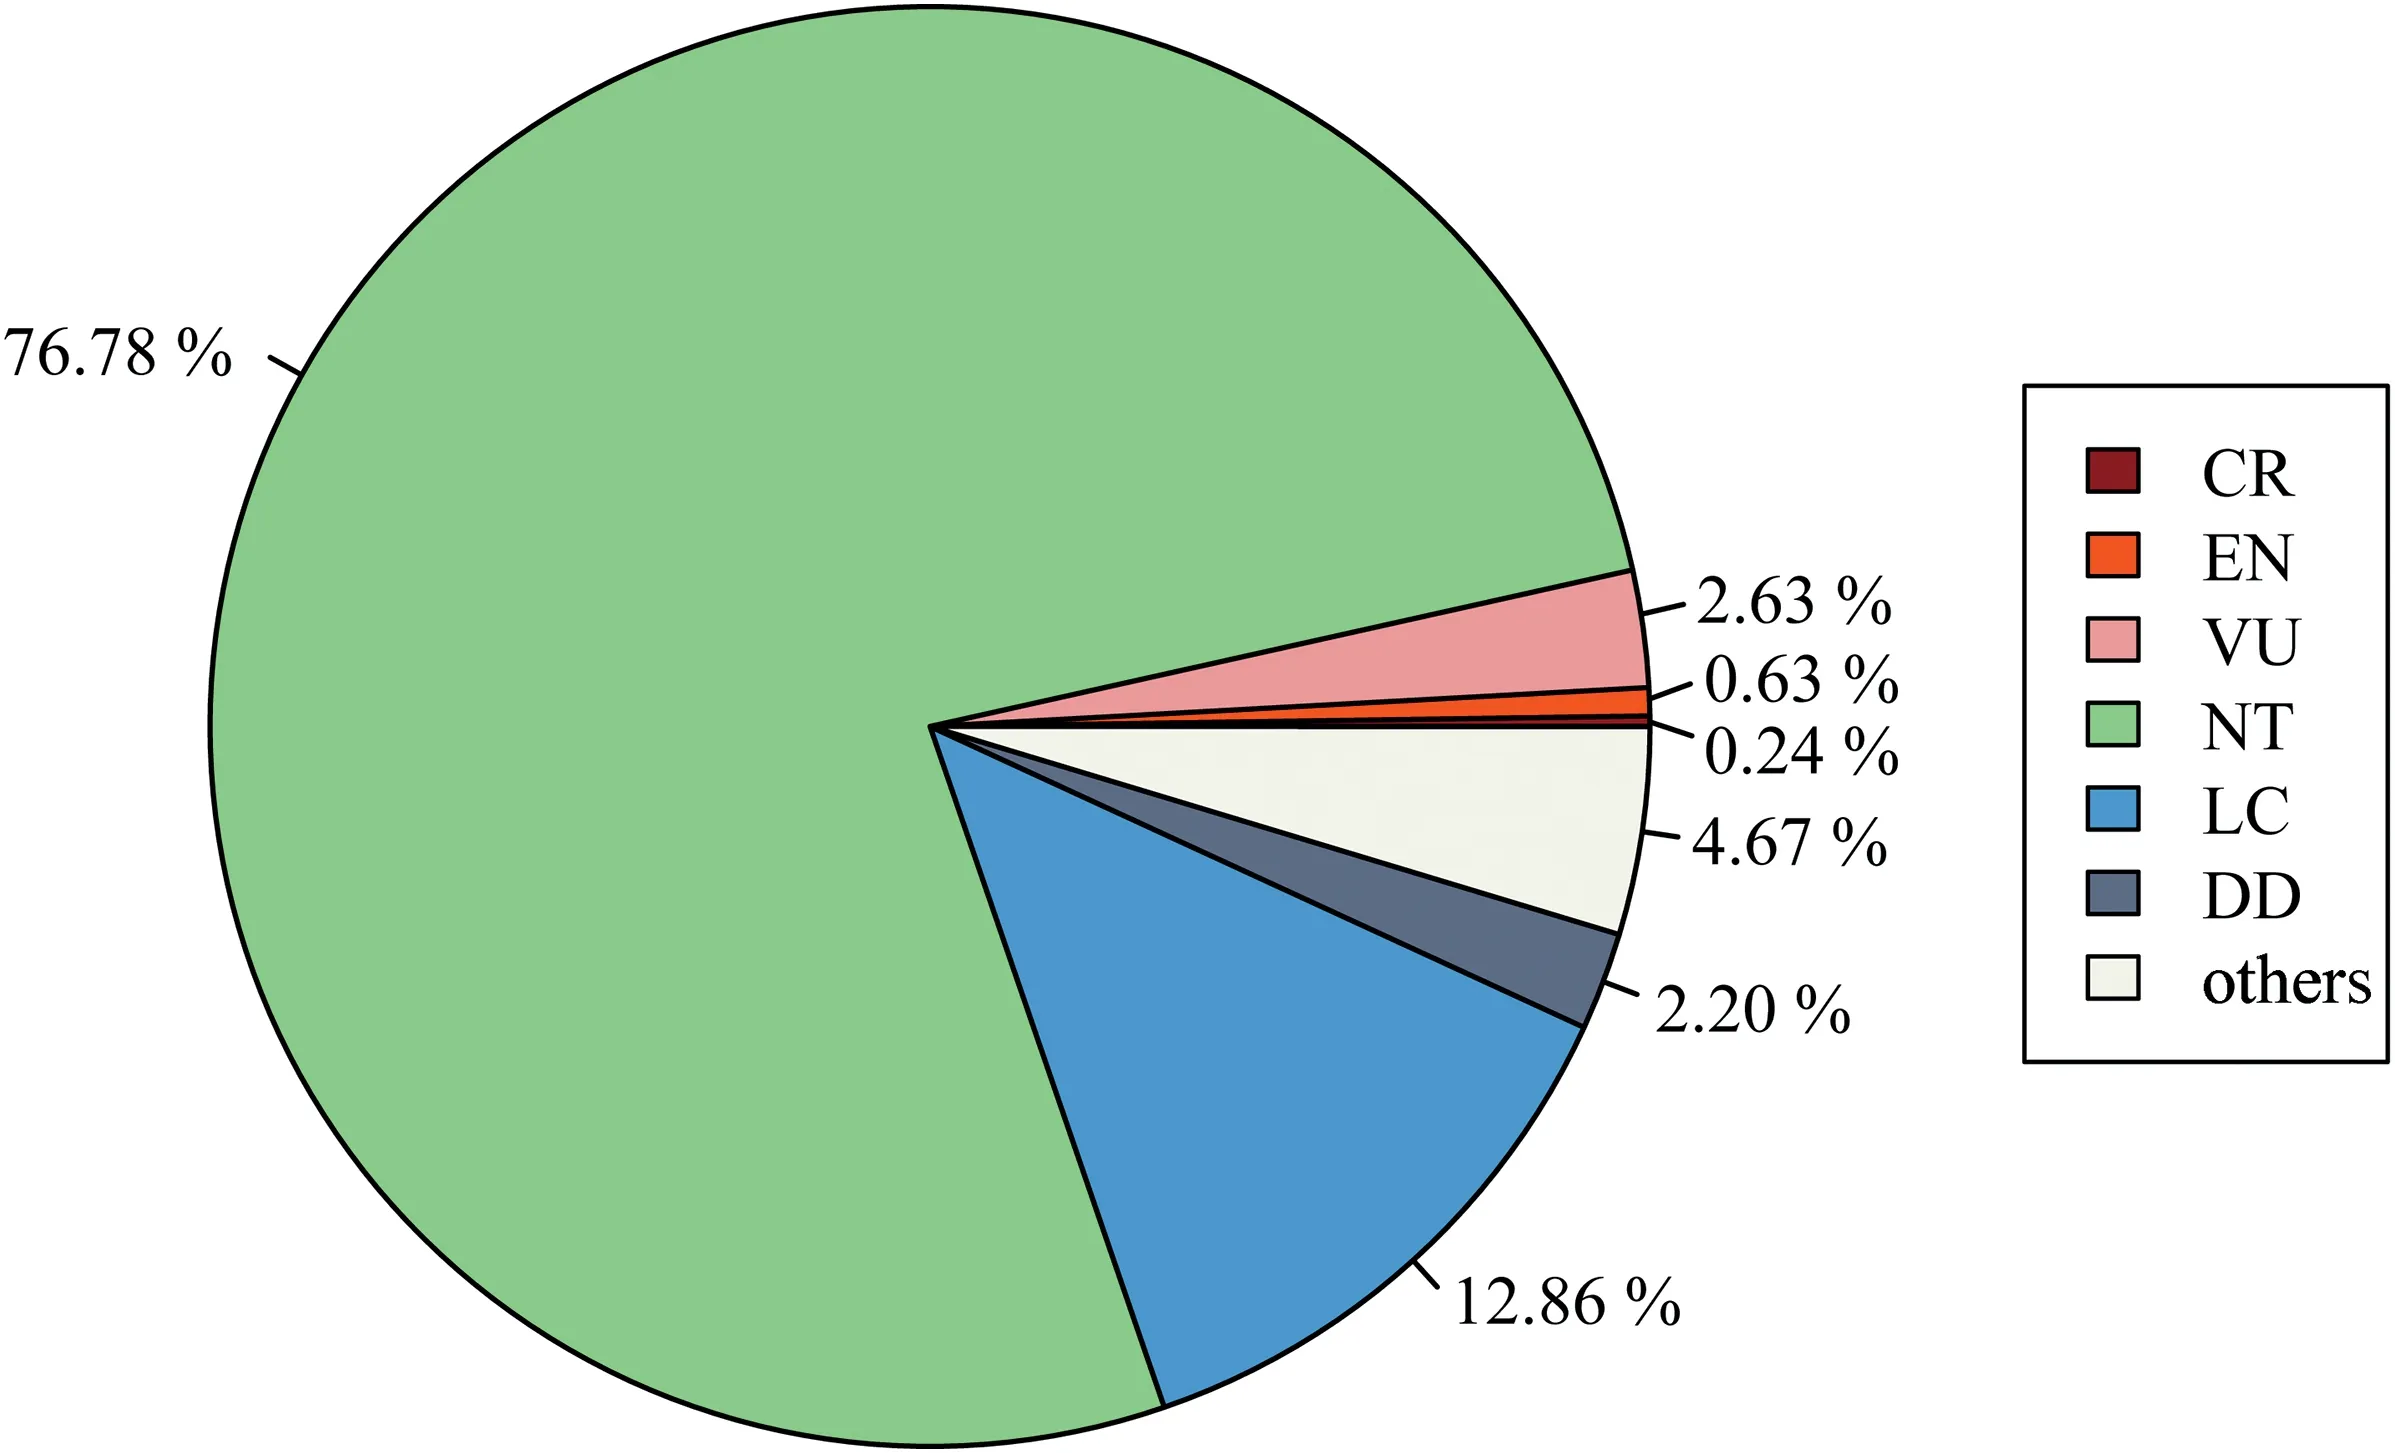
Fig.1.The threatened status of 2013-NT plants in the 2021 Red List.CR:Critically Endangered,EN:Endangered,VU:Vulnerable,NT:Near Threatened,LC:Least Concern;DD:Data Deficient.
Among the 2550 NT plants in the 2013 List, 1958 species(76.78%) remained NT category in the 2021 List (Fig.1; Table S1).Another 89 species (3.49%) of NT plants were upgraded to threatened categories in the 2021 list, including 6 CR species(0.24%), 16 EN species (0.63%) and 67 VU species (2.63%).In contrast, 328 NT plants (12.86%) were downgraded to Least Concern(LC).Finally,there were also 56 NT plants(2.20%)listed as Data Deficient (DD) and 119 NT plants (4.67%) could not match threatened status in the 2021 List due to changes in species circumscription.
3.2.Distribution patterns of NT plants
Analysis of the species richness distribution pattern of all NT plants indicated that grid cells with high species richness were mainly distributed in southwestern and southern China, including northwestern and southern Yunnan; central and southwestern Sichuan; southwestern and northern Guangxi; and southeastern Xizang(Figs.2a and S2).The species richness distribution pattern of endemic NT plants was similar to the distribution pattern of all NT plants(Fig.2a and b),while grid cells with high endemic NT plants richness were mainly concentrated in northwestern Yunnan; central and southwestern Sichuan(Fig.2b).Grid cells with high species richness of narrow-ranged NT plants were found only in northwestern, southern, and southeastern Yunnan; southwestern Guangxi;and southern Hainan(Fig.2c;Table S4).In the correlation analysis of distribution patterns, a very strong correlation was detected between all NT plants and endemic NT plants (r = 0.95,P <0.01) (Fig.3).
In species complementarity analysis,grid cells with high values of species complementarity for all,endemic,and narrow-ranged NT plants were confined to northwestern and southern Yunnan;southwestern Sichuan; and southwestern Guangxi; all three plant groups showed very similar distribution patterns (Fig.2d-f;Table S5).High species complementarity was identified in northwestern Yunnan for narrow-ranged NT plants (Fig.2f).Species complementarity indicated a strong correlation between the distribution patterns of all and endemic NT plants(r=0.83,P <0.01)(Fig.3).
For all NT plants, grid cells with high values of weighted endemism were identified in southeastern Xizang; northwestern,southern, and southeastern Yunnan; central and southwestern Sichuan;northern and southwestern Guangxi;Hainan;and Taiwan(Fig.2g).The distribution pattern of endemic NT plants was similar to the distribution pattern of all NT plants,whereas the distribution pattern of narrow-ranged NT plants differed from the other two plant groups (Fig.2h and i; Table S6).Few grid cells had high weighted endemism values for narrow-ranged NT plants, most of which were confined to northwestern, southern and southeastern Yunnan (Fig.2i).Furthermore, the distribution patterns for each pair of NT plant groups showed strong correlations(r=0.89-0.95,P <0.01) (Fig.3).
Based on species richness, considering all, endemic, and narrow-ranged NT plants, the grid cells with high values of integrated species richness were mainly distributed in northwestern,southern, and southeastern Yunnan; central and southwestern Sichuan; as well as northern and southwestern Guangxi (Fig.S3).For integrated species complementarity,grid cells with high values were generally confined to northwestern and southern Yunnan;and central Sichuan(Fig.S4).The distribution pattern of integrated weighted endemism was similar to the distribution pattern of integrated species richness, as confirmed by their very strong correlation (r = 0.92, P <0.01) (Fig.3), and the grid cells with high integrated weighted endemism were mainly distributed in northwestern,southern and southeastern Yunnan;central Sichuan;and southern Hainan (Fig.S5).A strong correlation was also found between the distribution patterns of integrated weighted endemism and species complementarity(r = 0.80, P <0.01) (Fig.3).
3.3.Distribution patterns of NT plants diversity hotspots
The hotspots of integrated species richness and weighted endemism exhibited strong consistency in terms of geographic distributions,with most hotspot grid cells located in northwestern,southern, and southeastern Yunnan; central and southwestern Sichuan;northern and southwestern Guangxi(Fig.4a,c).However,hotspots of integrated species complementarity had a more scattered distribution pattern, such that a few hotspots radiated into northwestern and northeastern China(Fig.4b).Compared with the more tightly clustered hotspots of integrated species richness,additional hotspot grid cells were found in southeastern Xizang,Hainan, and Taiwan based on weighted endemism (Fig.4c).
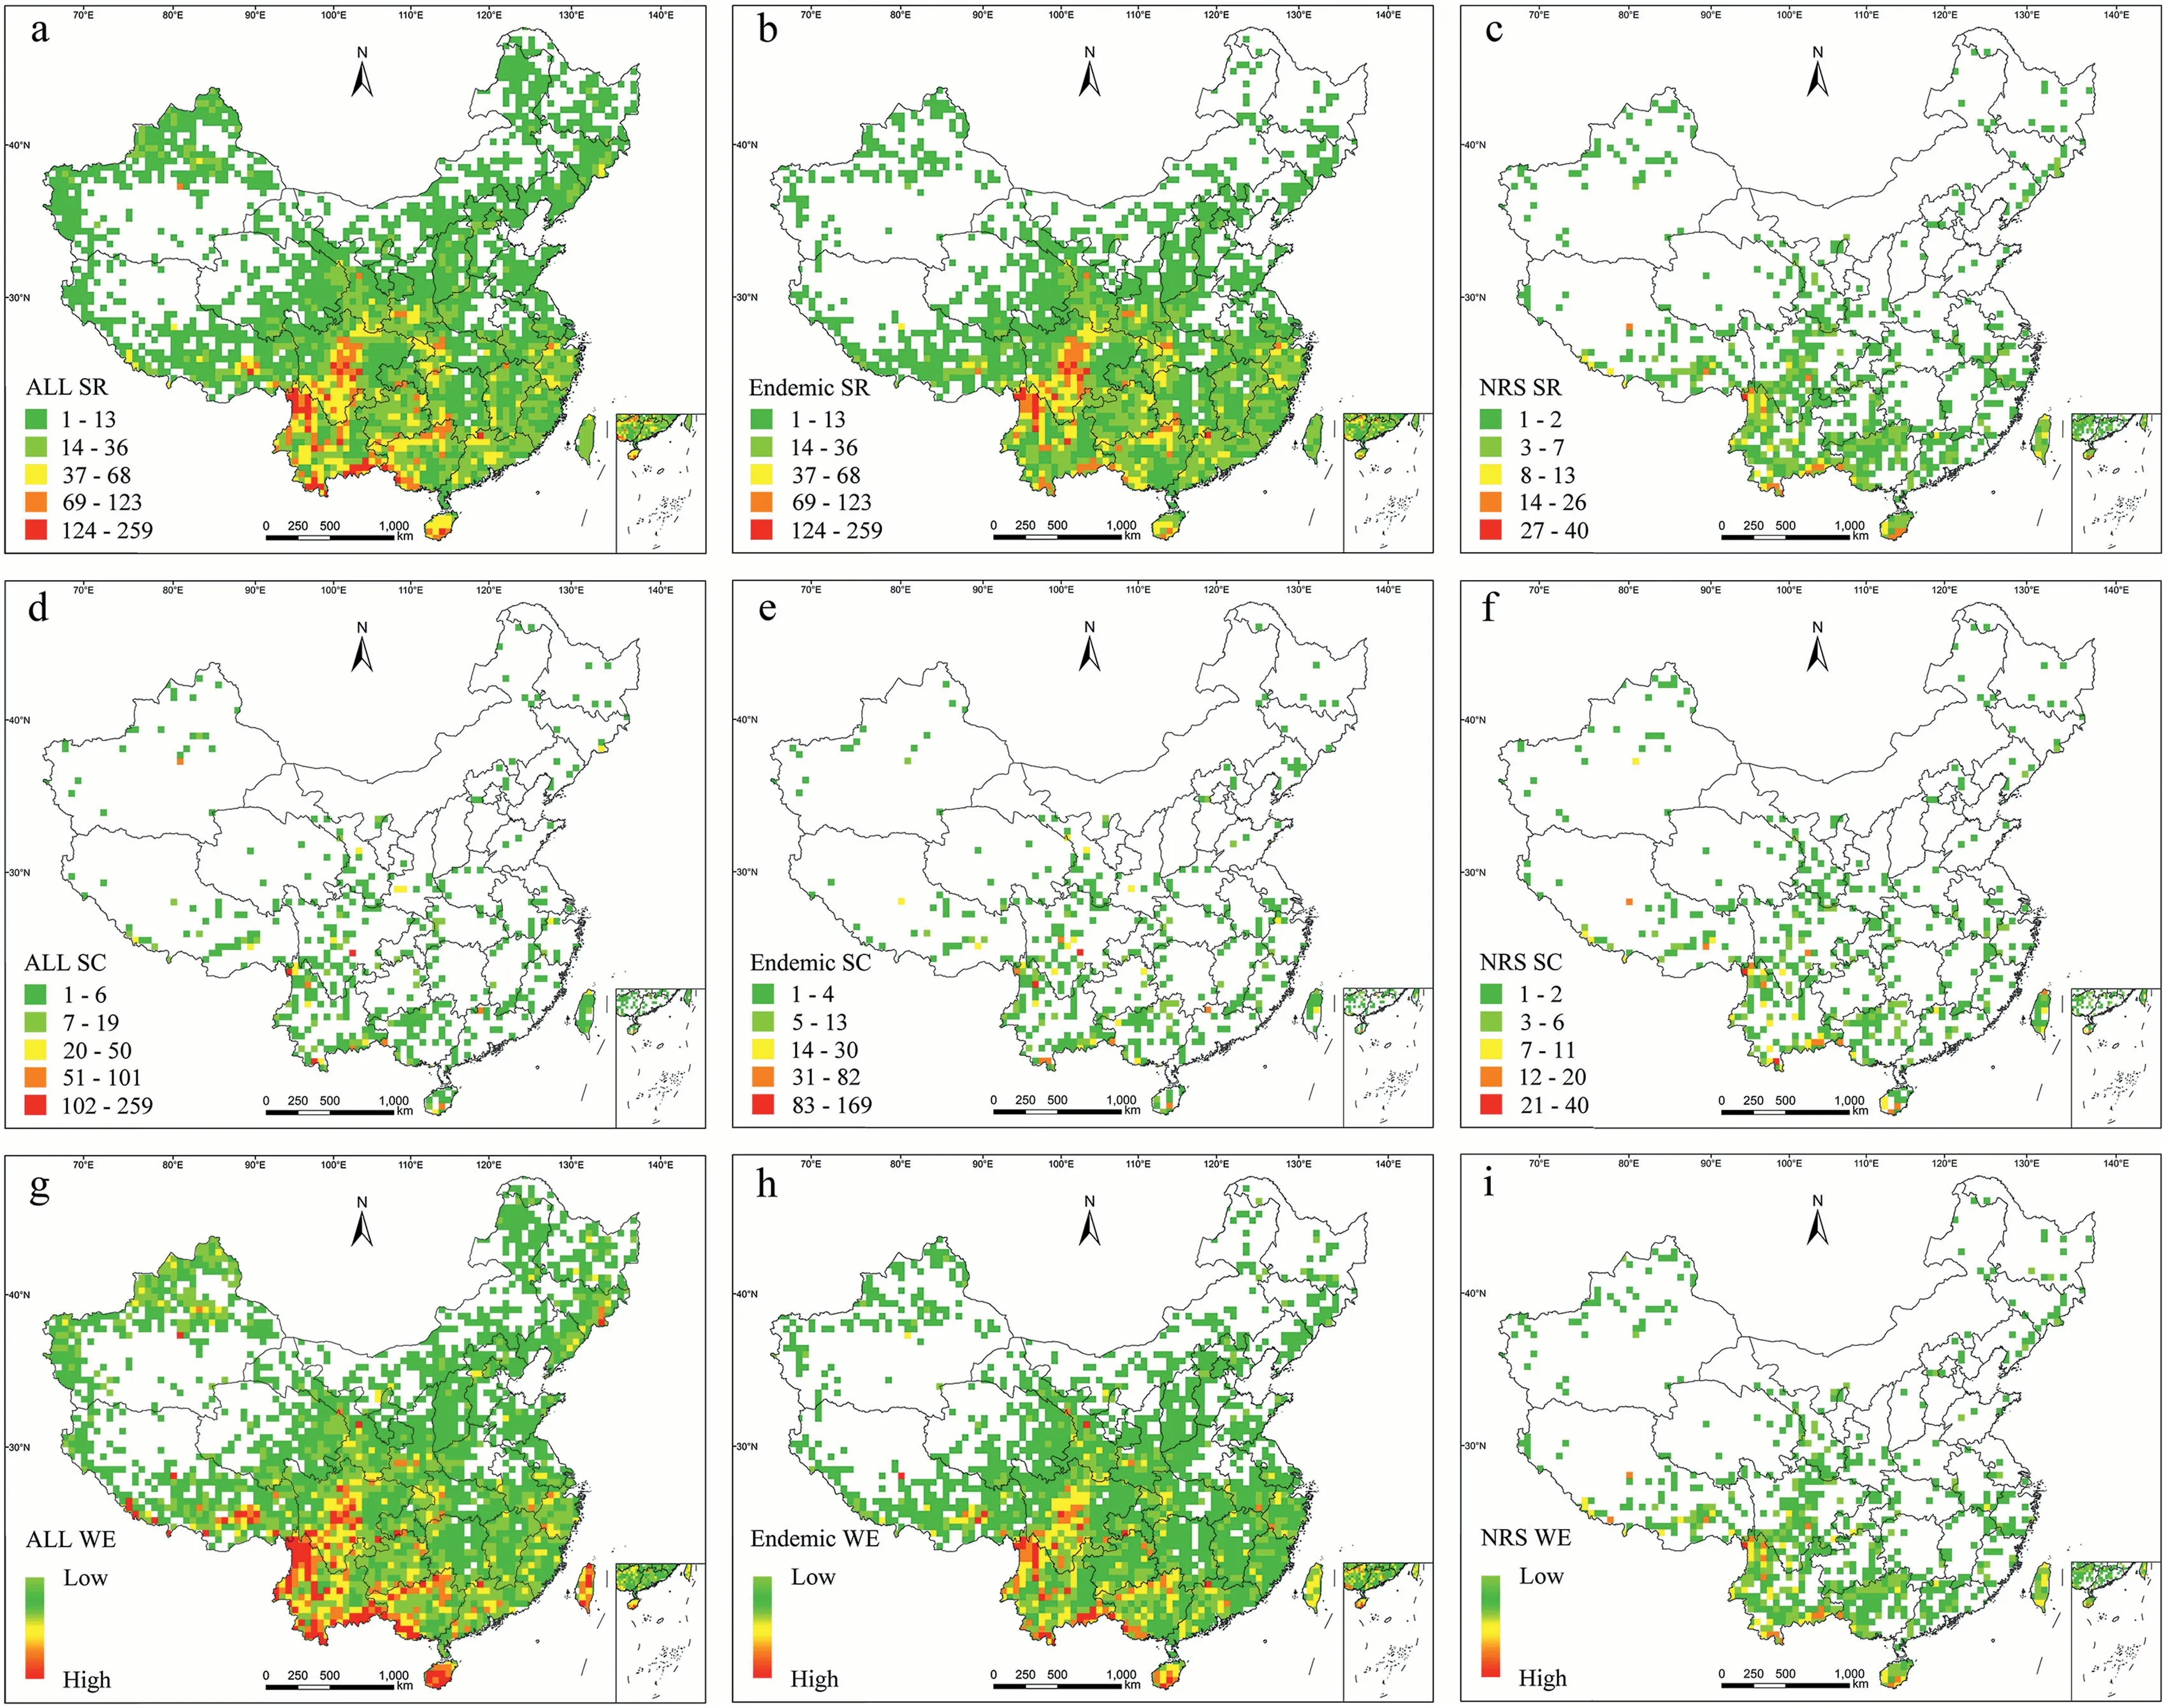
Fig.2.Distribution patterns of Near Threatened(NT) plants in China according to species richness(SR), species complementarity (SC),and weighted endemism (WE).(a)SR of all species,(b)SR of endemic species,(c)SR of narrow-ranged species(NRS),(d)SC of all species,(e)SC of endemic species,(f)SC of narrow-ranged species,(g)WE of all species,(h)WE of endemic species, and (i) WE of narrow-ranged species.
Finally,315 grid cells were identified as diversity hotspots of NT plants by overlaying the three types of hotspots described above;the resulting final hotspots contained 2312 of all NT plants, 1568 endemic NT plants, and 842 narrow-ranged NT plants (Table S7).Among the species identified in the final diversity hotspots, 87.2%,97.97%, and 93.12% of NT plants were located in hotspots of integrated species richness, species complementarity, and weight endemism, respectively(Table S7).Among the grid cells identified in the final diversity hotspots, 94 grid cells were identified by all three diversity indices, most of which were distributed in northwestern, southern, and southeastern Yunnan; central and southwestern Sichuan; and northern and southwestern Guangxi(Fig.4d).An additional 94 hotspot grid cells were confirmed by only two indices;many such cells were located in northwestern Yunnan;central Sichuan; and northern Guangxi (Fig.4d).Moreover, 127 hotspot grid cells were identified by only one index; these cells showed a scattered distribution pattern (Fig.4d; Table S8).
Based on the locations of mountains,rivers, and administrative divisions in China, the 315 diversity hotspot grid cells were classified into 17 diversity hotspot areas: (1) Tianshan Mountains, (2)Middle Himalaya, (3) Bend of the Yarlung Zangbo River, (4) Hengduan Mountains, (5) Qilian Mountains, (6) Qinling Mountains, (7)Daba-Wushan Mountains, (8) Dalou-Wuling Mountains, (9)Southern Guizhou and northern Guangxi,(10)Nanling Mountains,(11) Southwestern Yunnan, (12) Southeastern Yunnan, (13)Southwestern Guangxi, (14) Southwestern Guangdong, (15)Hainan, (16) Eastern China (17) Taiwan (Figs.4d, S2 and S6).
3.4.Conservation effectiveness and gaps of NT plants
Conservation effectiveness analysis showed that 69 of the 315 hotspot grid cells were located within national nature reserves,which contained 1524 of all NT plants,985 endemic NT plants,and 334 narrow-ranged NT plants (Table S9).Most hotspots in national nature reserves were located in southwestern Xizang;northwestern and southern Yunnan; central and northern Sichuan; and parts of Chongqing, Hunan, and Hubei (Fig.4e).In our assessment of the conservation effectiveness of provincial nature reserves, 38 of 315 hotspot grid cells were included, which contained 909 of all NT plants, 632 endemic NT plants, and 133 narrow-ranged NT plants(Table S9); these were mostly distributed in southeastern Xizang and northern Sichuan (Fig.S7).Among the 315 total hotspot grid cells,113 were included in national and provincial nature reserves,which contained 1746 of all species,1169 endemic species,and 453 narrow-ranged species (Table S9).The hotspots with national and provincial nature reserve coverage were mostly confined to southern Xizang; northwestern and southern Yunnan; central and northern Sichuan; northern and southern Guangxi; and parts of Chongqing,Shaanxi,Hubei,Hunan,Guangdong and Hainan(Fig.4f).

Fig.3.Correlogram of the distribution patterns of all Near Threatened plants (ALL), endemic Near Threatened plants (EN), and narrow-ranged Near Threatened plants (NRS)according to species richness (SR), species complementarity (SC), and weighted endemism (WE).All correlation coefficients were significant at P <0.01.
Conservation gaps of national nature reserves were mainly found in northwestern and southeastern Yunnan,central and southwestern Sichuan, northern and southwestern Guangxi, and eastern China(Fig.4e);these gaps contained 2090 of all NT plants,1430 endemic NT plants,and 666 narrow-ranged NT plants(Table S9).Provincial nature reserves covered some of the national reserve conservation gaps;which were located in southeastern Xizang and central Sichuan(Fig.S7).However,202 diversity hotspot grid cells were not protected by national or provincial nature reserves.These included 1999 of all NT plants,1354 endemic NT plants,and 597 narrow-ranged NT plants(Table S9).These grid cells were mainly located in northwestern and southern Yunnan,southwestern Sichuan,northern and southwestern Guangxi,and eastern China(Fig.4f).
3.5.Species composition of hotspots, conservation effectiveness,and gaps
The hotspots identified in this study covered only 7.9%of China's land area;they contained 94.68%of all NT plants,95.03%of endemic NT plants, and 88.26% of narrow-ranged NT plants (Table S7).National and provincial nature reserves covered 34.50%and 31.84%of the grid cells,respectively;national nature reserves contained more species, compared with provincial reserves (Fig.5; Table S9).National and provincial nature reserves together covered 55.1%of the grid cells;they contained most NT plants(Fig.5;Table S9).
In terms of the conservation effectiveness of NT plants diversity hotspots, national nature reserves played a greater role than did provincial nature reserves; national reserves contained 334 narrow-ranged species (first level), 751 endemic species (second level), and 439 remaining species (third level), while provincial reserves included 133 narrow-ranged species (first level), 525 endemic species (second level), and 251 remaining species (third level).The combined conservation effectiveness of national and provincial nature reserves was greater than the individual effectiveness of specific reserve types;this covered 453 narrow-ranged species (first level), 836 endemic species (second level), and 457 remaining species (third level) (Fig.6; Table S10).
Compared with the combined conservation effectiveness of national and provincial nature reserves,a large number of NT plants remained in the individual conservation gaps of national or provincial nature reserves.The conservation gaps of national nature reserves contained 666 narrow-ranged species (first level), 905 endemic species (second level), and 519 remaining species (third level).Compared with the conservation gaps of national reserves,the gaps of provincial nature reserves contained more species;they included 798 narrow-ranged species (first level), 927 endemic species (second level), and 539 remaining species (third level).Moreover, the conservation gaps of combined national and provincial reserves contained 597 narrow-ranged species (first level),890 endemic species (second level), and 512 remaining species(third level) (Fig.6; Table S10).
4.Discussion
This study presents the first overall NT plants richness distribution pattern based on high-resolution network analysis with extensive precise occurrence data and estimated the conservation effectiveness of current conservation networks.Our results can support optimization of conservation networks and development of conservation strategies for NT plants.
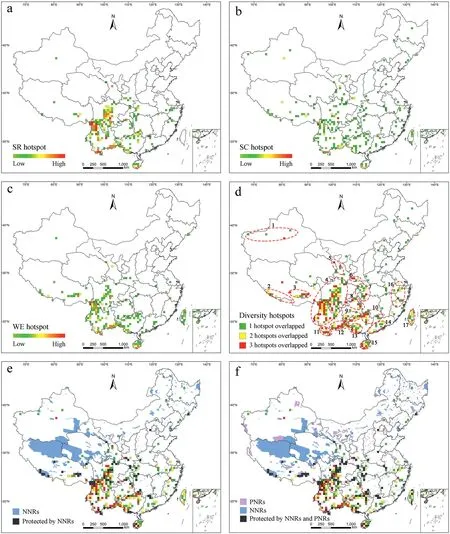
Fig.4.Hotspots and conservation effectiveness and gaps for Near Threatened plants.(a)Hotspots of species richness(SR),(b)hotspots of species complementarity(SC),(c)hotspots of weighted endemism(WE),(d)diversity hotspots identified by overlaying the hotspots of SR,SC,and WE,(e)overlap of national nature reserves(NNRs) with diversity hotspots,and(f)overlap of national nature reserves(NNRs)and provincial nature reserves(PNRs)with diversity hotspots.Red dotted circles denote 17 diversity hotspot areas:(1)Tianshan Mountains, (2) Middle Himalaya, (3) Bend of the Yarlung Zangbo River, (4) Hengduan Mountains, (5) Qilian Mountains, (6) Qinling Mountains, (7) Daba-Wushan Mountains, (8)Dalou-Wuling Mountains,(9)Southern Guizhou and northern Guangxi,(10)Nanling Mountains,(11)Southwestern Yunnan,(12)Southeastern Yunnan,(13)Southwestern Guangxi,(14) Southwestern Guangdong, (15) Hainan, (16) Eastern China (17) Taiwan.
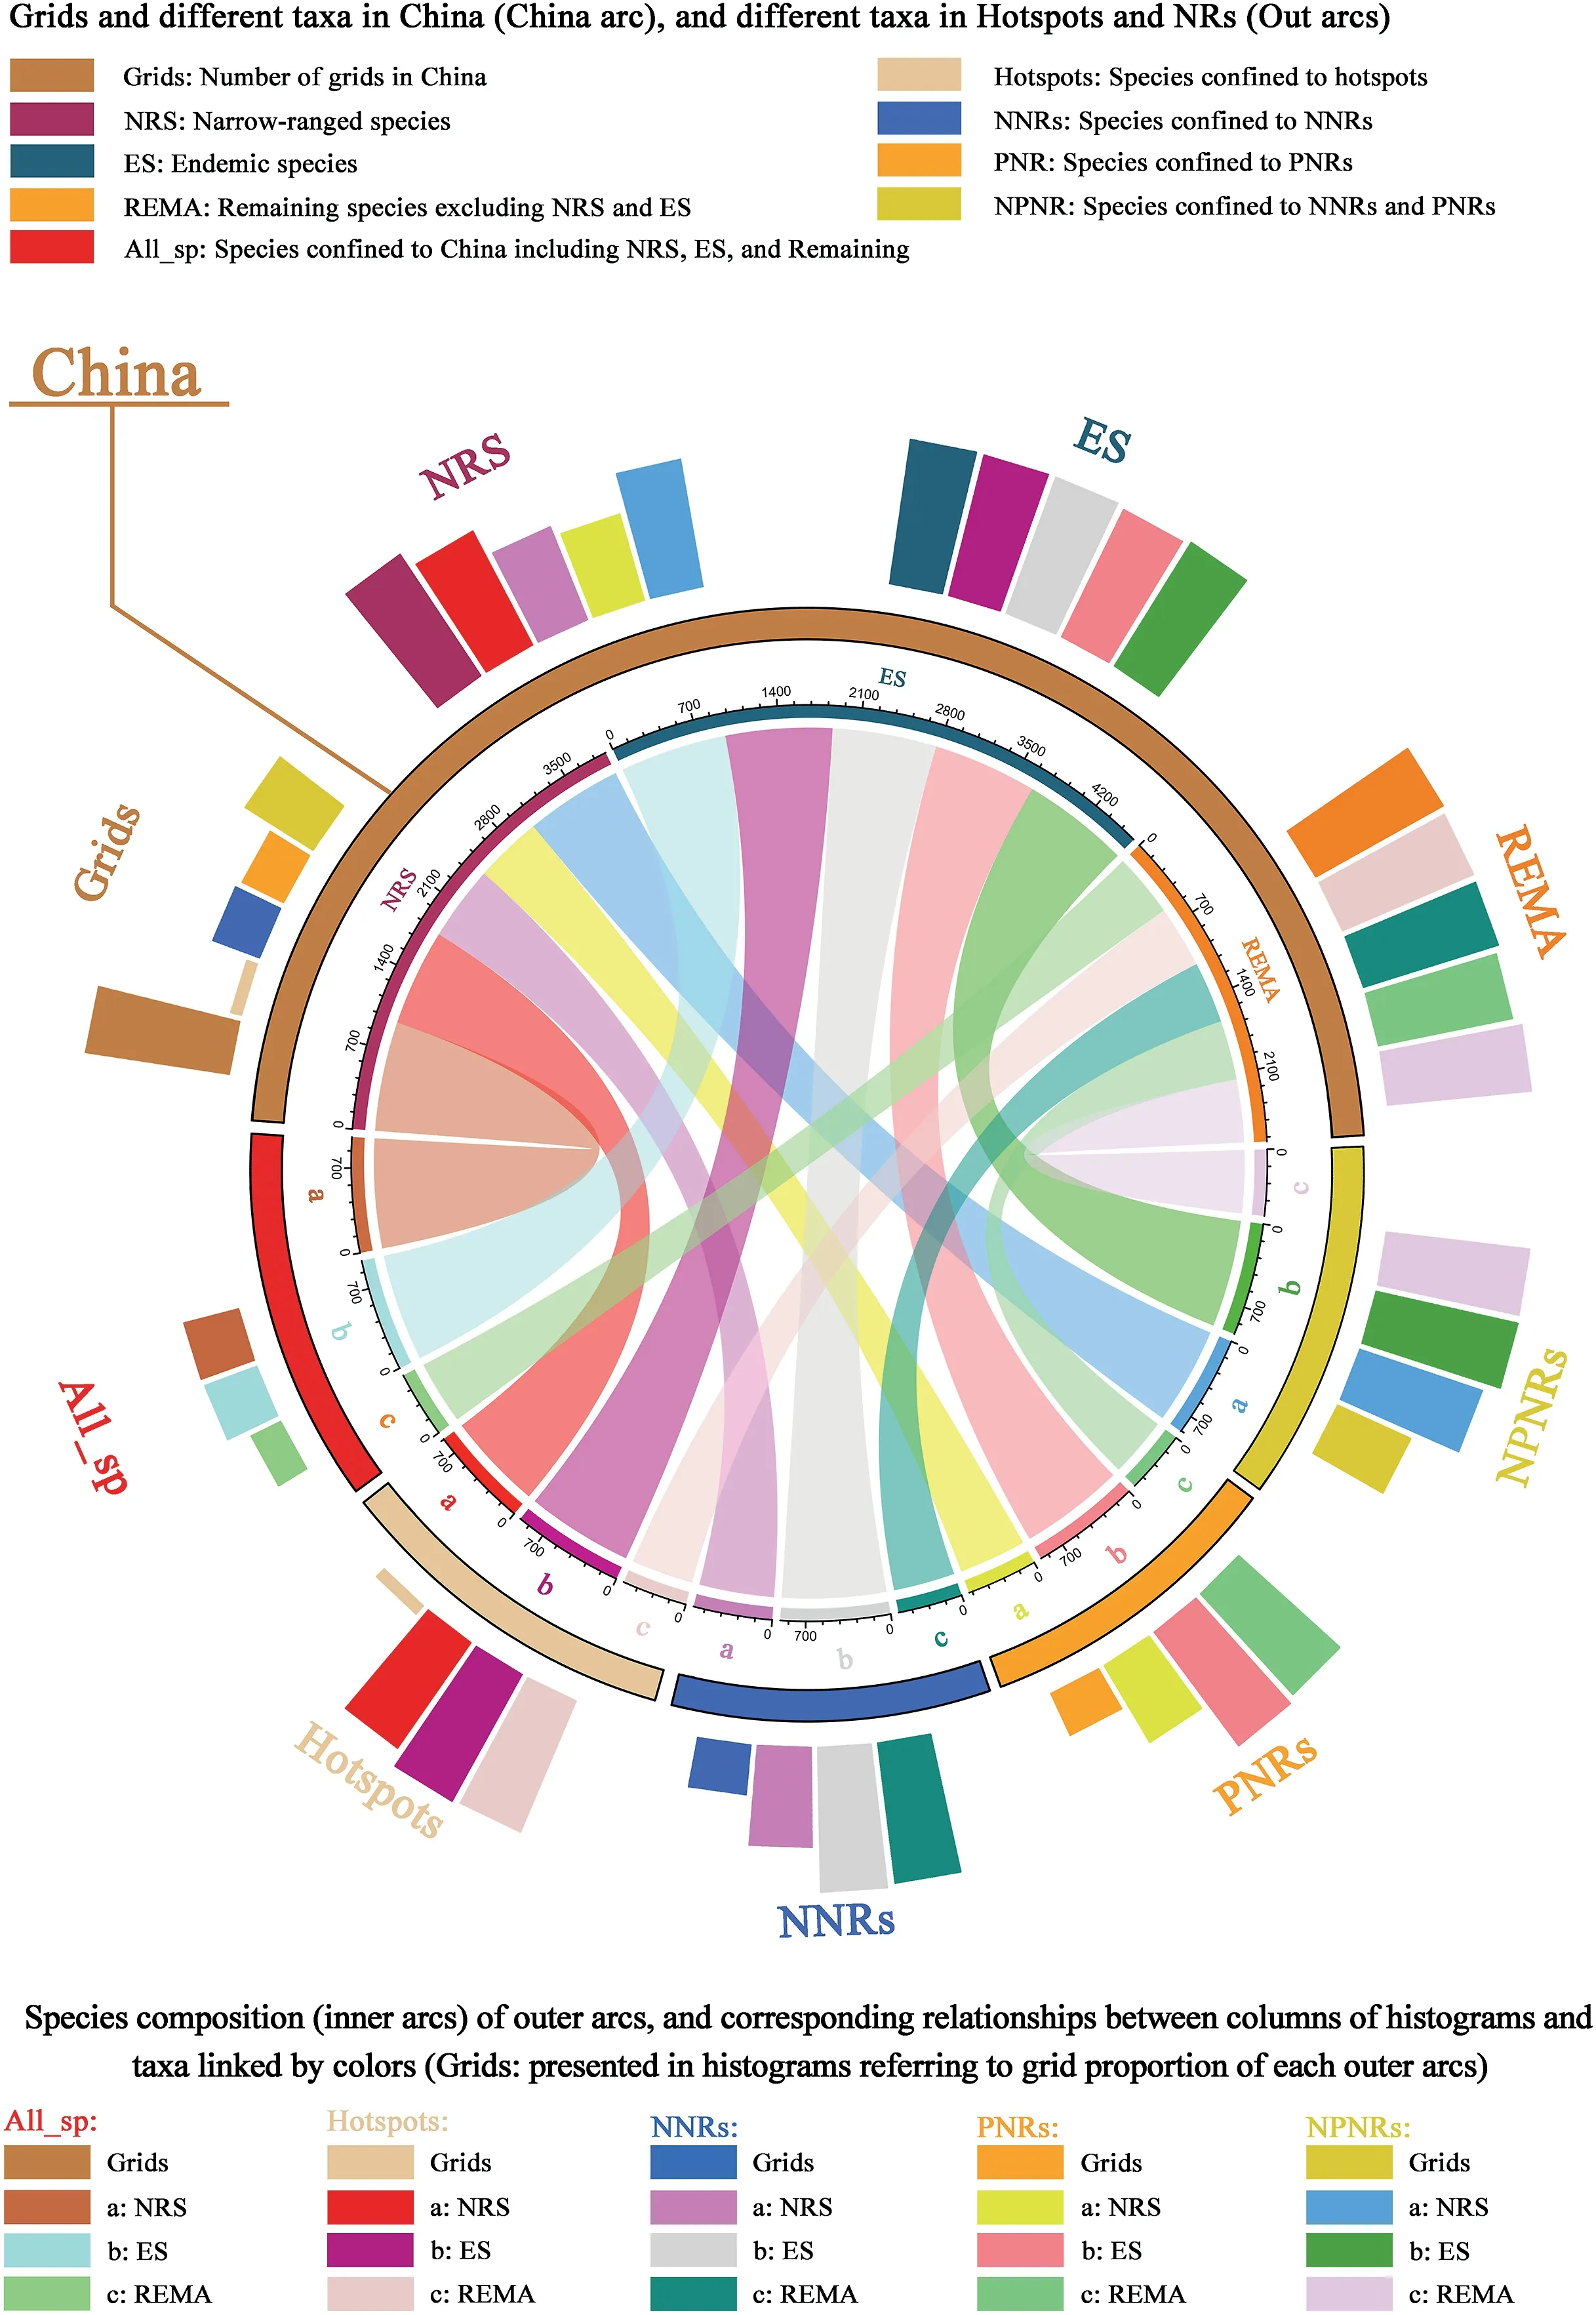
Fig.5.Chord diagram and circular bar plot showing the numbers of different levels of NT plants(NRS,ES,REMA)in hotspots,national nature reserves(NNRs),and provincial nature reserves(PNRs).Inner arc colors are identical to circular bar plot and represent the same plant categories.Colored segments in inner arcs represent numbers of species of certain categories, or different species numbers of certain categories in different areas.
4.1.Importance of NT plants diversity hotspots for conservation priority
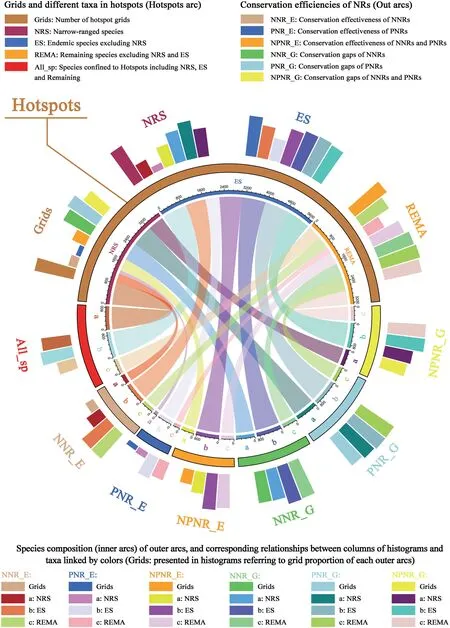
Fig.6.Chord diagram and circular bar plot showing diversity hotspots, as well as grid cells of effective conservation and gaps in nature reserves by species.Inner arc colors are identical to circular bar plot and represent the same plant categories.Colored segments in inner arcs represent numbers of species according to category and area.
The identification of hotspot areas is crucial for the development of biodiversity conservation plans because these key biogeographic regions generally have high levels of species richness, habitat loss,endemism, and threatened status (Reid,1998; Myers et al., 2000).Although the hotspots identified in this study cover only 7.9% of China's land area, they contain 94.68% of NT plants, 95.03% of endemic NT plants,and 88.26%of narrow-ranged NT plants,and are thus essential for conservation planning and prioritization for NT plants.The distribution patterns of these hotspots showed that most occur in southwestern and southern China (Fig.4d), which may be related to the complex topography of these regions-plate collisions can accelerate speciation and differentiation, thereby increasing species richness (Qian and Ricklefs, 1999).Therefore,conservation measures should focus on southwestern and southern China based on the distribution patterns of NT plants hotspots.Additionally, comparing our results with the latest assessments(Qin et al.,2021),we found that species’threatened status was not static(Fig.1)maybe due to changes in threat factors and increasing knowledge about NT species.The shift of 89 NT plants in 2013 to threatened categories in 2021 highlights the conservation need for NT species because these species are confronted with relatively high threatened risk.Furthermore,2.2% NT were also assessed as in the DD category due to absence in species information.Therefore,further field conservation and monitoring should be initiated for those species to conduct a thorough investigation of their conservation status.These species are indeed of concern,because they are different from LC species.Moreover, due to changes in species delimitation,there are still a large proportion of NT species remaining in uncertain threatened categories, indicating that many species listed in the officially issued red lists still need further taxonomic study.It is certainly encouraging that about 12.86%NT species were assessed as LC species.Nevertheless,there is also a large proportion of NT species(10.37%)facing upgrading to threatened categories,or being data deficient,and needing taxonomic revision.So, more efforts focusing on field investigation and taxonomic studies,as well as developing corresponding protection countermeasures are needed for NT species in conservation priority.
Upon comparison of our results with the hotspots identified for threatened plants in China (Xue et al., 2022), we found that the hotspots of NT plants are highly consistent with those of threatened plants, such as northwestern, southern and southeastern Yunnan;northern and southwestern Guangxi; Taiwan; and Hainan.However, some hotspots in northeastern and northwestern China and Xizang showed some inconsistency with the hotspots of threatened species(Fig.4d).The hotspots of NT plants also coincided with most of the hotspots of Chinese endemic plants, rare and endangered plants and woody plants (Huang et al., 2016; Zhao et al., 2016; Xu et al., 2019; Cai et al., 2020).This finding confirmed that hotspots of NT plants are highly representative and useful for identifying conservation priority areas.Because this study used a large amount of precise occurrence data, rather than coarse county-level distribution information, we achieved a clearer representation of the overall distribution patterns of NT plants, thereby elucidating the distribution pattern of species richness and supporting priority conservation planning.Furthermore,we found that most NT plants are also endemic (67.57%) and narrow-ranged species (39.07%).Therefore,the value of NT plants for diversity conservation should not be overlooked.This study identified new areas with dramatically high values of species complementarity and weighted endemism, including central Gansu (Qilian Mountains); central to western Xinjiang (Tianshan Mountains); central Xizang; and eastern Xizang (Bend of the Yarlung Zangbo River) (Fig.4d).Therefore,the NT plants hotspots identified in this study should be carefully considered in future conservation priority planning.
4.2.Optimization of conservation networks for NT plants
Nature reserves in China currently cover approximately 14.9%of the country's land area (MEP, 2016) and play an important role in biodiversity conservation (Gao et al., 2019; Xia et al., 2022).However, previous studies have noted that the effectiveness of their conservation objectives is insufficient, especially for certain plant groups(Wu et al.,2011;Xue et al.,2021;Yang et al.,2021).Analysis of conservation effectiveness indicated that the nature reserve network currently covers 35.87% of NT plants diversity hotspots,while conservation gaps remain in northwestern, southwestern,and southeastern Yunnan; southwestern Sichuan; and northern and southwestern Guangxi(Fig.4f)-these regions contained 1999(81.86% of the total) NT plants.Previous studies also identified conservation gaps in these regions for endemic seed plants,threatened plants, and rare and endangered plants (Zhang et al.,2015a; Huang et al., 2016; Xu et al., 2019; Xue et al., 2022).The future enhancement of conservation networks in these areas will improve the conservation effectiveness of NT plants by slowing or reducing their extinction risk, while improving the conservation status of threatened, endemic, and rare and endangered species distributed in existing nature reserves.These changes will facilitate better conservation effectiveness in terms of plant diversity in China.
We considered the compositional characteristics of NT plants,especially the high proportions of endemic and narrow-ranged species that are not protected by the current conservation network.In addition to strengthening the management of the current conservation network, there is a need to consider establishment of new nature reserves or sites to protect scattered hotspot grid cells with high species diversity and distinctiveness.Conservation gaps are largely confined to southwestern China and the boundary areas of southern China,and therefore,conservation efforts in these areas should be prioritized.In particular, the coverage of provincial nature reserves should be increased because the complementary role of provincial nature reserves in conservation is limited in areas with high concentrations of hotspots.In addition,for the protection of narrow-ranged or endemic NT plants,conservation efforts (e.g., expansion of existing nature reserves,establishment of new reserves, and ex situ conservation projects)should be considered to address the limited conservation effectiveness of current reserve networks for NT plants.
4.3.Targeted conservation of NT plants
In this study, 29.84% of total diversity hotspot grid cells were identified by all three indices.These areas are characterized by high spices richness, complementarity, and endemism.Such hotspots should be regarded as the most important areas for biodiversity conservation of NT plants, and additional resources and countermeasures should be devoted to these areas.However, hotspots identified by one or two indices were also important because each index highlights distinct biodiversity characteristics (Xu et al.,2017).For example, most hotspots in northwestern, southwestern,and southeastern Yunnan;as well as southern Hainan,are threatened because of the limited distribution ranges of NT species.Moreover, many hotspots in eastern China, central China; and northeastern China were identified based on species complementarity and weighted endemism, rather than species richness.For example, NT plants hotspots were distributed in eastern China,which is known as a center of paleo-endemism(Zhang et al.,2022)and functions as a museum of herbaceous genera and a cradle for woody genera (Lu et al., 2018).Therefore, considering the important properties of biodiversity conservation for NT plants, conservation measures should be targeted and prioritized to promote conservation effectiveness.
5.Conclusion
In this study,we not only identified the diversity hotspots of NT plants, but also evaluated conservation effectiveness in current nature reserves based on a large amount of precise occurrence data.Comparing the NT plant lists of 2013 and 2021, there was a large variation in species composition in NT plants.Compared with the latest assessment results, a significant mumber of NT species upgraded into threatened categories, or assessed as DD species,or facing changes in species circumscription.The results indicated that the diversity hotspots of NT plants were mainly confined to southwestern and southern China with limited conservation, and there are still numerous hotspots in southwestern China identified as conservation gaps.Given that NT plants include large proportions of endemic and narrow-ranged species,they represent an important value in conservation priority.Therefore, these plants are experiencing insufficient conservation effectiveness and need more concern to improve the effectiveness of future NT plants conservation.
Author contributions
Q.L.and T.T.X.performed material preparation, methodology and software, wrote the initial draft of the manuscript; X.X.Z.performed data collection, methodology and wrote the manuscript;X.D.Y.performed methodology and software; F.Q.and W.D.Z.conducted investigation and data collection; L.W.performed manuscript revision; and R.W.B performed material preparation,methodology and manuscript revision;S.X.Y.designed and directed the study, performed material preparation, methodology and manuscript revision.All authors contributed to the study conception and design, reviewed the manuscript, read and approved the final manuscript.
Declaration of competing interest
The authors declare that they have no known competing financial interests or personal relationships that could have appeared to influence the work reported in this paper.
Acknowledgements
We are thankful to the Chinese Virtual Herbarium (CVH) and Global Biodiversity Information Facility (GBIF) for permission to access species distribution data.This work was supported by the National Natural Science Foundation of China (32071654), The Biodiversity Survey and Assessment Project of the Ministry of Ecology and Environment, China (2019HJ2096001006) and Biodiversity Survey,Observation and Assessment Program of Ministry of Ecology and Environment of China (8-3-7-20-9).
Appendix A.Supplementary data
Supplementary data to this article can be found online at https://doi.org/10.1016/j.pld.2023.02.005.
杂志排行
植物多样性的其它文章
- Honoring a legend: Celebrating the life and legacy of Professor Heng Li
- The life of Xuan Zhou, founding father of the Gastrodia elata cultivation and industry in China
- Siwalik plant megafossil diversity in the Eastern Himalayas: A review
- Global patterns of taxonomic and phylogenetic diversity of flowering plants: Biodiversity hotspots and coldspots
- Insights into cryptic speciation of quillworts in China
- Patterns of floristic inventory and plant collections in Myanmar
