Prediction of Total Output Value of Construction Industry in Jiangxi Province Based on Grey Prediction Model
2023-06-28LeXUYuanguiLIU
Le XU, Yuangui LIU
1. School of Architecture and Art, Jiangxi Industry Polytechnic College, Nanchang 330000, China; 2. Jiangxi Tianchi Highway Technology Development Co., Ltd., Nanchang 330000, China
Abstract In order to realize the accurate prediction of the total output value of construction industry in the future, the grey prediction model is used to compare the measured value with the predicted value from 2012 to 2021, and based on the existing data, the total output value of construction industry in Jiangxi Province in the next five years is predicted. The results show that the grey prediction model has a good prediction effect, and the error between the predicted value and the measured value is within 14%, which provides a basis for policy adjustment and resource optimization.
Key words Jiangxi Province, Grey prediction model, Total output value of construction industry, Forecast
1 Introduction
Construction industry is an important industry to promote the rapid growth of national economy, promote social progress and improve people’s living conditions. Its total production expressed by value in a certain period of time is called the total output value of construction industry. It is an important part of the national economic system and plays an important role in local economic development. The construction industry in Jiangxi Province has broad development space, so it is necessary to accurately predict the total output value of the construction industry in the next few years, so as to lay the foundation for policy adjustment and resource optimization. At present, the commonly used prediction methods of total output value of construction industry include linear regression model, ARIMA model, GM (1, 1) grey prediction model and so on.
Linear regression analysis is used to predict the future development trend based on the existing data by constructing linear regression equation. The calculation is simple, convenient and quick, but for non-linear and non-stationary data, the linear regression analysis method will lead to large error and deviation from the measured value. This method is only suitable for linear conditions, with great limitations, and the prediction effect is poor when the number of samples is small[1].
ARIMA model uses stochastic process analysis to describe the development trend of things, and can achieve the optimal prediction in the sense of minimum variance by repeated revision until a satisfactory model is obtained[2]. However, this model requires the stability of time series data and cannot capture the non-linear relationship.
Grey prediction model has the advantages of requiring less data samples, less information and having convenient calculation, so it is widely used in uncertain systems with "small samples and lack of information". This model can predict the data series with short time and few data, and the prediction results are accurate, so it has been successfully applied in many fields[3]. Ma Caiyunetal.[4]used grey prediction model to predict the output of construction waste in Fujian Province, providing ideas for resource optimization. Bai Dandan[5]took the GDP of Gansu Province from 2013 to 2017 as the training data, and predicted the economic structure and economic growth of Gansu Province from 2018 to 2020 based on the grey prediction model.
The total output value of construction industry is affected by many uncertain factors, such as macroeconomic environment, industrial policy, production factors, scientific and technological development degree[6]. The construction industry system is a grey system, which can be predicted by GM (1, 1) model.
2 Prediction model of total output value of construction industry
2.1 Establishment of grey GM (1, 1) modelThe grey prediction model is based on the known random variables in the grey system, and accumulates these discrete data to get a group of regenerated and regular time series. Then, based on these data, the required mathematical model is established, and then the prediction data is obtained.
Let the discrete time series of total output value of construction industry in Jiangxi Province be:X(0)={X(0)(1),X(0)(2), L,X(0)(n)}, there arenobserved values, and a new time series is generated by accumulation:X(1)={X(1)(1),X(1)(2), L,X(1)(n)}, the specific steps are as follows:


(1)
whereais called development coefficient anduis called endogenous control coefficient;

(2)
The discrete value (t0=1) of equal spacing sampling is as follows:
(3)

(4)
(5)
Then:Y=BU
(6)
It is estimated by the least square method:
(7)

(8)
2.2 Model error test(i) Calculate the residual error and relative error of the prediction result, as shown in Equation (9):
(9)
(ii)Calculatethevarianceofstandarddeviationandtheprobabilityofsmallerror,asshowninEquation(10):
(10)
Calculate the variance ratio:
(11)
Calculate the probability of small error:
(12)

2.3 Model accuracy analysisThe accuracy of the established grey prediction model is analyzed. Only by meeting the calculation accuracy requirements of the prediction model can the prediction results be correctly predicted. The accuracy of prediction model is generally divided into the following four levels, as shown in Table 1.

Table 1 Calculation accuracy level of prediction model
3 Prediction and analysis of the total output value of Jiangxi construction industry
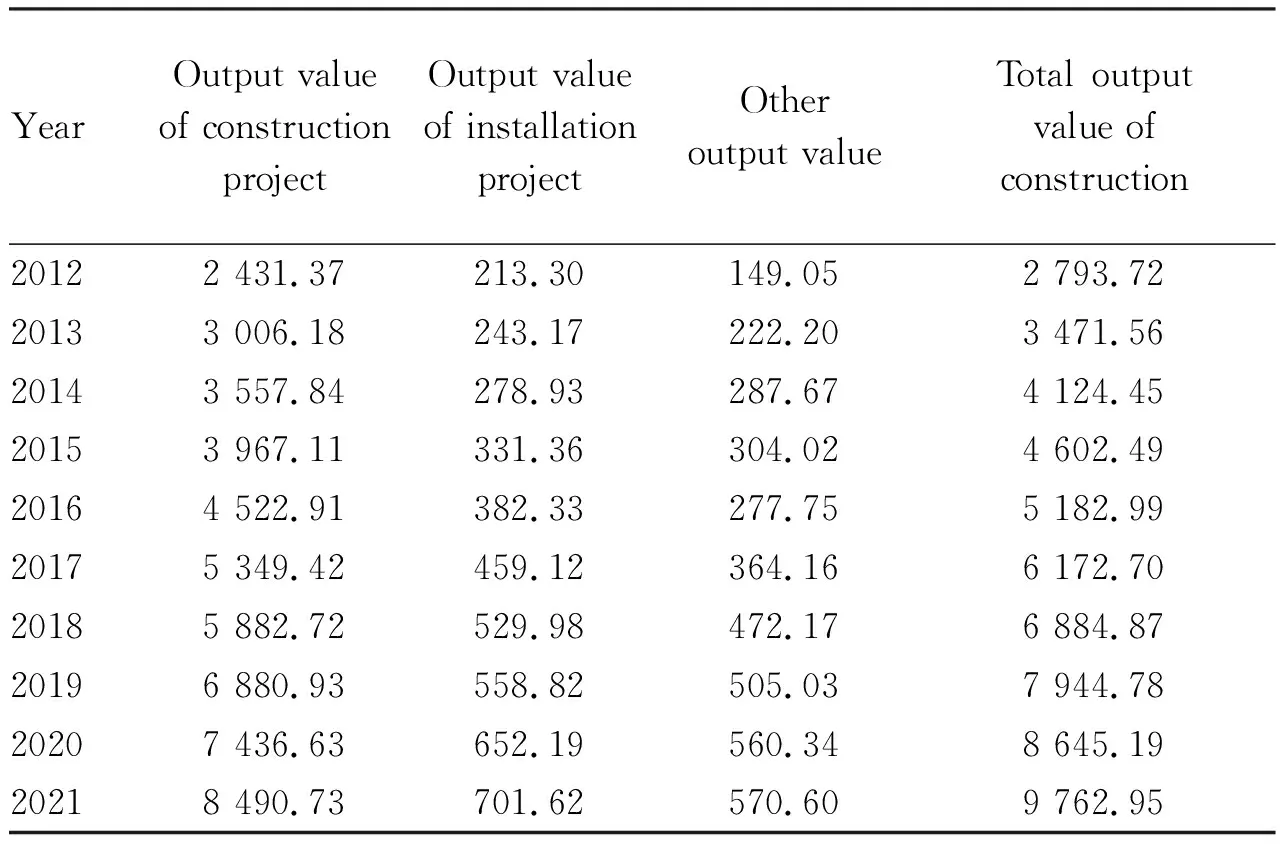
By consultingJiangxiStatisticalYearbookandChinaStatisticalYearbook, the total output value data of construction industry in Jiangxi Province from 2012 to 2021 are collected, as shown in Table 2.

Table 2 Statistics of total output value of construction industry in Jiangxi Province from 2012 to 2021 108 yuan
3.1 Forecast and calculation of total output value of construction industry in Jiangxi Province by GM (1, 1) model
(i) The original data series of the total output value of construction industry in Jiangxi Province from 2012 to 2021 isX(0)(t)=(2 793.72, 3 471.56, 4 124.45, 4 602.49, 5 182.99, 6 172.70, 6 884.87, 7 944.78, 8 645.19, 9 762.95).
(ii) The series are accumulated in turn to generate a new data series,X(1)(t)=(2 793.72, 6 265.28, 10 389.73, 14 992.22, 20 175.22, 26 347.92, 33 232.79, 41 177.57, 49 822.76, 59 585.71).
(iii) Quasi-smoothness test is carried out on the original dataX(0)(t), and the results are shown in Table 3.

Table 3 Test values of quasi-smoothness
Whent>3, 1<σ(1)(t)<1.5, it shows that the quasi-smoothness test meets the conditions.
Check whether the data serieshas quasi-exponential law, and the results are shown in Table 4.

Table 4 Quasi-exponential test values
Whent>3, 1<σ(1)(t)<1.5, it shows that the quasi-exponential law test meets the conditions.
To sum up, after quasi-smoothness and quasi-exponential law test, it meets the requirements of grey prediction model, and this method can be used for prediction.
The differential equation is established according to the dataX(1), and the grey prediction model is established by MATLAB programming. The general solution of GM (1, 1) model is shown in Equation (13), the development coefficientais -0.146 1 and the endogenous control coefficientuis 1 235.002. Therefore, the specific calculation response equation for the prediction of the total output value of construction industry in Jiangxi Province is shown in Equation (13):
(13)
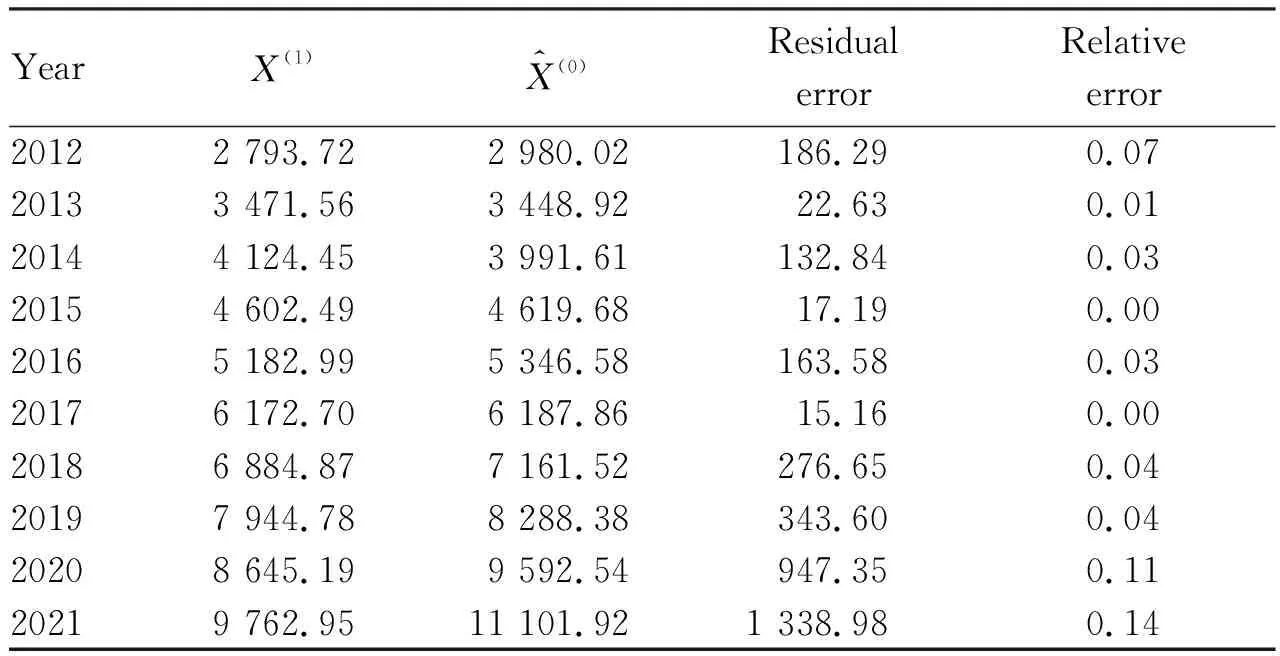
After processing the programming results of MATLAB, the residual error and relative error between the actual value and the predicted value of the total output of construction industry in Jiangxi Province from 2012 to 2021 are shown in Table 5.

Table 5 Test, calculation and analysis of prediction model of total output value of construction industry in Jiangxi Province from 2012 to 2021
It is calculated that variance ratioCis 0.191 4, small error probabilityPis 1 (C<0.35,P>0.95 according to the calculation accuracy level of prediction model), therefore, the prediction model accuracy level is excellent (Level 1).
3.2 Prediction and analysis of total output value of construction industry in Jiangxi Province from 2012 to 2026
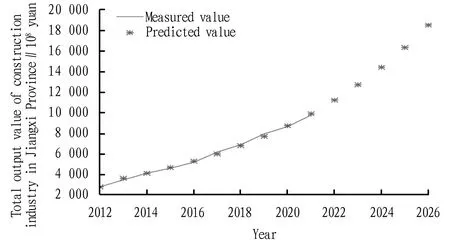
Based on the data from 2012 to 2021, the grey prediction model is established by MATLB programming, and the total output value of construction industry from 2022 to 2026 is predicted. The prediction results are: 1 121.385 billion yuan in 2022; 1 271.068 billion yuan in 2023; 1 440.73 billion yuan in 2024; 1 633.039 billion yuan in 2025; 1 851.016 billion yuan in 2026. The simulation diagram is shown in Fig.1.

Fig.1 Trend of total output value of construction industry in Jiangxi Province from 2012 to 2026
According to the prediction, the total output value of construction industry in Jiangxi Province will reach 1 271.068 billion yuan in 2023, exceeding the scheduled target of 9% increase in the output value of construction industry in Jiangxi Province, and will continuously, rapidly and steadily increase in the next five years. The prediction results show that the grey prediction model has a good effect.
4 Conclusion
Based on the grey GM (1, 1) model, this paper tests and calculates the total output value of construction industry in Jiangxi Province from 2011 to 2021, and predicts the total output value from 2022 to 2026, and obtains good prediction results. The prediction results of this paper are helpful for Jiangxi provincial government to accurately control the development of construction industry, formulate more reasonable development goals, and provide a basis for Jiangxi Province to further formulate regional development plans and related policies of construction industry.
杂志排行
Asian Agricultural Research的其它文章
- Intellectual Property Protection and High-quality Development of Grape Industrial Clusters in Xinjiang
- Responses of Carbon Sink of Ecosystem Vegetation to Land Use Changes in Kunming City
- Preliminary Study on in Vitro Germination of Yangmei Pollen
- Effects of Different Dwarfing Rootstocks on Growth, Yield and Fruit Quality of ‘Tianhong 2’ Apple Trees
- Impacts and Demonstration Effects of Applying Long-acting Slow-release Fertilizer on Economic Yield of Peanut
- Silage Fermentation Technology and Its Effects on Growth Performance of Local Pigs
