底栖动物功能多样性度量的功效分析
2023-04-29李杨杨顺益罗宏伟陈静潘文杰潘保柱蒋万祥
李杨 杨顺益 罗宏伟 陈静 潘文杰 潘保柱 蒋万祥
摘要:基于性状度量群落功能多样性需要构建多维空间,品质差的功能空间可能导致其多样性计算偏差。为分析功能空间对底栖动物多样性度量的准确性,研究物种数对功能空间品质的影响,以山东省新薛河为例,使用均方差评估了各维度功能空间品质,利用河段和河流尺度物种差异以及模拟不同大小物种库的方式,分析了物种数对多维功能空间的影响。结果显示:(1)新薛河底栖动物性状构建了14个维度(D)的功能空间,其中5D和6D的功能空间均方差最低(均为0.18%)、品质最优;高于6D的功能空间,物种间的差异多被高估;低于5D的功能空间,物种间的差异多被低估;(2)在河流和河段尺度上,5D功能空间的均方差最低、品质最优;(3)物种库的物种数在20~40种时,4D功能空间均方差值最低的频数最多;物种数在50~90种时,5D功能空间均方差值最低的频数最多;4D~6D功能空间均方差最低的频数最高,占比70%以上。研究表明,新薛河底栖动物性状的5D和6D功能空间品质最优,河段和河流尺度物种差异以及物种库大小对多维功能空间特征和品质的影响有限。
关键词:底栖动物;功能多样性;多维功能空间;新薛河
中图分类号: Q145 文献标志码:A 文章编号:1674-3075(2023)01-0049-07
功能多样性是揭示物种共生、群落构建机制以及群落多样性与生态系统功能关系等研究的重要手段(Goswami et al, 2017; Mammola et al, 2021);功能多样性指数以性状(主要是生物学性状和生态学性状)为基础,结合物种丰度数据度量性状在种间和种内的变化(Zhu et al, 2017; Hordley et al, 2021)。多数功能多样性指数首先需要确定物种在功能空间的位置及分布特征,常用方法包括系统树(dendrogram)和多维功能空间(multidimensional functional spaces)(Villéger et al, 2008)。相较于系统树的方法,更多的研究倾向于用多维功能空间的方法确定物种在功能空间的位置及其分布特征,进而度量功能多样性(Martini et al, 2021)。多维功能空间由性状构建,首先利用“物种×性状”矩阵获得“物种×物种”距离矩阵,然后利用距离矩阵构建反映物种差异的多维功能空间,功能多样性指数用物种在多维功能空间的位置参数与物种丰度数据计算得出(Maire et al, 2015)。多维功能空间的维度是指性状变化因素或潜变量(Lee & Verleysen, 2009; Campadelli et al, 2015),即性状构建的多维功能空间独立主轴(Laughlin, 2014)。对于仅包含连续数值型性状的生物群落,多维功能空间由性状直接得到(即每个主轴代表一个性状)(Laliberté & Legendre, 2010; Maire et al, 2015)。性状间多存在着相关性,基于特定性状组合度量功能多样性时,在低维度的功能空间内物种差异过低,在高维度的功能空间内物种差异因冗余而放大,进而影响功能多样性的度量准确性(Villéger et al, 2011; Carscadden et al, 2017)。
底栖动物是河流生态系统的重要组成部分,是生态系统结构和功能、食物网中的重要群落(汪兴中等, 2021),也是河流生物监测与评价中应用最广泛和最普遍的群落之一(渠晓东等, 2021);其功能多样性指数具有对环境胁迫响应敏感和可预测等特点,近年来逐渐被应用于淡水生态系统的生物评价研究(Menezes et al, 2010; Saito et al, 2015; 李胜利等, 2018)。河流底栖动物功能多样性研究很少考虑空间维度对其多样性度量的影响(Heino & Tolonen, 2017);在进行功能多样性计算时,默认将所有主轴纳入计算(张潋波等, 2013; 蒋万祥等, 2017; Li et al, 2020)。本文基于山东新薛河底栖动物调查结果,参考Maire等(2015)提出的功能空间品质评估流程和方法,分析不同维度功能空间对多样性计算的功效,并研究物种数对功能空间的品质影响,以期为河流生物监测与评估、河流科学管理提供数据参考和理论支撑。
1 材料和方法
1.1 采样点设置
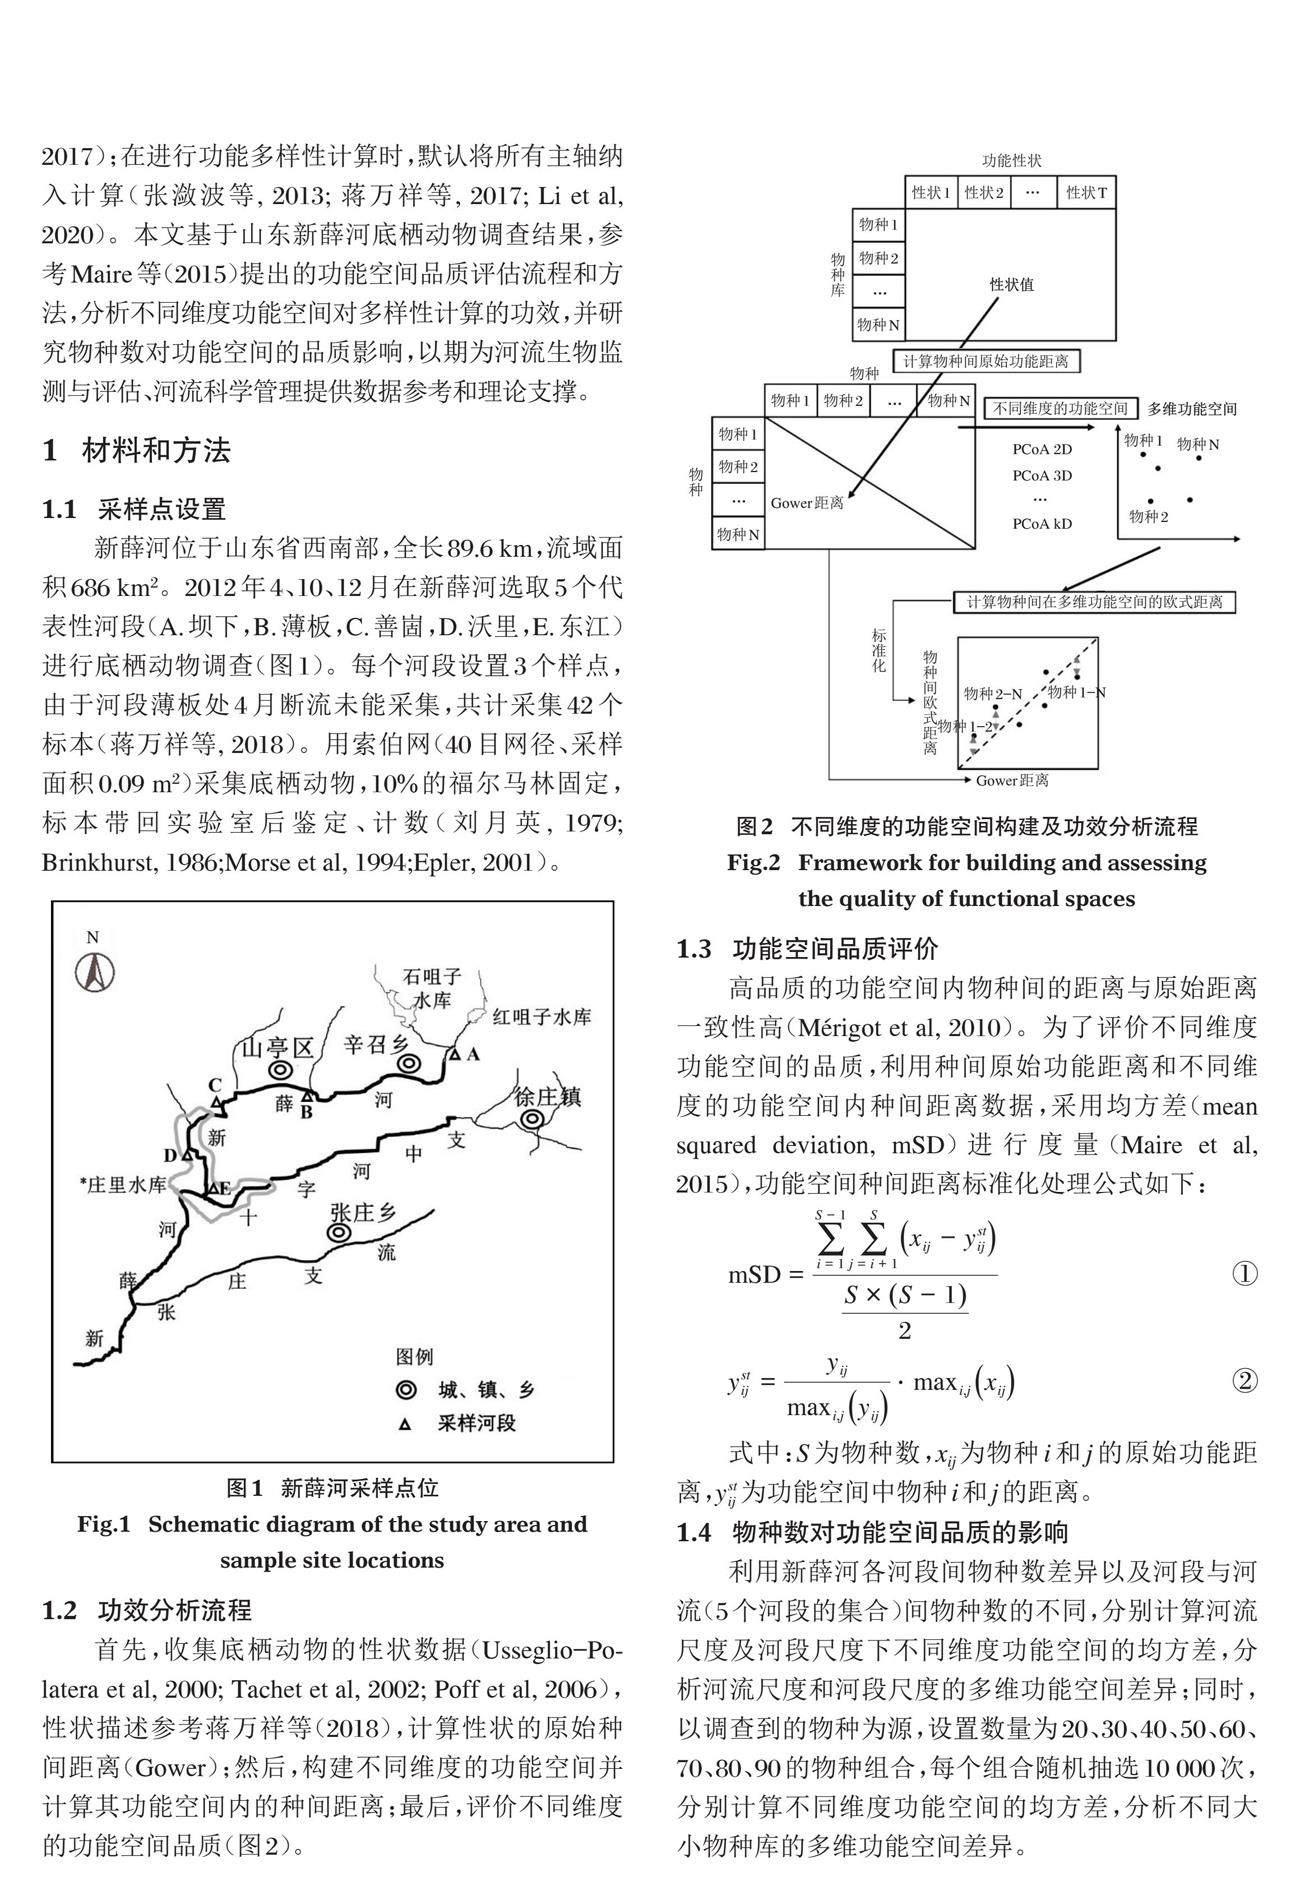
新薛河位于山东省西南部,全长89.6 km,流域面积686 km2。2012年4、10、12月在新薛河选取5个代表性河段(A.坝下,B.薄板,C.善崮,D.沃里,E.东江)进行底栖动物调查(图1)。每个河段设置3个样点,由于河段薄板处4月断流未能采集,共计采集42个标本(蒋万祥等, 2018)。用索伯网(40目网径、采样面积0.09 m2)采集底栖动物,10%的福尔马林固定,标本带回实验室后鉴定、计数(刘月英, 1979; Brinkhurst, 1986;Morse et al, 1994;Epler, 2001)。
1.2 功效分析流程
首先,收集底栖动物的性状数据(Usseglio-Polatera et al, 2000; Tachet et al, 2002; Poff et al, 2006),性状描述参考蒋万祥等(2018),计算性状的原始种间距离(Gower);然后,构建不同维度的功能空间并计算其功能空间内的种间距离;最后,评价不同维度的功能空间品质(图2)。
1.3 功能空间品质评价
高品质的功能空间内物种间的距离与原始距离一致性高(Mérigot et al, 2010)。为了评价不同维度功能空间的品质,利用种间原始功能距离和不同维度的功能空间内种间距离数据,采用均方差(mean squared deviation, mSD)进行度量(Maire et al, 2015),功能空间种间距离标准化处理公式如下:
[mSD=i=1S-1j=i+1Sxij-ystijS×S-12] ①
[ystij=yijmaxi,jyij?maxi,jxij] ②
式中:S为物种数,xij为物种i和j的原始功能距离,[ystij]为功能空间中物种i和j的距离。
1.4 物种数对功能空间品质的影响
利用新薛河各河段间物种数差异以及河段与河流(5个河段的集合)间物种数的不同,分别计算河流尺度及河段尺度下不同维度功能空间的均方差,分析河流尺度和河段尺度的多维功能空间差异;同时,以调查到的物种为源,设置数量为20、30、40、50、60、70、80、90的物种组合,每个组合随机抽选10 000次,分别计算不同维度功能空间的均方差,分析不同大小物种库的多维功能空间差异。
所有分析在R语言中完成,其中均方差计算过程参考Maire等(2015)并进行改进,不同大小物种库基于combn函数的循环抽样完成,箱线图利用plot函数。
2 结果与分析
2.1 底栖动物的多维功能空间
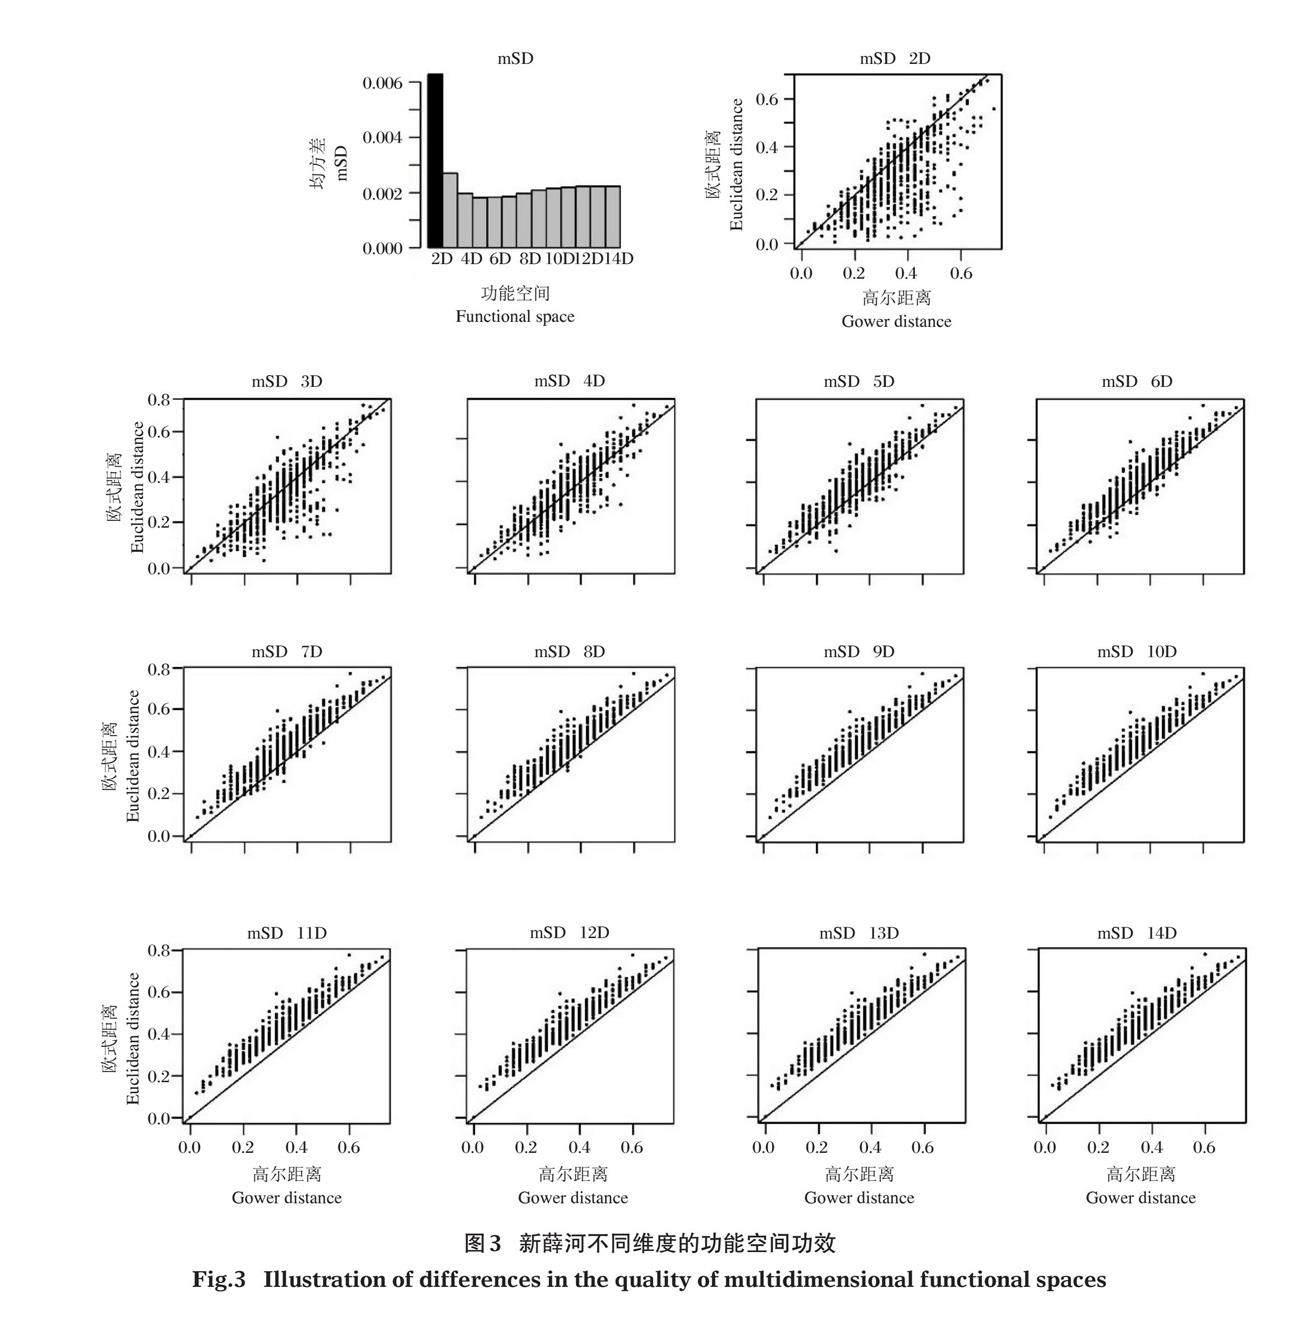
新薛河底栖动物性状构建的功能空间共有14个维度(图3)。均方差值随维度数先降低、后上升(图3-mSD)。在维度小于5D的功能空间,种间距离小于种间原始功能距离的点数较多(图3-2D~4D),而在维度大于6D的功能空间,种间距离大于种间原始功能距离的点数较多且距离较远(图3-7D~14D)。结果表明,新薛河底栖动物最优维度为5D和6D的功能空间;在维度低于5D的功能空间,种间功能差异多被低估;在维度高于6D的功能空间,种间功能差异多被高估。
2.2 河流与河段尺度的多维功能空间
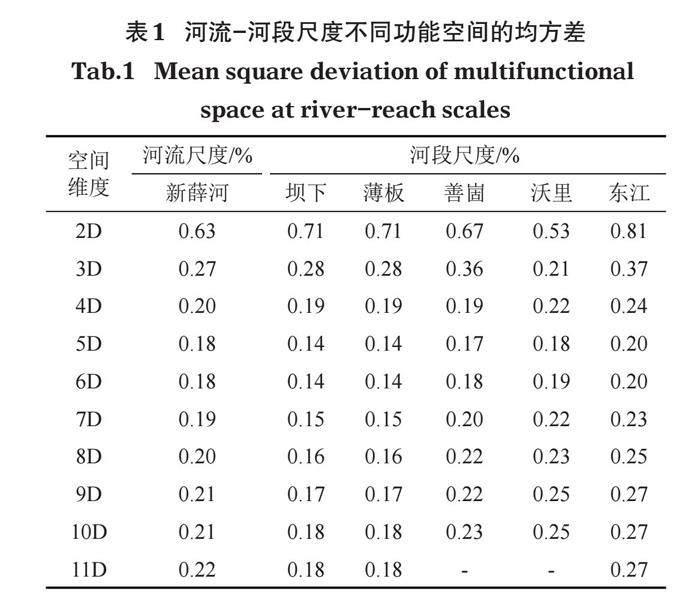
在河流尺度,不同维度空间的均方差值以2D功能空间最大(0.63%),5D和6D功能空间最小(0.18%)(表1)。在河段尺度,5D功能空间的均方差值都为最低,且5个河段的功能空间维度数都不超过11D。其中,采样点善崮、沃里河段功能空间的维度数有10D,在5D功能空间均方差最低;采样点坝下、薄板和东江河段功能空间的维度数有11D,在5D和6D功能空间均方差最低。
5个河段的功能空间维度数均小于河流尺度的功能空间维度数,在河段与河流尺度5D功能空间的均方差都为最低。结果表明,新薛河流域河段尺度性状构建的功能空间维度数要少于河流尺度,但河流和河段的最优功能空间维度一致。
2.3 不同大小物种库的多维功能空间
不同大小物种库的最优功能空间分析结果显示(表2),当物种数低于40种时,4D功能空间表现为均方差最低的频次最多,而物种数大于50种时,5D功能空间表现均方差最低的频次最多;2D、3D和4D功能空间随着物种数量增加表现为均方差最低的频次减少,7D、8D功能空间随着物种数量增加表现为均方差最低的频次增加;4D~6D功能空间在物种库均方差最低的频次超过7 000,占比超70%。
根据每个功能空间的均方差数值分析结果(图4),不同大小物种库的最优功能空间均方差值在0~0.5%;随着物种数增加,中位数无明显差异,上限值和下限值向中位数靠近,波动范围有缩小趋势。
3 讨论
3.1 多维功能空间的品质不尽相同
功能多样性依赖于性状,一方面要选择与所研究问题直接相关的且反映生态系统功能或群落响应的性状;另一方面,因性状间的权衡(trade-offs)、协同和相关,纳入各种各样的性状更能反映环境胁迫下生物响应的多样性、或潜在的独特生态系统功能(Lefcheck et al, 2015)。当前,对于底栖动物性状筛选还没有达成统一认识(Schmera et al, 2015; Hordley et al, 2021);因而利用收集到的性状建立一个最优功能空间是度量功能多样性的关键一步(Mouillot et al, 2021)。
本文基于功能空间功效分析发现,在新薛河底栖动物性状构建的5D、6D功能空间,物种间差异的均方差最小、品质最优;在维度低于5D的功能空间,物种间差异多低于性状原始差异;在维度高于6D的功能空间,物种间差异多高于性状原始差异。有关植物性状研究得出的最优功能空间集中在4D~8D,同时也证实了过高、过低维度的功能空间,都不能准确反映原始差异的现象(Laughlin, 2014)。利用品质较差的功能空间会导致功能多样性的度量出现偏差,Maire等(2015)在研究欧洲鱼类功能多样性的生物地理格局时发现,基于3D、4D功能空间度量的功能多样性格局一致,且与Villéger等(2013)的研究结论相符,而基于2D功能空间或系统树不能得出上述结果。因缺乏客观决定如何表征物种间功能距离的方式,同时多维功能空间品质也不尽相同(Mouillot et al, 2021),建议在进行功能多样性研究以及评估性状的各功能空间品质时,应选择较优功能空间度量功能多样性,以准确反映其多样性格局。
3.2 物种数对多维功能空间的品质影响有限
新薛河流域的河段和河流尺度物种存在差别(陈静等, 2019)。本文功效分析结果表明,这种差别没有改变最优功能空间的维度。利用新薛河底栖动物构建不同大小物种库,发现其最优功能空间的维度会随物种数呈上升趋势,但主要集中在4D~6D功能空间(频率占70%以上),这表明物种库大小对多维功能空间影响较小。Laughlin(2014)利用3个区域植物数据研究发现,最优功能空间维度集中在4D~8D。Maire等(2015)利用模拟数据,分别基于系统树和多维功能空间算法,同时分析了物种库大小、性状的类型(分类变量、定序变量、连续变量和混合型)和数量对功能空间品质影响,也证实物种库大小对多维功能空间的影响较小,而距离类型(系统树/欧式距离)和性状类型是影响功能空间品质的主要原因。因此,相对于物种数对功能空间品质有限的影响,什么类型的性状应该被纳入考虑、哪一个以及多少个性状应该被纳入、如何测量或推断物种性状大小或数值等问题对功能空间品质的影响更大,需要重点关注。
综上,本研究通过均方差法分析底栖动物性状构建多维功能空间的品质,掌握了不同维度功能空间内物种间差异与原始性状差异的情况;利用河段和河流尺度物种差异以及模拟不同大小物种库进行功效分析,探讨了物种数对多维功能空间品质影响。研究区域底栖动物最优功能空间维度在5D和6D,物种数大小对多维功能空间品质影响有限。结合以往研究,本文认为在功能多样性度量时要合理筛选和度量物种性状,同时选取最优功能空间维度。
参考文献
陈静,蒋万祥,朱天顺,等,2019. 新薛河溪流生境底栖动物群落结构季节动态[J]. 生态学报, 39(5):1664-1672.
蒋万祥,何逢志,蔡庆华,2017. 香溪河水生昆虫功能性状及功能多样性空间格局[J]. 生态学报, 37(6):1861-1870.
蒋万祥,陈静,王红妹,等,2018. 新薛河典型生境底栖动物功能性状及其多样性[J]. 生态学报, 38(6):2007-2016.
李胜利,易茂红,陈凯,等,2018. 渭河底栖动物性状和功能对空间尺度环境变量响应的生态区差异性[J]. 生态学报, 38(7):2566-2578.
刘月英,1979. 中国经济动物志:淡水软体动物[M]. 北京:科学出版社.
渠晓东,陈军,陈皓阳,等,2021. 大型底栖动物快速生物评价指数在城市河流生态评估中的应用[J]. 水生态学杂志, 42(3):14-22.
汪兴中,谭香,郑颖,2021. 基于文献计量学的溪流大型底栖无脊椎动物群落研究现状及热点分析[J]. 水生态学杂志, 42(2):107-115.
张潋波,刘东晓,刘朔孺,等,2013. 钱塘江中游水生昆虫群落功能多样性对土地利用变化的响应[J]. 应用生态学报, 24(10):2947-2954.
Brinkhurst R O, 1986. Guide to the freshwater aquatic microdrile Oligochaetes of North America[M]. Ottawa: Department of Fisheries and Oceans.
Campadelli P, Casiraghi E, Ceruti C, et al, 2015. Intrinsic Dimension Estimation: Relevant Techniques and a Benchmark Framework[J]. Mathematical Problems in Engineering, DOI:10.1155/2015/759567.
Carscadden K A, Cadotte M W, Gilbert B, 2017. Trait dimensionality and population choice alter estimates of phenotypic dissimilarity[J]. Ecology and Evolution, 7(7):2273-2285.
Epler J H, 2001. Identification Manual for the Larval Chironomidae (Diptera) of North and South Carolina[M]. North Carolina: Department of Environment and Natural Resources.
Goswami M, Bhattacharyya P, Mukherjee I, et al, 2017. Functional Diversity: An Important Measure of Ecosystem Functioning[J]. Advances in Microbiology, 7:82-93.
Heino J, Tolonen K T, 2017. Ecological drivers of multiple facets of beta diversity in a lentic macroinvertebrate metacommunity[J]. Limnology and Oceanography, 62(6):2431-2444.
Hordley L A, Gillings S, Petchey O L, et al, 2021. Diversity of response and effect traits provides complementary information about avian community dynamics linked to ecological function[J]. Functional Ecology, 35(9):1938-1950.
Laliberté E, Legendre P A, 2010. distance-based framework for measuring functional diversity from multiple traits[J]. Ecology, 91:299-305.
Laughlin D C, 2014. The intrinsic dimensionality of plant traits and its relevance to community assembly[J]. Journal of Ecology, 102(1):186-193.
Lee J A, Verleysen M, 2009. Nonlinear dimensionality reduction[J]. Advances in Neural Information Processing Systems, 5:1959-1966.
Lefcheck J S, Bastazini V A G, Griffin J N, 2015. Choosing and using multiple traits in functional diversity research[J]. Environmental Conservation, 42(2):104-107.
Li Z F, Liu Z Y, Heino J, et al, 2020. Discriminating the effects of local stressors from climatic factors and dispersal processes on multiple biodiversity dimensions of macroinvertebrate communities across subtropical drainage basins[J]. Science of The Total Environment, 711:134750.
Maire E, Grenouillet G, Brosse S, et al, 2015. How many dimensions are needed to accurately assess functional diversity? A pragmatic approach for assessing the quality of functional spaces[J]. Global Ecology and Biogeography, 24(6):728-740.
Mammola S, Carmona C P, Guillerme T, et al, 2021. Concepts and applications in functional diversity[J]. Functional Ecology, 35(9):1869-1885.
Martini S, Larras F, Boyé A, et al, 2021. Functional trait-based approaches as a common framework for aquatic ecologists[J]. Limnology and Oceanography, 66(3):965-994.
Menezes S, Baird D J, Soares A M, 2010. Beyond taxonomy: a review of macroinvertebrate trait-based community descriptors as tools for freshwater biomonitoring[J]. Journal of Applied Ecology, 47(4):711-719.
Mérigot B, Durbec J P, Gaertner J C, 2010. On goodness-of-fit measure for dendrogram-based analyses[J]. Ecology, 91(6):1850-1859.
Morse J C, Yang L F, Tian L X, 1994. Aquatic Insects of China Useful for Monitoring Water Quality[M]. Nanjing: Hohai University Press.
Mouillot D, Loiseau N, Grenié M, et al, 2021. The dimensionality and structure of species trait spaces[J]. Ecology Letters, 24(9):1988-2009.
Poff N L, Olden J D, Vieira N K M, et al, 2006. Functional trait niches of North American lotic insect: traits-based ecological applications in light of phylogenetic relationships[J]. Journal of the North American Benthological Society, 25(4):730-755.
Saito V S, Siqueira T, Fonseca-Gessner A A, 2015. Should phylogenetic and functional diversity metrics compose macroinvertebrate multimetric indices for stream biomonitoring?[J]. Hydrobiologia, 745(1):167-179.
Schmera D, Podani J, Heino J, et al, 2015. A proposed unified terminology of species traits in stream ecology[J]. Freshwater Science, 34(3):823-830.
Tachet H, Richoux P, Bournaud M, et al, 2002. Invertebres d'Eau Douce: Systematique, Biologie, Ecologie[M]. Paris: CNRS Editions.
Usseglio-Polatera P, Bournaud M, Richoux R, et al, 2000. Biological and ecological traits of benthic freshwater macroinvertebrates: relationships and definition of groups with similar traits Revised database[J]. Freshwater Biology, 43(2):175-205.
Villéger S, Mason N W H, Mouillot D, 2008. New multidimensional functional diversity indices for a multifaceted framework in functional ecology[J]. Ecology, 89:2290-2301.
Villéger S, Novack-Gottshall P M, Mouillot D, 2011. The multidimensionality of the niche reveals functional diversity changes in benthic marine biotas across geological time[J]. Ecology Letters, 14:561-568.
Villéger S, Grenouillet G, Brosse S, 2013. Decomposing functional β-diversity reveals that low functional β-diversity is driven by low functional turnover in European fish assemblages[J]. Global Ecology and Biogeography, 22:671-681.
Zhu L H, Fu B J, Zhu H X, et al, 2017. Trait choice profoundly affected the ecological conclusions drawn from functional diversity measures[J]. Scientific Reports, 7(1):36-43.
(责任编辑 万月华)
Assessing the Efficiency of Multidimensional Functional Spaces
for Macroinvertebrate Traits of Functional Diversity
LI Yang1,2, YANG Shun‐yi2, LUO Hong‐wei2, CHEN Jing1, PAN Wen‐jie2, PAN Bao‐zhu3, JIANG Wan‐xiang1,3,4
(1. College of Life Sciences, Zaozhuang University, Zaozhuang 277160, P. R. China;
2. Environmental Monitoring Center of Changjiang River Administration of Navigational Affairs,
Wuhan 430019, P. R. China;
3. State Key Laboratory of Eco-hydraulics in Northwest Arid Region of China,
Xian University of Technology, Xian 710048, P. R. China;
4. Hebei Key Laboratory of Wetland Ecology and Conservation, Hengshui 053000, P. R. China)
Abstract:Measuring the functional diversity of communities based on species traits requires the construction of a multidimensional functional space where functional diversity indices can be computed. A poor-quality functional space leads to biased calculation of functional diversity indices. However, there is no consensus on selecting the dimension of functional space. In this study, we selected Xinxue River as a case study and assessed the quality of multidimensional functional spaces on the measurement of macroinvertebrate functional diversity indices in Xinxue River and analyzed the effects of species richness on the quality of functional space. Using macroinvertebrate data, the quality of different dimensional functional spaces was evaluated by mean squared deviation analysis, and the effect of species number on the quality of dimensional functional spaces was analyzed by simulating different groups on a river-reach scale. Results show that: (1) There were 14 spatial dimensions of functional space constructed based on macroinvertebrate traits. The functional space with five and six dimensions was best, based on mean squared deviation. In functional spaces with at least seven dimensions, the distance between each pair of species were greater than the initial functional distance. The distance between each pair of species was underestimated in functional spaces limited to four dimensions. (2) A five dimensional functional space was best at both river and reach scales. (3) A four dimensional functional space gave the lowest mean squared deviation in groups with 20-40 macroinvertebrate species, while a five dimensional functional space gave the lowest mean squared deviation in groups with 50-90 species. Functional spaces with four to six dimensions most frequently gave the lowest mean square deviation, accounting for 70% of all functional spaces. In summary, the best functional space for macroinvertebrate traits had five or six dimensions in Xinxue River and species number had limited influence on the identity and quality of the best functional space.
Key words:macroinvertebrates; functional diversity; multidimensional functional space; Xinxue River