The anti-diabetic effect and possible mechanism of the Annona muricata L.root extract in type 2 diabetic mice
2023-03-25GONGJingwenCHENYongkangLIHailongLIYoubin
GONG Jing-wen, CHEN Yong-kang, LI Hai-long, LI You-bin✉
1.Key Laboratory of Tropical Translational Medicine of Ministry of Education
2.Hainan Provincial Key Laboratory for Research and Development of Tropical Herbs
3.Haikou Key Laboratory of Li Nationality Medicine
4.School of Pharmacy, Hainan Medical University,Haikou 571199, China
Keywords:
ABSTRACT Objective:To investigate the anti-diabetic effect of the root extract of Annona muricata (AME)in streptozotocin-nicotinamide-induced type 2 diabetic (T2DM) mice.Methods:After 4 weeks of high-fat diet, ICR mice were given 1 g/kg nicotine and 120 mg/kg streptozotocin(STZ) orally to construct a T2DM model.The T2DM mice were randomly divided into five groups: model group, 200 mg/kg metformin group and 50, 100, 200 mg/kg AME groups.Drugs were oral administered continuously for 4 weeks.Fasting blood glucose and body weight were measured weekly.Oral glucose tolerance test (OGTT) and detection of serum glycated hemoglobin (HbA1c) level were performed one week before the end of the experiment.At the end of drug administration, serum total cholesterol (TG), triglycerides(TC), low-density lipoprotein levels (LDL-C) and insulin levels were tested by lipid detection kits; homeostasis model assessment-estimated insulin resistance (HOMA-IR) and HOMA-β indexes were calculated.Liver and kidney tissues were weighed to calculate organ indices and pathological tests were performed.Western blot was performed in the liver to detect adenosine monophosphate-activated protein kinase (AMPK), acetyl coenzyme A carboxylase (ACC),glucose-6-phosphate carboxylase (G6Pase), and phosphoenolpyruvate carboxykinase (PCK1)protein expression.Results:with 200 mg/kg AME significantly reduced fasting blood glucose,HbA1c, TG and LDL-C levels, protected liver and kindey in diabetic mice, decreased the area under the OGTT curve, inhibited ACC and G6Pase protein expressions, and activated AMPK protein expression.Conclusion:AME showed good therapeutic activity against T2DM, and the mechanism may be related to the activation of AMPK and inhibition of ACC and G6Pase proteins.
1.Introduction
The number of global patient diagnosed with diabetes mellitus has increased dramatically in recent years and is expected to reach 700 million by 2045 according to the data forecasting by the International Diabetes Federation (IDF).About 95% of diagnosed diabetes mellitus is type 2 diabetes mellitus (T2DM)[1].Impairment of insulin secretion and insulin resistance (IR) are two important pathogenetic characteristics of T2DM, causing hyperglycemia,hyperinsulinemia, and hyperlipidemia.These increased metabolic parameters in turn elevate the incidence of T2DM complications[2, 3].T2DM and its chronic complications have become major challenges worldwide due to the implicated morbidity and mortality[4].Although there are plenty of anti-diabetic medications, new effective anti-diabetes drugs with less side effects and novel therapeutic strategies are still needed[5].
Annona muricata L.(Magnoliales: Annonaceae) is an edible tropical fruit tree that is widely cultivated across regions of the world.Traditional uses of A.muricata have been identified to treat diverse ailments such as fever, pain, respiratory and skin illness,internal and external parasites, bacterial infections, hypertension,inflammation, diabetes and cancer [6].In vivo and in vitro studies support the hypoglycemic activity of the ethanolic extracts of A.muricata leaves and the antidiabetic potentials of A.muricata fruits[6-8].However, neither the anti-diabetes effect of the roots of A.muricata reported in folklore medicine nor its underlying mechanism has been studied.Phytochemical studies revealed that annonaceous acetogenins, the main active compounds of A.muricata, largely contributes to the anticancer and pesticidal effects [9-11].Annonaceous acetogenins also reported toinhibits complex I to decrease cellular energy[12].Of note, metformin also partially inhibits complex I to decrease cellular energy, result in AMP-activated protein kinase(AMPK) activation, gluconeogenesis inhibition and acetylcoA carboxylase (ACC) inhibition, thereby improving insulin sensitivity and decreasing blood glucose level [13,14].Therefore, a hypothesize was raised that the anti-diabetic mechanism of A.muricata might similar to metformin.
By using UPLC-Q/TOF-MS to analyze the composition of the root enthanol extract of the Annona muricata L.(AME), our group confirmed that AME contained Annonacin A and Annonacinone, both of which are belong to annonaceous acetogenins.Therefore, in this paper, we constructed streptozotocin (STZ)-nicotinamide (NA)-induced T2DM ICR mice and investigated the antidiabetic effect of AME on T2DM mice after 4 weeks of administration.The effects of AME on blood glucose, body weight, lipid metabolic parameters,insulin sensitivity and liver and kidney of T2DM mice were assessed.The changes of AMPK, ACC, PCK1 and G6Pase protein expression were detected by Western blot to explore the potential mechanism of the antidiabetic effect of AME.
2.Materials and Methods
2.1 Materials
2.1.1 Aniamals
Male ICR mice (5 weeks old) were purchased from Tianqing Biotechnology (Changsha, China), License No.: SCXK (Xiang)2019-0013.They were used for experiments after one week acclimatization to the animal house conditions (12 h light/dark cycle,25-26 ℃ temperature) with food and water available ad libitum.
2.1.2 Main Instruments
Spectra Max19 full wavelength enzyme labeler (USA);Electrophoresis instrument (Bio-Rad, USA); Chemidoc XRS+high sensitivity chemiluminescence imaging system (Bio-Rad,USA); Model 580 blood glucose meter (Shanghai Yuyue Medical Equipment Co.)
2.1.3 Drugs and Reagents
Streptozotocin, nicotinamide, and metformin (MET) were purchased from Aladdin.Total cholesterol, triglyceride and LDL assay kits were purchased from CSCN Biotechnology Co.Glycosylated hemoglobin kit was purchased from Shanghai Jiufo Biotechnology Co.Insulin kits were purchased from Shanghai Future Industry Co.
The roots of A.muricata (1.55 kg) were dried, powdered and refluxed with 95% ethanol for three times.The extracted solutions were combined and filtered.The filtrate was concentrated under reduced pressure to yield 116 g A.muricata root extract.
2.2 Methods
2.2.1 Modeling
To establish Streptozotocin-nicotinamide (STZ-NA)-induced T2DM model, ICR mice were randomly divided into normal control group (n=10, provided with standard commercial diet) and high-fat diet group (provided with high fat diet).After four week feeding,those mice in the high-fat diet group were performed with the same protocol published in Masayuki Shibasaki’s study [15].After the model was established, diabetic mice were randomly divided into five groups (n=10 for each group): model group (MOD), 200 mg/kg/d metformin group (MET), 200 mg/kg/d AME group (AME-H),100 mg/kg/d AME group (AME-M) and 50 mg/kg/d AME group(AME-L).The treatment was last for 4 weeks and all drugs were delivered by gavage.The MOD group and the normal control group (CON) were given equal volume of normal saline per day.Fasting blood glucose (FBG) levels and body weights of mice were measured at day 0, 7, 14, 21 and 28 under 12 h fasting conditions.FBG level was detected by using a glucose meter (Yuwell Medical Equipment Co., Ltd., China) with one drop vein blood from mouse tail.
At the end of each treatment, the animals were fasted overnight and weighed at 9:00 am.Animals were then euthanized, and blood samples were collected by heart piercing and centrifugated (3 000 rpm, 10 min) to obtain serum.The liver and kidney were collected,weighted and cryopreserved.
2.2.2 Glycated hemoglobin test and Oral glucose tolerance test (OGTT)
7 days before the end of each treatment, glycated hemoglobin(HbA1c) levels in mice were measured using a commercial kit (Jufu Biology, China).After that, 2.5 g/kg of glucose in solution was conducted to each mouse by lavage.The blood glucose levels were detected at 0, 30, 60, 90 and 120 min after lavage using the FBG detect method.The blood glucose -time curve of each group was plotted.The area under the curve (AUC) was calculated by using the blood glucose levels.
2.2.3 Serologic detection
Total cholesterol (TC), triglycerides (TG) and low density lipoprotein cholesterol (LDL-C) in serum were detected by detection kits using a microplate reader.Fasted plasma insulin (FINS) levels were determined using an Elisa Kit (Jianglaibio, China).The homoeostasis model assessment (HOMA) index was calculated as follows: HOMA-IR=FBG FINS/22.5;HOMA-β=20×FINS/(FBG-3.5) [16].
2.2.4Western blot
The liver proteins were extracted and uniform concentrations of proteins were fractionated by 10% SDS-PAGE, and transferred to PVDF membranes.The membranes were blocked with 5% skim milk for 1.5 h and subsequently probed overnight at 4℃ with the primary antibodies against ACC (1:2000, Abcam, ab45174),G6PASE (1:1000, Boster.PB0194), PCK1 (1:2000, Proteintech,16754-1-AP) and β-actin (1:4000, Abcam, ab8226).Thereafter, the membranes were incubated with secondary antibody at 25℃ for 1.5 h.A Bio-Rad ChemiDoc XRS+ chemiluminescence image analysis system was used to analyze the band densities.
2.2.5 Statistical analysis
3.Results
3.1 AME decreased fasting blood glucose, serum HbAlc and body weight gain in STZ-NA-induced T2DM mice
In STZ-NA-induced T2DM model, hyperglycemia was obviously observed in MOD mice during the whole treatment as the blood glucose was significantly increased when compared to the CON mice (Table 1, P < 0.01 or P < 0.001).Meanwhile, the body weight of mice in the MOD group was maintained at a high level (P < 0.01 or P < 0.001), indicating successful modeling of type 2 diabetes.200 mg/kg AME inhibited the rate of body weight gain in T2DM mice from the end of the second week (P < 0.01).All three concentrations of AME reduced the body weight of T2DM mice at the third week(P < 0.001) and maintained it until the end of the fourth week (P <0.001).Metformin stabilized the body weight of T2DM mice during 4 weeks of administration and did not show fluctuations.AME and metformin produced suppression of blood glucose levels in T2DM mice from the beginning of administration.100 and 200 mg/kg AME and metformin showed significant glycemic suppression at the end of the third week (P < 0.01, P < 0.5, P < 0.5 vs MOD), but metformin blood glucose levels remained slightly higher (P < 0.001 vs CON).Notably, the fasting blood glucose of T2DM mice in 100 and 200 mg/kg AME groups were already very close to normal by the end of the fourth week (P < 0.001 vs MOD, P > 0.5 vs CON),showing a more rapid glycemic suppression effect.
Tab 1 Effects of drug treatment on blood glucose and body weight of T2DM mice during four weeks (±s,n=10)

Tab 1 Effects of drug treatment on blood glucose and body weight of T2DM mice during four weeks (±s,n=10)
Note:#P <0.05, ##P <0.01, ###P <0.001 vs CON, *P <0.05,**P <0.01,***P <0.001 vs MOD.
Week CON MOD MET AME-H AME-M AME-L Body weight (g)0 33.58±0.34 32.50 ± 0.59 38.02 ± 0.59 32.75 ± 1.00 34.17 ± 1.02 31.94 ± 1.49 1 33.56 ± 0.35 42.81 ± 0.94##36.69 ± 1.17 34.88 ± 0.94**36.57 ± 1.31 33.03 ± 1.48**2 35.55 ± 1.05 44.64 ± 1.14##37.08 ± 1.13***39.71 ± 0.88**38.33 ± 0.99**38.83 ± 0.99**3 35.85 ± 0.39 43.44 ± 1.23###37.66 ± 1.83 33.57 ± 1.07***35.41 ± 1.11***32.85 ± 1.34***4 36.05 ± 0.93 42.40 ± 0.93##37.09 ± 1.43*33.03 ± 1.26***35.14 ± 1.27**33.00 ± 1.62***0 3.47 ± 0.27 23.28 ± 3.11###26.87 ± 3.87###24.58 ± 3.51###23.58 ± 3.63###25.31 ± 3.58###1 7.15 ± 0.69 21.68 ± 2.29##21.60 ± 2.96###19.29 ± 3.59 15.49 ± 3.36 20.16 ± 7.92#2 6.42 ± 0.79 22.00 ± 1.95##20.12 ± 2.44##15.17 ± 8.05 11.89 ± 1.90*18.15 ± 9.26##3 7.35 ± 0.75 24.38 ± 1.32###,*19.97 ± 1.55###,*12.74 ± 9.32**9.91 ± 2.94*12.59 ± 0.52 4 7.35 ± 0.75 26.56 ± 2.34##15.75 ± 1.20###,**8.04 ± 1.35***8.77 ± 1.17***10.98 ± 1.58***HbA1c % 3 3.86 ± 0.12 8.13 ± 0.28###4.80 ± 0.33***4.30 ± 0.08***4.43 ± 0.27***6.82 ± 0.85 Fast Blood glucose(mmol/L)
Glycosylated hemoglobin (HbA1c %) is the product of hemoglobin binding to serum glucose in red blood cells, and its level reflects the blood glucose level for a period of time before blood sampling,and is a powerful indicator to evaluate the ability of blood glucose control; its normal range is between 4 % - 6.5 %.The results showed that both 100 and 200 mg/kg AME and metformin reduced the HbA1c % level in T2DM mice (P < 0.001), indicating that AME and metformin both improved the glycemic control in T2DM mice.
3.2 AME decreased serum TG and LDL levels
One of the characteristics of T2DM is hyperlipidemia.Significant increases in TG and LDL levels(P < 0.01, P < 0.5) in STZ-NAinduced T2DM mice were alleviated by AME or MET (Table 2, P< 0.05 or P < 0.01).Metformin also showed a hypolipidemic trend.Meanwhile, 200 mg/kg AME and metformin significantly inhibited the increase in LDL-C levels (P < 0.05).However, AME did not show a control effect on TC levels, although TC levels remained within the normal range (2.9-6.0 mmol/L), and AME instead tended to increase TC concentrations.
3.3 AME alleviated the oral glucose tolerance in STZ-NAinduced T2DM mice
Blood glucose levels in all groups except MOD mice showed similar concentrations at 0 min (Figure 1, Table 3).MOD mice showed significantly higher blood glucose levels at all time points(P < 0.001, P < 0.01) and failed to return to the value at time zero within 120 min after gavage of glucose, indicating decreased glucose tolerance in T2DM mice.Sharp increases in blood glucose levels were observed at MET group at 30 and 60 min (P < 0.001, P < 0.05),while the AME group showed some improvement in oral glucose tolerance by having lower blood glucose levels than MOD mice at all time points (Figure 1, Table 3).AME reduced the area underthe OGTT curve (AUC) in a dose-dependent manner, with AME-H showing the the best improvement (Table 3, P < 0.05).
Tab 2 Effects of drugs on serum TG, TC and LDL-C levels in T2DM mice (±s, n=10)

Tab 2 Effects of drugs on serum TG, TC and LDL-C levels in T2DM mice (±s, n=10)
#P<0.05, ##P <0.01 vs CON; *P <0.05, **P <0.01 vs MOD.
CON MOD MET (200 mg/kg) AME 200 mg/kg 100 mg/kg 50 mg/kg TG(mmol/L) 0.71 ± 0.08 2.07 ± 0.25##1.41 ± 0.22 0.76 ± 0.32**1.09 ± 0.24*0.94 ± 0.23*TC(mmol/L) 2.32 ± 0.40 4.93 ± 0.71 5.07 ± 0.84#5.95 ± 0.31##4.26 ± 0.38 4.76 ± 0.60 LDL(mmol/L) 0.82 ± 0.07 1.44 ± 0.13#0.90 ± 0.08*1.15 ± 0.19*1.06 ± 0.13 1.19 ± 0.22
3.4 AME decreased the HOMA-IR and HOMA-β indices
As shown in Table 4, data in MOD group indicated the impairment in insulin resistance and islet β-cell secretion function (P < 0.01,P < 0.001).200 mg/kg AME significantly reduced the HOMAIR index in T2DM mice (P < 0.05); in addition, 200 mg/kg AME significantly improved the HOMA-β index in T2DM mice (P <0.05).
3.5 AME activated AMPK and inhibited the activities of G6Pase and ACC in livers of STZ-NA-induced T2DM mice
Abnormal blood glucose level largely contributes to the glucose metabolic disorders in the liver.PCK1 and G6Pase are the key enzymes in the process of glycogen isogenesis.As shown in Figure 2 and Table 5, hepatic AMPK activity was inhibited in T2DM mice(P < 0.05), while PCK1 and G6Pase protein expressions were enhanced (P < 0.05, P < 0.01), indicating a significant hepatic gluconeogenesis, which would accelerate the increase in blood glucose concentration.200 mg/kg AME and MET significantly attenuated ACC protein (P < 0.001) and G6Pase protein (P < 0.05,P < 0.01) expressions, while significantly activating AMPK protein expressions (P < 0.01, P < 0.001).AME and MET showed no significant effect on PCK1 protein expression.
Tab 3 Oral glucose tolerance time-glucose curve in T2DM mice under the effect of AME and MET(±s,n=10)

Tab 3 Oral glucose tolerance time-glucose curve in T2DM mice under the effect of AME and MET(±s,n=10)
TIME (min) CON MOD MET AME-H AME-M AME-L 0 7.66 ± 0.18 22.37 ± 1.40 12.56 ± 0.63 10.15 ± 1.26 10.94 ± 0.87 11.12 ± 0.96 30 11.70 ± 1.22 31.32 ± 1.70 ###31.30 ± 0.89###21.92 ± 3.26 24.83 ± 2.49 26.74 ± 3.58 60 11.73 ± 1.75 30.83 ± 1.49 ##30.20 ± 1.25#22.25 ± 4.29 21.66 ±2.75 24.06 ± 3.79 90 12.99 ±2.90 30.18 ± 1.78 ##19.30 ± 3.90 21.12 ± 4.27 17.04 ± 2.38 21.98 ± 3.98 120 10.23 ± 1.64 28.42 ± 2.36 ##21.54 ± 4.99 19.40 ± 4.30 17.67 ± 3.52 20.02 ±3.05 AUC (mmol*min/L) 1361 ±186.9 3532 ± 145.7 ###2936 ± 207.4 ##2335 ± 206.2* 2402 ± 424.5 2651 ±374.2 #
Tab 4 The effects of AME and MET on insulin, HOMA-IR and HOMA-%β indexes in T2DM mice(±s,n=10)

Tab 4 The effects of AME and MET on insulin, HOMA-IR and HOMA-%β indexes in T2DM mice(±s,n=10)
.#P <0.05,##p <0.01, ###P <0.001, vs CON; *P <0.05,**P <0.01,***P <0.001, vs MOD
Parameter CON MOD MET AME-H AME-M AME-L Insulin(mU/L) 8.37 ± 1.00 7.09 ± 0.44 8.66 ± 0.37 7.11 ± 0.32 7.30 ± 0.32 6.95 ± 0.40 HOMA-IR 2.43 ± 0.24 8.25 ± 0.65##5.72 ± 0.85 3.79 ± 0.63*5.07 ± 0.80 5.41 ± 1.01 HOMA-%β 58.60 ± 2.91 6.56 ± 0.94###19.16 ± 6.68###30.30 ± 9.43##,*15.60 ± 2.99###14.24 ± 4.45###
Tab 5 The protein expressions of ACC、PCK1、AMPK and G6Pase in T2DM mice after drug treatment (±s,n=10).

Tab 5 The protein expressions of ACC、PCK1、AMPK and G6Pase in T2DM mice after drug treatment (±s,n=10).
#P <0.05, ##P <0.01 vs CON; *P <0.05,**P <0.01,***P <0.001 vs MOD.
Proteins CON MOD MET AME-H AME-M AME-L ACC/β-actin 0.53 ± 0.06 0.69 ± 0.06#0.24 ± 0.04***0.35 ± 0.06***0.73 ± 0.04 0.85 ± 0.08 PCK1/β-actin 0.18 ± 0.06 0.27 ± 0.04 0.19 ± 0.10 0.19 ± 0.05 0.19 ± 0.07 0.19 ± 0.05 AMPK/β-actin 0.65 ± 0.07 0.47 ± 0.04#0.93 ± 0.08***0.69 ± 0.04**0.60 ± 0.08 0.54 ± 0.03 G6PD/β-actin 0.33 ± 0.07 0.76 ± 0.17##0.37 ± 0.10**0.39 ± 0.11*0.42 ± 0.06*0.60 ± 0.21

Fig 1 Time course of changes in the blood glucose levels of AME and MET on oral glucose tolerance in STZ-NA-induced T2DM mice
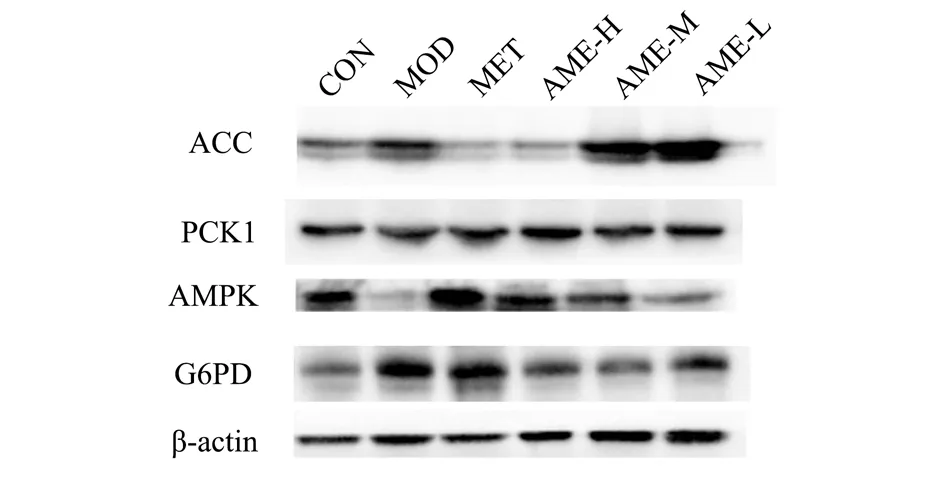
Fig 2 Electrophoretograms of ACC, PCK1, AMPK and G6Pase proteins in T2DM mice after drug treatment
4.Discussion
Mice from the STZ-NA-induced T2DM model were used in this experiment.They were fed with a high-fat diet for 4 weeks prior to modeling to mimic the poor lifestyle habits prevalent in type 2 diabetic patients before the disease, such as high-fat diet and lack of exercise, resulting in obesity and insulin insensitivity [17].Subsequent administrations of STZ and NA to ICR mice were used to selectively damage pancreatic β-cells and leads to β-cell apoptosis, followed by hyperglycemia and development of T2DM.This model is suitable for studying the effects of drugs on glycemic and lipid regulation.It should be noted that STZ is not metabolizable for islet damage and also has toxic effects on the liver, making this model susceptible to conversion to type 1 diabetes, so NA was applied to protect islets from excessive damage in this experiment.The experimental results showed that oral AME could reduce fasting blood glucose and serum HbA1c levels in T2DM mice.200 mg/kg AME was able to reduce the body weight of T2DM mice.These results suggest that AME is an effective hypoglycemic agent.
IR can be seen as the enigma that causes T2DM, and it is the basis for many chronic diseases such as hypertension, hyperlipidemia,abnormal glucose tolerance, coronary heart disease, cerebrovascular disease, etc[18, 19].Therefore, treatment and prevention of IR has a key role.There are many clinically useful indicators of IR, including HOMA-IR and HOMA-β[16].AME successfully reduced IR in both models, as manifested by the dramatic decrease HOMA-IR index and the OGTT results.
Obesity and hyperlipidemia are two factors involved in the development of IR[3].Large amounts of lipids in obesity patient inhibit full activation of pancreatonic effect, resulting in weak insulin secretion[3].High level of peripheral triglyceride will also cause a reduction of insulin sensitivity in peripheral tissues, developed into IR [18].While treating type 2 diabetes, if there are also abnormalities in lipid metabolism, lipid-lowering therapy should be carried out at the same time.The lipid-lowering therapy is not only targets lipid metabolism, but also helps to improve insulin secretory function and IR.200 mg/kg AME decreased the elevated TG and LDL levels of T2DM mice, showed good lipid-lowering effects.It is curious that increases TC levels were observed in drug groups, which was opposite with the effect of HMG-CoA inhibition caused by AMPK activation.We speculate that this may be related to the partial recovery of liver function in T2DM mouse.Although increased,the TC level remained within the normal range and did not cause hyperlipidemia.
The glycogen synthesis and glycogenolysis are dependent on insulin regulation.Hepatic gluconeogenesis also contributes to glucose homeostasis[21].Therefore, diabetes and liver disease are risk factors for each other, and diabetic patients need to pay more attention to liver health at all times.AMPK is an important intracellular energy regulatory molecule, and studies have shown that AMPK plays an important role in hepatic glucolipid metabolism, mainly by inhibiting hepatic glucose production and lipid synthesis[22].Metformin activates AMPK by inhibiting the mitochondrial respiratory chain complex I [13] Annonaceous acetogenins also have strong inhibitory effects on complex I [12].Activated AMPK will inhibit downstream ACC activity, which exists in hepatocytes and catalyzes acetyl CoA into fatty acids synthesis.ACC is an important rate-limiting enzyme in hepatic TG synthesis, and inhibition of ACC enzyme activity will reduce the in vivo concentration of TG, regulating TG metabolism in diabetic patients[23].Considering the similar effects of Annonaceous acetogenins and MET on inhibiting complex I to decrease cellular energy, AMPK and ACC protein levels were detected in this experiment to explore the anti- hyperlipidemia mechanism of AME.The results of WB experiments showed that both MET and AME activated AMPK expressions and inhibited the expressions of downstream ACC proteins.These suggest that the mechanism of lipid metabolism regulation by AME is related to the inhibition of complex I and activation of AMPK.
In addition, as an important physiological process that regulates the homeostasis of blood glucose in the body, the over-activation of hepatic gluconeogenesis is one of the key links in the pathogenesis of diabetes[24].Hepatic gluconeogenesis is regulated by two important enzymes, G6pase and PCK1.These two enzymes have become important targets for the study of metabolic diseases such as diabetes.The expression of these two enzymes is able to be inhibited by activated AMPK and also by some non-AMPK pathways [21].The results showed that AME significantly inhibited the over expression of G6Pase protein, but showed no obvious inhibition on PCK1 expression.Aforementioned data suggest that AME is able to reduce blood glucose levels in T2DM by inhibiting the hepatic gluconeogenesis pathway.In addition, whether AME inhibits hepatic gluconeogenesis only through the AMPK pathway needs to be verified by subsequent experiments.However, it is worth noting that targeting hepatic gluconeogenesis to lower blood glucose levels has become a promising strategy for the development of more effective T2DM therapies, AME therefore has promising developmental prospects.
Phytochemical studies have shown that different parts of A.muricata contain a large number of different phytoconstituents and compounds.The fruits contain 3 alkaloids, 10 Annonaceous acetogenins, 10 phenols and 114 volatile compounds, while the leaves contain 14 alkaloids, 45 Annonaceous acetogenins, 13 flavonol glycosides and 17 terpenoids, the roots contain 7 alkaloids and 18 Annonaceous acetogenins; the seeds contain 1 alkaloid, 52 fenugreek lactones The seeds contained one alkaloid, 52 fenugreek lactones and two cyclic peptides [26, 27].Our group performed some compositional analysis of AME by using UPLC-Q/TOF-MS, but only some of the Annonaceous acetogenins, phenolic substances,alkaloids, amino acids and vitamins were confirmed due to the limited database resources.The effective antidiabetic substance of AME is not clear yet.The group will continue to analyze the composition and content to further determine the effective antidiabetic substance of AME.However, despite this, reported phytochemical studies have shown that many substances are distributed in different parts of A.muricata, and only a small number of phytoconstituents are unique to a particular part.The leaf extracts were richer and contained most of the phytoconstituents of A.muricata.Therefore, the antidiabetic mechanism of action of the root extract of A.muricata can provide a reference for the study of the antidiabetic mechanism of the extracts of other parts of A.muricata.
Author Contributions
Jingwen Gong, designed research, conducted experiments, analyzed data and wrote the paper.Hailong Li, performed UPLCQTOF-MS analysis.Yongkang Chen performed some animals experiment.Youbin Li.designed the study and wrote the paper.
Additional Information
Competing Interests: The authors declare no competing interests.
杂志排行

Journal of Hainan Medical College的其它文章
- Research progress of miRNA and chronic nonbacterial prostatitis
- Advances in the mechanism of liver injury caused by COVID-19
- Effect of scalp acupuncture combined with language rehabilitation training in treating post-stroke motor aphasia: A systematic review and meta-analysis
- Research progress on chemical constituents and pharmacological activities of Amomum longiligulare T.L.Wu
- Bioinformatics screening of breast cancer-related genes and potential drug research
- The diagnostic value of transient elastography combined with serum SAA and IL-6 in the degree of hepatitis B liver fibrosis