LDH conversion film for active protection of AZ31 Mg alloy
2023-03-24PilloMingoelOlmoMtykinKooijmnGonzlezGrciArrlMoheno
B.Pillo ,B.Mingo ,R.el Olmo,c ,E.Mtykin ,A.M.Kooijmn ,Y.Gonzlez−Grci ,R.Arrl,M.Moheno,∗
a Departamento de Ingeniería Química y de Materiales,Facultad de Ciencias Químicas,Universidad Complutense,Madrid 28040,Spain
b Department of Materials,University of Manchester,Oxford Road,Manchester M13 9PL,UK
c Institute of Optoelectronics,Military University of Technology,2 Kaliskiego Str.,Warsaw 00-908,Poland
dMaterials Science and Engineering Department,Delft University of Technology,Mekelweg 2,Delft 2628 CD,the Netherlands
Abstract Zinc aluminium (Zn-Al) and lithium aluminium (Li-Al)– layered double hydroxides (LDH) coatings with incorporated inhibitors (Li−,Mo−and W−based) were successfully synthesized on AZ31 Mg alloy.Zn−Al LDH W and Li−Al LDH Li showed the highest corrosion resistance and were selected for further evaluation.SEM cross−section examination revealed a bi−layer structure composed of an outer part with loose fla es and a denser inner layer.XRD,FTIR,and XPS analysis confirme the incorporation of the inhibitors.Post−treatments with corrosion inhibitors containing solutions resulted in the selective dissolution of the most external layer of the LDH coating,reducing the surface roughness,hydrophilicity and paint adhesion of the layers.Active corrosion properties were confirme by SVET evaluation for the Zn−Al LDH W coating.The proposed active corrosion mechanism involves the ion−exchange of aggressive Cl−ions,deposition of hydroxides and competitive adsorption of W−rich corrosion inhibitors.
Keywords: AZ31;Magnesium;Layered double hydroxides;Corrosion inhibitors;Active corrosion protection.
1.Introduction
Conversion coatings are one of the most cost−effective approaches for preventing the degradation of metallic alloys[1].In the last decade,layered double hydroxides (LDHs)have shown promising results on Al alloys [2,3] and more recently,there has been growing interest of these layers on Mg alloys [4–9].
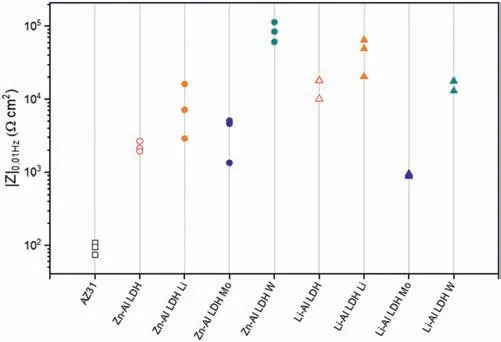
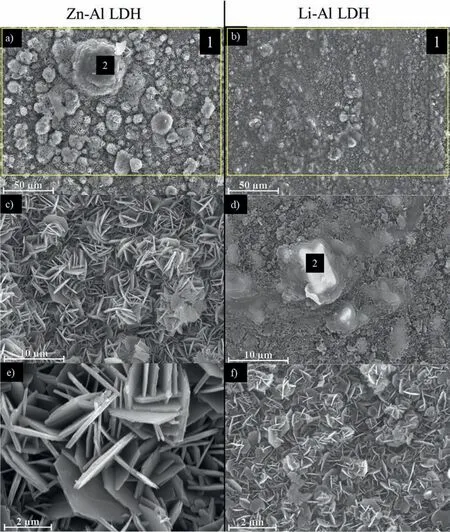
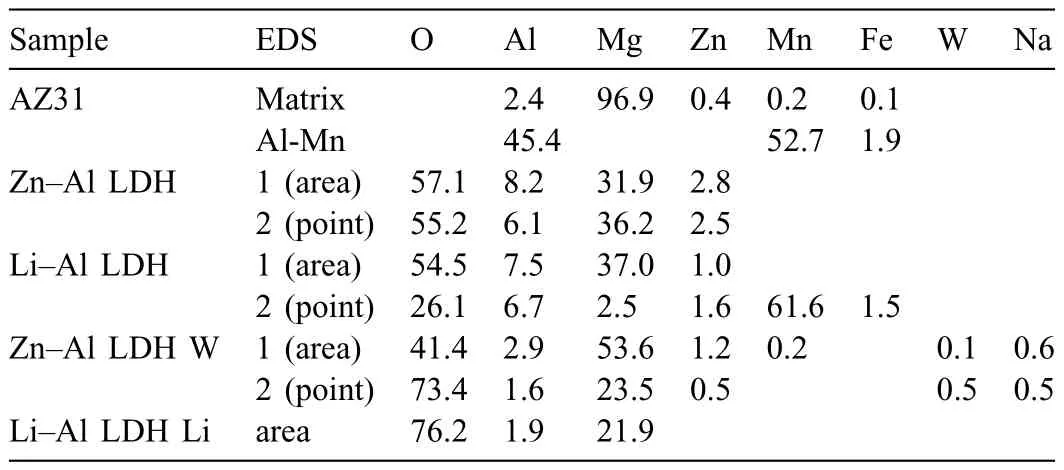
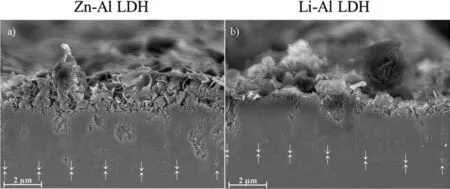
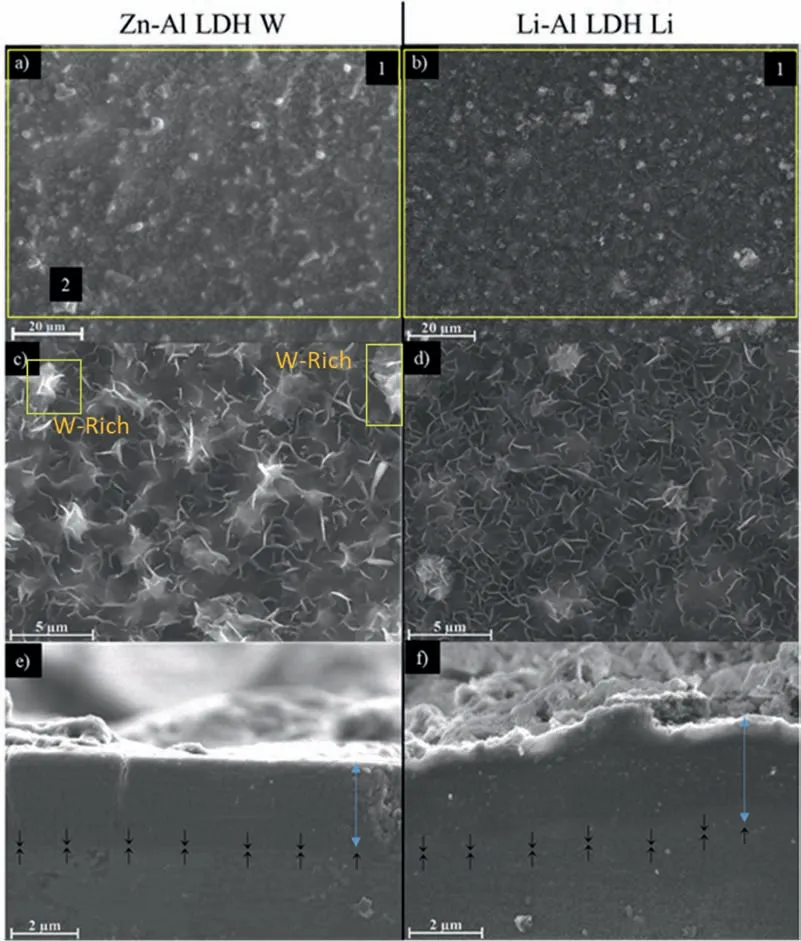
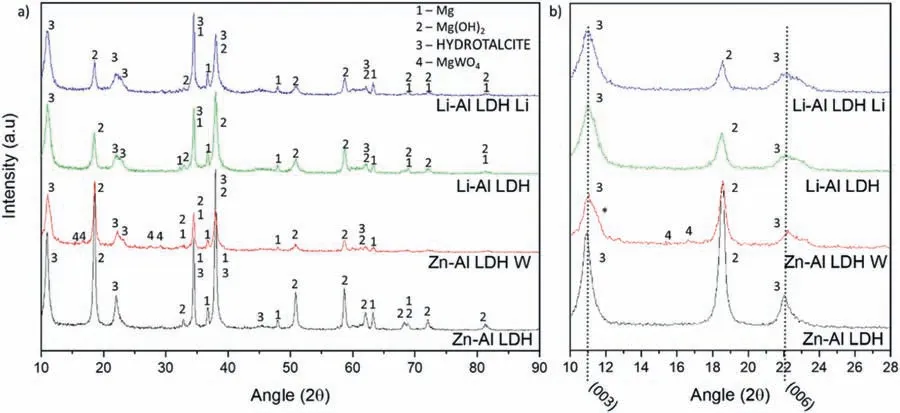
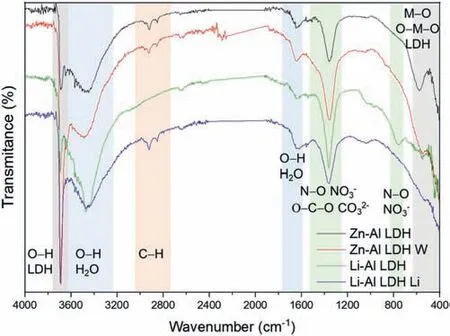
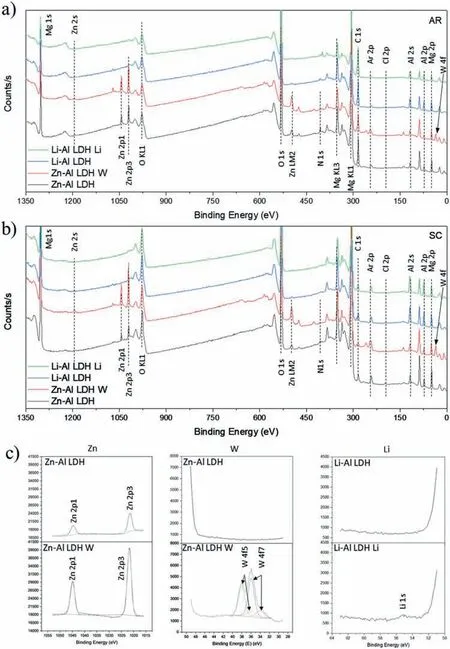
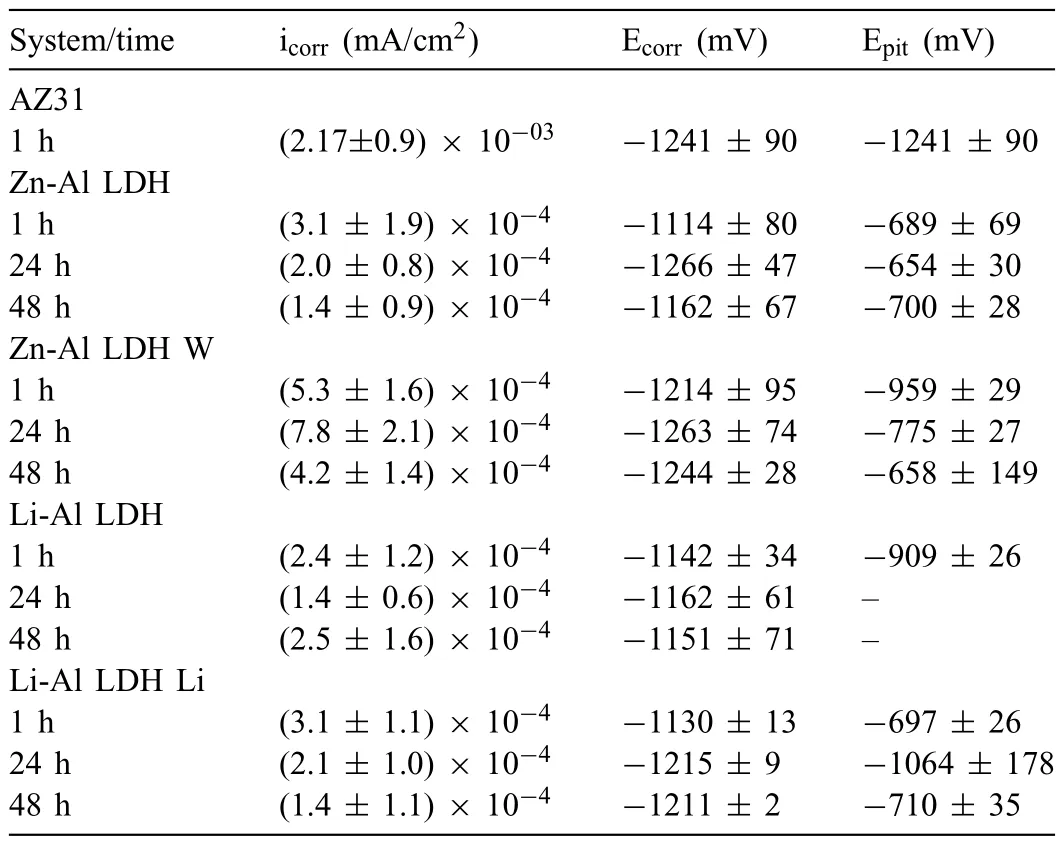
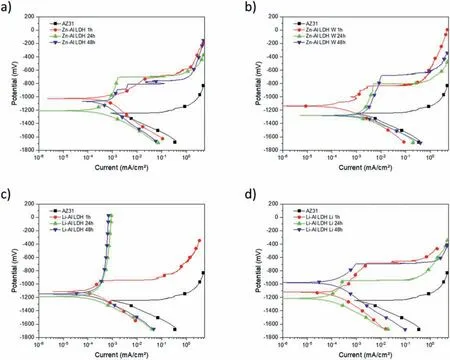
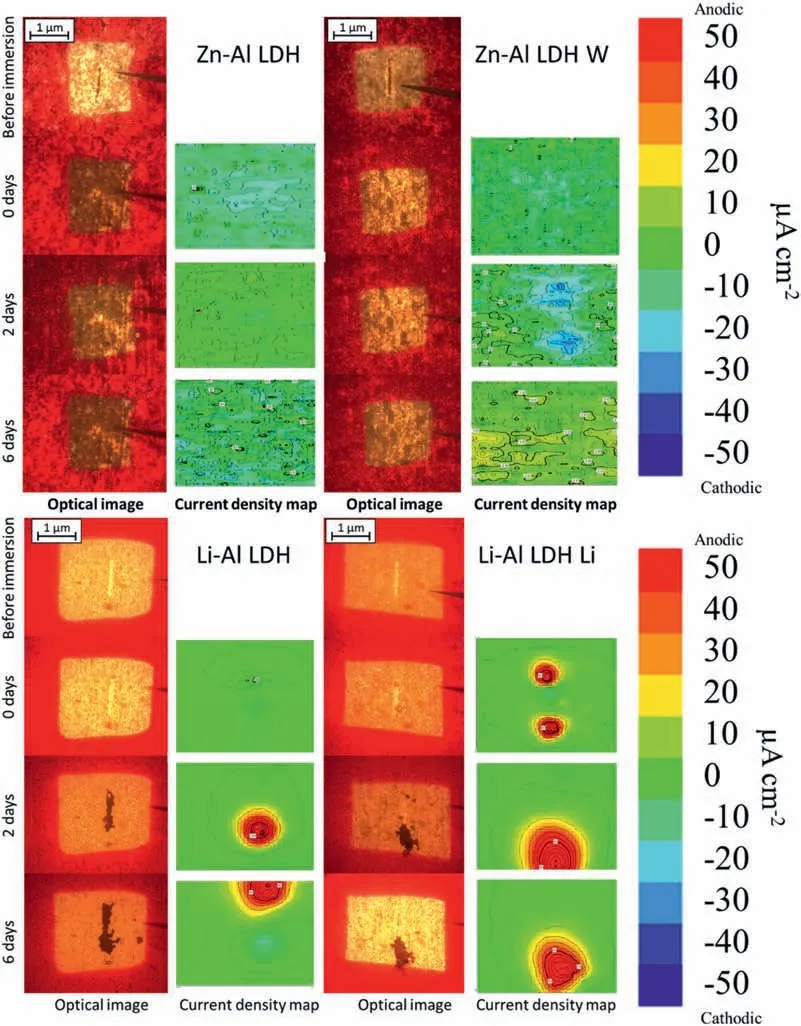
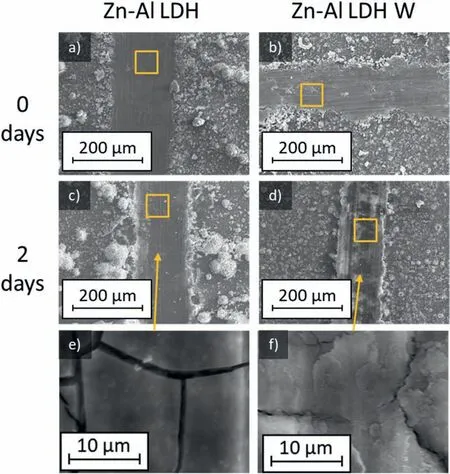
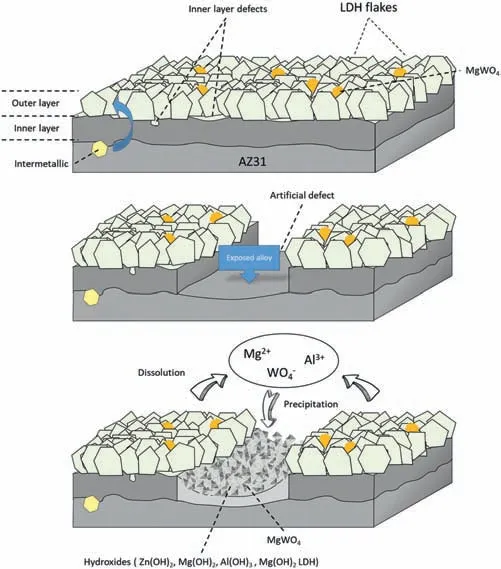
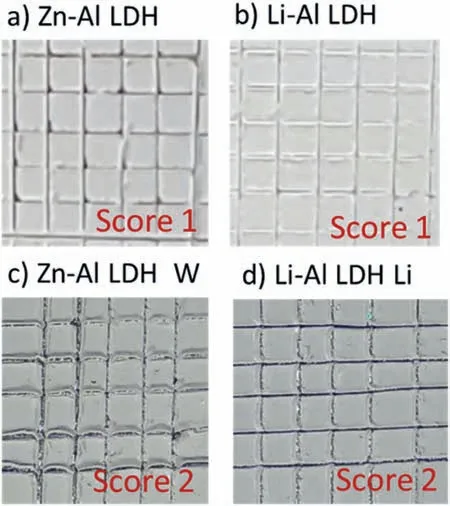
LDH or hydrotalcite−like systems can be described as positively−charged mixed metal (M2+,M3+) hydroxide layers and interlayers occupied by anions (Am−:NO3−,Cl−,CO32−,etc.) and water molecules.The general formula of the most common LDHs can be represented as [M2+(1−x)M3+x(OH)2]x+[(Am−)x/n·nH2O]x−[10].The M(II)/M(III) ratio may vary according to the synthesis conditions and initial salts concentrations.In most cases,this ratio lies between 0.10 and 0.33.The stability of LDH increases in the order Mg2+ In-situgrowth and co−precipitation methods are commonly used to synthesize LDH coatings.In-situprocesses can be subdivided into several categories (one−step,two−step,hydrothermal,urea hydrolysis,steam coating,etc.).These are simple,versatile and use the substrate as a source for cations.Co−precipitation methods allow for a greater variety of LDH chemical compositions and,in the case of Mg alloys,are usually carried out in solutions with M2+and M3+ions under high temperature and pressure conditions (i.e.,hydrothermal synthesis). From a corrosion point of view,the most interesting property of LDHs is the anion exchange capacity due to the lack of crosslinking between the hydrotalcite−like layers [13,14].This capacity can be fin −tuned by controlling the size,charge/ratio of metal cations and anions and amount of water[10].As a result,LDH can serve as a nanotrap for corrosive anions or as a container for corrosion inhibitors. Table 1 [15–26] summarizes corrosion results reported for alloy AZ31 with LDH coatings.In general,LDH coatings improve the corrosion performance by up to 4 orders of magnitude in terms of corrosion current density and impedance modulus.Most studies focus on Mg−Al LDH.Other systems include Mg−Fe,Zn−Al and Li−Al.The most common synthesis method is the hydrothermal route,although steam coating,two−step,and urea hydrolysis have also been used. Table 1 Synthesis method and corrosion performance of different LDH coatings on AZ31. Only a few studies [22,24–26] addressed the intercalation of inhibitors.Zeng et al.[22] synthesized a molybdate intercalated hydrotalcite coating with nanosized lamellar structures that,according to FTIR measurements,released MoO42−which acted as anodic inhibitor.Chen et al.[24]found that Mg−Al−ASP−LDHs had better corrosion resistance than Mg−Al−NO3−LDHs owing to the corrosion inhibition of aspartic acid (ASP) ions and the larger specifi surface area to capture Cl−.Anjum et al.[25] studied the effect of intercalation of 8−hydroxyquinoline (8HQ)corrosion inhibitor into Mg−Al based LDH coating.The enhancement of corrosion resistance was attributed to Cl−and HQ−ion exchange and the redeposition of Mg(HQ)2.Tang et al.[26] intercalated Cl−,VO43−,PO43−,and MoO42−.The results showed that the corrosion resistance decreased in the following order: Zn−Al−VO43−>Zn−Al−MoO42−>Zn−Al−PO43−>Zn−Al−Cl−>Zn−Al−NO3−.The better corrosion behaviour of Zn−Al−VO43−LDH was attributed to its greater ion−exchange ability. In this study,new Zn−Al and Li−Al LDH coatings with incorporated inhibitors (W-,Mo-and Li-based species) are produced on AZ31 Mg alloy.After screening and ranking the coatings by electrochemical impedance spectroscopy (EIS),the best LDH coatings are investigated byX−ray photoelectron spectroscopy (XPS),X−ray diffraction (XRD),contact angle measurements and Fourier−transform infrared spectroscopy (FTIR).The corrosion performance is further evaluated by Scanning Vibrating Electrode Technique (SVET). AZ31B Mg alloy specimens (composition in wt.%: Al 3.1,Zn 0.73,Mn 0.25,Si 0.02,Ca<0.01,Fe 0.005,Cu<0.001,Ni<0.001,Zr<0.001,others<0.30,and Mg bal.) with dimensions of 25×40×3 mm3were pre−treated in a two−step commercial process: (1) alkaline cleaning in 90 g L−1Bonderite C−AK 4181 L for 12 min at 80−90 °C;and(2) acid etching in sulphuric−based solution (10 g L−1Bonderite C−IC 3610,3 min at room temperature).Finally,the specimens were rinsed in deionized water,cleaned with isopropyl alcohol and dried in warm air.Cleaning solutions were replaced every 20 specimens. LDH coatings were synthesized using 500 mL aqueous solutions (pH ∼10) consisting of 0.25 M Zn(NO3)2·6H2O+0.125 M Al(NO3)3·6H2O and 0.125 M LiNO3+0.125 M Al(NO3)3·6H2O,for the so called Zn−Al and Li−Al systems (the naming refers to the main cations used in the solutions).0.0625 M Na2CO3was added as a precipitating agent and the pH was adjusted with 1 M NaOH.The stirred solutions were transferred to a PTFE−lined stainless steel autoclave in which the samples were vertically immersed for 24 h at 125 °C. Inhibitor−containing systems were obtained via immersion of LDH−coated specimens in aqueous solutions containing Na2WO4·2H2O,Na2MoO4·4H2O or LiNO3(0.1 M,pH ∼10)during 2 h at 45 °C,followed by rinsing in deionized water and drying in warm air.The specimens without inhibitors were identifie as Zn−Al LDH and Li−Al LDH.The coatings with inhibitor follow the same naming with the addition of the main element at the end,e.g.,Zn−Al LDH W. The inhibitors used in this work were selected based on the positive results of previous studies with WO4−[27,28],MoO42−[29]and Li+[30].WO4−and MoO42−behave as anodic inhibitors that adsorb on the surface at fl wed areas [31].The role of Li+is more complex,but it seems to be related to the modificatio of the hydroxide layer that forms on the surface [32,33].These inhibitors can be considered “green”alternatives to chromates,which are known to be toxic and carcinogenic [34].It is worth mentioning that the mechanism of inhibitor incorporation may differ depending on the charge of the active species.Anions are expected to incorporate into the intergallery spaces,whereas cations may interact with the hydroxide layer [35]. Surfaces and cross−sections of studied specimens were examined by scanning electron microscopy (SEM,JEOL JSM−6400) and fiel emission scanning electron microscope(FESEM,JEOL JSM 6335F).Coatings cross-sections were prepared by grinding through successive grades of silicon carbide paper with fina polishing to 1 μm diamond fin ish.Both microscopes are equipped with an Oxford Link Energy Dispersive X−ray (EDS) microanalysis spectrometer.The phase composition was analysed by X−ray diffraction(XRD,Philips X’Pert diffractometer,Cu Kα=0.154056 nm,from 10° to 90°,0.05° step size,6 s per step,0.5° grazing angle).Measurements of features such as dimensions of fla es and coatings thicknesses were carried out by image analysis using AxioVision 4.8 software. Fourier transform infrared (FTIR) analysis of the LDH coatings was performed with a Nicolet iS50 spectrophotometer equipped with a KBr beam−splitter,a DTSG−KBr detector and a SpectraTech Performer ATR accessory equipped with a diamond glass.Reported measurements are the average of 128 scans with 4 cm−1resolution. XPS analysis of the samples was carried out using a Thermo Scientifi K−Alpha ESCA instrument equipped with aluminium Kαmonochromatized radiation at 1486.6 eV X−ray source.Due to the non-conducting nature of the samples,it was necessary to use an electron floo gun to minimize surface charging.Neutralization of the surface charge was performed by using both a low−energy floo gun (electrons in the range of 0 to 14 eV) and a low−energy Argon ions gun. The roughness analysis was conducted with a focus−variation optical profilomete (Infinite ocusSL,Alicona) witha×50 magnificatio lens and the IF−Measure Suite software.Cited roughness parameters (Sa;arithmetical mean height and S10z;ten−point height) were determined from the primary surface area and are the average of three measurements. Water contact angle (ϕ) measurements were performed by means of a drop shape analysis system (FTA 1000) with an incorporated high−speed camera (Edmund Optics 5582,Navitar lens) and FTA32 software.Cited values are the average of duplicated specimens.For each specimen,three drops were measured in 20 frames acquired during 15 s from the release of the drop. Paint adhesion tests were carried out in accordance with EN ISO 2409 [36] by 5 line cross−cut with 1 mm spacing obtained using certifie tools (Zehntner Testing Instruments).A three-component epoxy layer applied with a drawbar (∼25 μm-thick layer) and cured for 1 h at 80 °C was used. Electrochemical impedance spectroscopy (EIS) measurements were conducted using a GillAC (ACM Instruments)computer−controlled potentiostat.The exposed area was limited to 1 cm2.Samples were measured by triplicate in 3.5 wt.% NaCl solution at room temperature,(22 ± 2)°C.A three−electrode cell was used.The counter electrode was a graphite electrode and the reference electrode was a silver−silver chloride electrode in 3 M KCl solution(Ag/AgCl KCl).The specimen was connected as the working electrode.A sinusoidal disturbance of 10 mV amplitude was applied in the frequency range of 10 kHz−0.01 Hz. The polarization curves were measured in 0.5 wt.% NaCl solution within −200 mV to +1500 mV with respect to the OCP using a potential scan rate of 0.3 mV/s.Samples were measured by triplicate.Values of corrosion potential (Ecorr)and corrosion current density(icorr)were measured to evaluate the corrosion properties of the materials.Corrosion current density was calculated using the cathodic Tafel slope. The scanning vibrating electrode technique (SVET) was used to measure the local current density at the site of the artificia defects.Defects were produced with a scratcher instrument (CSM Revetest) with a 200 μm Rockwell C diamond indenter by applying a constant load of 4 N,which gives the possibility to prepare reproducible scratches with a controlled depth of ∼5 μm and 1 mm length.A commercial SVET manufactured by Applicable ElectronicsTMand controlled with the software provided by Science WaresTMwas used.The assembly uses an insulated microelectrode of Platinum−iridium manufactured by MicroprobeTMwith a Platinum black deposited on its tip ofø=∼20 μm as a vibrating electrode.The microelectrode was placed at 150 μm above the surface sample.The probe vibration frequency normal to the sample was 67 Hz and the peak-to-peak vibration amplitude was approximately 40 μm.Before the experiments,the microelectrode was calibrated in the working electrolyte following a common procedure described in detail elsewhere [37].All the experiments were carried out in 0.05 M NaCl solution.The area of interest surrounding the defect was masked using a thin layer of sealing lacquer (Electrolube Bloc Lube Red).SVET maps of,on average 2×2.5 mm were recorded on grid of 31×31 points. Scribed samples were exposed to 0.05 M NaCl solution for 48 h.Specimens were manually scribed with a standard zirconia tip across the sample surface (a cross-shaped scribe,with a width of 0.1 mm and a length of 1 cm;the depth of the scribe was larger than the coating thickness and reached the underlying substrate).Scribed specimens were evaluated by SEM/EDS analysis. Eight different LDH systems,with and without inhibitors,were screened by EIS testing following 1 h of immersion in 3.5 wt.% NaCl solution (Fig.1).Examples of the obtained Nyquist diagrams and Bode plots are depicted in supplementary material (Supplementary Fig.S1).In general,coatings show a capacitive arc at high frequencies and an inductive loop at low frequencies.However,those coatings with a higher impedance modulus show a diffusion tail at low frequencies.It is important to note that the comparison of the impedance modulus (|Z|) at low frequency response (0.01 Hz)is a common tool for ranking the corrosion performance of coatings [27],although it has some limitations as it does not always match the corrosion performance obtained by other methods such as salt spray testing. Fig.1.Scatter diagram of impedance modulus at 0.01 Hz for the AZ31 alloy with and without LDH coatings.Filled symbols correspond to the specimens loaded with corrosion inhibitors.Note that each system is measured by triplicate,although some points are overlapped so only one or two are observed. Compared with the bare alloy,Zn−Al and Li−Al LDH coatings increase the impedance modulus by one and two orders of magnitude,respectively.Loading of Li−,Mo−and W−based corrosion inhibitors improved the corrosion resistance of Zn−Al LDH,with sodium tungstate yielding the highest impedance values (|Z|0.01Hz∼105Ωcm2).As for the Li−Al LDH system,only the Li−based inhibitor increased the impedance response (|Z|0.01Hz∼6×10⁴Ωcm2). Zn−Al LDH W and Li−Al LDH−Li systems were selected for further evaluation based on this initial corrosion screening.A quick comparison with the values included in Table 1 reveals that the selected systems are among the best in terms of low frequency impedance response.In the following sections,inhibitor−free LDH systems are also included for comparison. Fig.2 shows the SEM plan−view micrographs of Zn−Al and Li−Al LDHs,where their fla e−like morphology is clearly visible.Both coatings cover the entire surface and show LDH islands that are larger in the Zn−Al system.The agglomeration of fla es that form the islands is attributed here to the increased amounts of available cations(i.e.,Mg2+,Al3+),preferentially at the location of Al−Mn inclusions.Enhanced dissolution is expected to occur in these regions due to two phenomena: i) micro−galvanic corrosion between inclusions and the surrounding matrix;and ii) selective Al dissolution or de-alloying in the Al−Mn inclusions due to the highly alkaline conditions(pH 10)during treatment.Note that chemical dissolution of the Al−Mn inclusions is still possible even when they should be acting as cathodes [38].Fig.2d shows an example of partially dissolved Al−Mn inclusions surrounded by the thicker coating material. Fig.2.Planar view micrographs of Zn−Al LDH (a,c,e) and Li−Al LDH (b,d,f) coatings.The EDS analysis results are collected on Table 2. Fig.2d shows an example of partially dissolved Al−Mn inclusions surrounded by the thicker coating material. EDS area and point analysis labelled in Fig.2 are shown in Table 2,along with the EDS results obtained for the bare material (not shown in Fig.2).Both coatings show increased Al content (6 −8 at.%) in comparison with the bare material (∼2.4 at.%).This is consistent with the incorporation of this element into the LDH structure.Similarly,the Zn−Al LDH shows a higher amount of Zn on its surface (∼2.9 at.%)compared with the as−received alloy (∼0.4 at.%).Li was not observed in the Li−Al system due to the difficultie in detecting this element by EDS.Note the high amount of Mn and Fe and the low Al/Mn ratio in point 2 in Fig.2d,which evidences the preferential dissolution of Al in the Al−Mn inclusion.It is worth mentioning that not all the islands show the presence of Al−Mn inclusions (e.g.,point 2,Fig.2a). Table 2 EDS quantificatio in at.% on AZ31,Zn–Al LDH (Fig.2a),Li–Al LDH(Fig.2b and 2d),Zn–Al LDH W and Li–Al LDH Li (Fig.4) in the specifie areas. Micrographs at higher magnificatio revealed that the fla es are mostly oriented perpendicularly to the surface,indicating a faster growth rate in the direction of the bulk solution(Fig.2e and 2f).This is typically observed in LDHs systems and is the result of their anisotropy (i.e.fla es growth in the ab−direction faster than in the c−direction)and the hampered growth of fla es oriented horizontally to the surface [39]. Fig.3.This figur presents the cross−sectional view (a) of the Zn−Al LDH and (b) Li−Al LDH coatings.The interface between the coating and the bulk material is indicated here by white arrows.Blue arrows mark the overall thickness of the LDH coatings (For interpretation of the references to color in this figure the reader is referred to the web version of this article.). Flakes in the Zn−Al LDH are thicker and larger than those in the Li−Al system.Image analysis measurements (obtained from planar views micrographs) yielded thickness and surface area values of (300±50) nm/(31.6 0.5) μm2and(5±3) nm/(560±50) nm2,for the coating fla es,respectively.Considering that similar conditions were used for both LDH treatments,it is evident that the differences in size are related to the characteristics of Zn2+and Li+cations. Cross-section examination of the LDH coatings shows a bi−layer structure composed of an outer part with loose fla es(∼30% of the layer) and a denser inner layer (Fig.3).The overall LDH conversion layer is thicker when Zn cations are used (5.2±0.5 μm) in comparison with the Li−based solution (3.8±0.4 μm).This bi−layer structure is often seen in LDH conversion coatings [19,22,40] and is related to differences in fla e−size and crystallinity of the coating material.For instance,Lin et al.[41] reported that the inner layer was less crystalline than the outer one in a Mg−Fe−LDH coating formed on a 99.9% Mg.It is suggested here that the interface between the two layers roughly corresponds to the original surface as it shows a very fla profil (further studies are needed to confir this). Detailed mechanistic studies of LDH fil formation can be found elsewhere [42,43].Differences in structure and morphology of LDH film are mainly related to the source and availability of cations.The high supply of cations coming from dissolution of the substrate results in high a nucleation rate due to faster achievement of the solubility limit of Mg2+compounds.This leads to small but numerous LDH fla es in the inner layer (next to the substrate/solution interface).Further away from the substrate,the concentration of cations is lower and,consequently,the nucleation rate decreases,resulting in fewer but larger LDH fla es in the outer layer [43]. Fig.4 shows the SEM characterization of the studied LDH systems after post−treatment with W−and Li−based inhibitors.The Zn−Al LDH−W coating shows a smoother morphology than the Zn−Al LDH coating,although some small islands are still scattered over the surface (Fig.4a).The EDS analysis shows that these islands contain slightly more W (∼0.5 at.%) than the surrounding coating material(∼0.1 at.%).Some Na contamination is also present in the coating (∼0.6 at.%) (Table 2).According to the Pourbaix diagram of W(298 K,[WO42−]=10−6molL−1)[44],tungstates are soluble in alkaline aqueous solutions.Therefore,W−rich precipitates such as WO3are not expected to form during post−treatment at pH 10.The precipitation of Al2(WO4)3can also be ruled out as the amount of Al in the deposits is quite small (0.2 at.%).Therefore,the presence of W in the coating is most likely due to the incorporation of WO42−ion into the LDH structure or to the precipitation of MgWO4(pKα=6.46).Li−rich deposits or precipitates,if any,were not detected in the Li−Al LDH Li coating.The surface also appeared smoother than the inhibitor−free coating (Fig.4b,d compared to Fig.2b,d,f) . High magnificatio plan views reveal that,after post−treatment with inhibitors,LDH fla es are smaller and are not very well−define (Fig.4c and 4d).This is attributed to the partial dissolution of the outer layer,as evidenced by the cross sections (Fig.4e and 4f).During post−treatment at pH 10 and under the non-saturated conditions,LDH fla es gradually dissolve,particularly those in the outer layer as they are loosely bonded to the surface.Note that some of the dense inner layers were also lost during post−treatment,but the thickness loss can be considered negligible (<0.5 μm).After post−treatment,the coating thicknesses were ∼2.7 and ∼2.5 μm for the Zn−Al LDH W and Li−Al LDH Li,respectively. Fig.4.Plan view and cross section SEM micrographs after post−treatment.Zn−Al LDH planar−view (a and c) and cross−view (e).Li−Al LDH plan−view(b and d) and cross−view (f).The EDS analysis results are collected in Table 2. Fig.5 presents the grazing angle X−ray diffraction(XRD) pattern for the studied coatings before and after post−treatment.All coatings show the characteristic peaks of hydrotalcite−like LDH structure with a rhombohedral unit cell and R−3 m space group [45].Mg(OH)2was also identified which is a common subproduct formed during the synthesis of LDH in alkaline conditions (pH>10.8) [46].Despite using glancing angle for the measurement and due to the low thickness of the studied coatings,peaks from theα−Mg phase of the substrate are also identifie at 34,36 and 47°. Table 3 shows the basal plane spacingdcalculated using Bragg’s equation and the unit cell parametersaandc(a=2d110;c=3d003[47]) of LDH structures calculated from (003),(006) and (110) reflection at ∼11°,∼18.5° and 62°,respectively.The inhibitor-free structures present a d003value of 0.8098 and 0.8058 nm,for Zn−Al LDH and Li−Al LDH,respectively,which are consistent with hydrotalcite−like systems intercalated with NO3−anions [47].The shoulder peaks identifie for (003) and (006)refl xions at slightly higher 2−theta values suggest the partial intercalation of CO32−/OH−ions between the LDH layers[48].The d003values correspond to the basal spacing of two consecutive hydrotalcite−like layers,therefore,it is possible to calculate the intergallery height by subtracting the basal spacing of the cationic layer (brucite−like,4.8) (Table 3).The intergallery height of both systems is comparable,being 3.298 and 3.258for Zn−Al LDH and Li−Al LDH,respectively. Table 3 XRD peak indexing results for the (003) and (006) planes of the LDH structure. Fig.5.(a) XRD patterns for the coatings.(b) Amplificatio of selected region from 10 to 28°. After the post−treatment,the characteristic LDH reflec tions (003) and (006) of both LDH systems show a lower intensity and remain at a relatively invariable 2q (Fig.5b).The lower intensity is related to the removal of the external loose layer of the coating during the post−treatment.It is worth mentioning that the shoulder peak identifie for (003)refl xion at slightly higher 2−theta values became clearer in the case of Zn−Al LDH-W (labelled∗in Fig.5b) which is probably related to an intense intercalation of partial CO32−/OH−ions with a smaller size compared to NO3−between the LDH layers during the post−treatment. The invariable reflectio 2θsuggests that the corrosion inhibitors were not incorporated within the intergallery space,although they may be incorporated in edge positions,as suggested by Sels [49].Therefore,the basal plane spacing,d,and the unit cell parameter c remained constant after the treatment.Theab−axis values also remained constant,which indicates that the inhibitors did not modify the cationic hydroxide layers.In Zn−Al LDH-W,W−rich particles in the form of MgWO4were detected at 12,16.5 and 29° and observed on the SEM micrographs (Fig.4).This confirm their incorporation into the LDH system.Considering the low solubility of MgWO4,these are likely to be physically adsorbed on the LDH’s most external layers.The inhibitor Li+in the Li−Al LDH-Li system is not likely to be incorporated between the LDH layers due to its positive charge.Li+is most probably located at the most external layers (top and bottom) of the LDH systems creating an electric double layer with the NO3−ions which remain attracted by electrostatic interactions to the LDH layers. Fig.6.FTIR spectra of Zn−Al LDH,Zn−Al LDH W,Li−Al LDH and Li−Al LDH Li coatings on AZ31 Mg alloy. The FTIR spectra of the different LDH coatings with and without intercalated inhibitors are shown in Fig.6.The intense band located at 3683 cm−1corresponds to O−H stretching mode of hydroxyl groups of the LDH layers (Zn−OH,Mg−OH,and Al−OH) [50].The bands at 3650−3170 cm−1and 1726−1505 cm−1are assigned to tension and bending vibrations,respectively,of the O−H bonds of water molecules intercalated between the LDH layers.The bands at 1690−1480,760 and 578 cm−1correspond to the asymmetric stretching,out−of−plane symmetric and antisymmetric deformation modes of NO3−ions intercalated between the LDH layers,respectively [48].The band at 1690−1480 cm−1could also be correlated to the symmetric stretching vibrations of O−C−O bond of CO32−anions.The bands at lower wavenumbers (761−546 cm−1) correspond to the stretching vibrations of M-O (M: Al,Zn) of the LDH [51].The bands between 3000 and 2775 cm−1correspond to C−H vibrations associated with the presence of superficia contamination in the form of hydrocarbons. Fig.7.XPS spectra of the studied specimens a) before and b) after 10 min of argon sputtering.c) High−resolution Zn,W and Li spectra obtained after 10 min of argon sputtering of the LDH coatings on AZ31. XPS analysis(Fig.7)was carried out to obtain quantitative compositional information of the studied materials (Table 4).Fig.7a and 7b show the XPS spectra of the LDH systems before and after 10 min of argon sputtering,respectively.Fig.7c shows the high−resolution XPS spectra of elements Zn,W and Li after sputtering. Table 4 XPS elemental composition (at.%) of studied coatings. The most superficia layer of all the studied materials in the as−received condition shows varying amounts of adventitious C.The C 1s signals at 285 and 286 eV correspond to long chain hydrocarbons (C–C,C–H) which were also evident in the FTIR analysis.After sputtering,the signals at 285 and 286 eV diminished and a small peak at ∼290 eV,corresponding to carbonate ions,appeared(Fig.7b).This suggests the intercalation of CO32−between the LDH galleries,as evidenced by the shift of the peak (003) in XRD.The intensity of this signal increases on the deeper layers of the coating as the superficia contamination is sputtered away.In the as−received condition,only one O 1s signal is identifie at ∼532 eV which is assigned to O atom in metal−hydroxide species (or hydroxyl groups -OH) [52,53].Another confirma tion of the presence of magnesium hydroxides is the Auger parameter values of 997.23 eV to 997.47 eV [54].The latter is calculated by the difference between Mg 1s and Mg KLL peaks[54].After sputtering,its intensity decreases and a new contribution appears at lower binding energy (∼530 eV),which can be assigned to metal carbonates.It is worth mentioning that the peak related to MgO was not observed (typically at ∼1.5 eV of Mg 1s and Mg 2s binding energies[55,56]).The Al 2p peak at ∼74 eV is possibly related to the bonding energy of Al(OH)3.Zn is present in Zn−Al LDH samples;in the Li−Al LDH system,small amounts of Zn were also detected but disappeared after sputtering,suggesting superficia contamination.The twin peaks at ∼1021 eV and ∼1044 eV are assigned to Zn 2p3/2and Zn 2p1/2,respectively (Fig.7c),suggesting that Zn is present in the LDH in the divalent oxidation state [57].In the case of Zn−Al LDHW system,a peak associated with tungsten is observed at 50 eV.In the as-received condition,the W 4f high resolution spectra show a split peak at 35.48 and 37.58 eV,while after sputtering (Fig.7c),two doublets 4f7/2 −4f5/2 are fitte at 34.08−35.94 eV and 35.99−38.04 eV,respectively,which are associated with a tungsten oxidation state +6,probably in the form of WO42−[58,59].Li was identifie in Li−Al LDH and Li−Al LDH-Li systems at 55.33 eV (Li 1s). Table 4 shows the quantitative chemical analysis before and after sputtering of the studied materials.In the as received condition,in both Zn−Al LDH and Li−Al LDH systems,N is identified from the intercalation of NO3−anions between the LDH layers.It is worth mentioning that Zn−Al LDH-W did not present N,suggesting the partial intercalation of CO32−/OH−ions between the LDH layers.This is in agreement with the shoulder peaks identifie for (003) and (006) refl xions at slightly higher 2−theta values.In the case of Li−Al LDH system,the N content increased after the post−treatment in LiNO3,where further NO3−are incorporated into the structure.Although a characteristic peak of Li was identified the detected amount was below the limit of quantification In the as received condition,the (Mg+Zn)/Al ratios are∼2.3 and ∼1.0 for Zn−Al and Li−Al LDH,respectively.After sputtering,the ratios increase as the surface contamination is removed(∼3.9 and ∼1.5)for Zn−Al and Li−Al LDH,respectively).In both systems,the specimens containing corrosion inhibitors show a slightly lower ratio which could be associated with the selective dissolution of Mg during the immersion post−treatment,where the most superficia layer of the coating is completely removed. Fig.8 shows the polarization curves of the studied coatings after 1,24 and 48 h immersion in 0.5 wt.% NaCl.The electrochemical data obtained from the curves are gathered in Table 5,including the standard deviation estimated from three separate measurements.The results acquired for the uncoated AZ31 alloy after 1 h of immersion are shown for comparison. After 1 h of immersion,all the coatings revealed nobler corrosion potential,Ecorr,and lower corrosion current density,icorr(1100–1200 mV,∼10−4mA/cm2).This indicates improved corrosion protection performance compared to the substrate (∼1240 mV,10−3mA/cm2,Table 5).It is also evident that the coatings increased the pitting potential,Epit,with values up to ∼700 mV.Note that the bare substrate showed an anodic branch with a very low slope,indicating spontaneous pitting under non-polarized conditions. A quick comparison with the literature data included in Table 1 reveals that the relatively thin coatings developed in this work are amongst the best performers.In general,the icorrvalues reported by other studies are close to 10−3mA/cm2,which is one of order of magnitude higher than the values obtained in this study. Table 5 Polarization data of tested materials as a function of immersion time in 0.5 wt.% NaCl aerated solution. Comparison between the polarization curves does not reveal significan differences between the studied coatings with the exception of the Li-Al LDH coating which,after 24 h and 48 h of immersion,shows a very steep anodic branch without pitting potential.Therefore,the applied post-treatment reduced the resistance to localized corrosion,possibly due to the dissolution of the outer LDH layer. Fig.8.DC polarization curves of (a) Zn-Al LDH,(b) Zn-Al LDH W,(c) Li-Al LDH Li and (d) Li-Al LDH Li after 1 h,24 h and 48 h of immersion in 0.5 wt.% NaCl.The polarization curve of AZ31 uncoated material after 1 h of immersion is shown for comparison. To evaluate the corrosion protection efficien y offered by the encapsulated corrosion inhibitors,the coatings were artifi cially scratched and their electrochemical response was analysed by SVET up to 6 days of immersion in 0.05 M NaCl. Fig.9 shows the optical images of the artificia defect and the SVET maps at the same location at different immersion times. For Zn−Al LDH,right after the immersion,two features were observed: the discolouration of the surface and blurring of the defect,making it indistinguishable from the intact coating.At this stage,the current density values remained relatively low (±10 mA/cm2) and no H2bubbles were formed.This behaviour continued after 2 and 6 days of immersion and the corrosion response at the location of the defect remained relatively unchanged.This behaviour may be explained by the partial dissolution of the LDH fla es and redeposition of the coating material at the location of the artificia defect.The specimen containing the corrosion inhibitor (Zn−Al LDH W)showed a similar trend,although the loss of brightness was less severe,indicating an improved corrosion resistance.The defect became indistinguishable in the optical image and low currents in the range of ±10 mA/cm2were registered.Two cathodic spots are formed after 2 days of immersion,indicating the electrochemical activity associated with corrosion initiation. Fig.9.Optical images and SVET 2D current density maps of 1 mm scratch defect and the surrounding area up to 6 days of immersion in 0.05 M NaCl solution. Interestingly,after 6 days of immersion,these two spots disappeared,which could be related to an active protection mechanism.Fig.10 and Table 6 show the SEM/EDS results of Zn−Al LDH and Zn−Al LDH W during the firs 2 days of immersion in 0.05 M NaCl. Before immersion,the scratches are clean and with depth values greater than 7 μm (measurements not shown).EDS results at the location of the scratches show high and low amounts of Mg and O,respectively,in comparison to nonscribed regions (Tables 6 and 2),showing that the defect has reached the substrate.After 2 days of immersion,there is an increase in the O content in the scribe,which is indicative of corrosion,however,there is also W and Zn enrichment(Table 6).The presence of W inside the scribe,where there was none before the immersion,suggests that WO42−is released from the intact coating zones and then precipitates at the defect.Note that the non-scribed areas in the Zn-Al LDH specimen show islands of corrosion products,which explains the loss of brightness that was previously mentioned. Table 6 EDS quantificatio in at.% inside the scratch for Zn–Al LDH (Fig.9a,c),and Zn–Al LDH W (Fig.9b,d). Table 7 Roughness parameters (Sa;arithmetical mean height and S10z;ten−point height). Fig.10.SEM micrographs of the scratched regions for up to 2 days of immersion in 0.05 M NaCl.Zn−Al LDH (a,c,e) and Zn−Al LDH W (b,d,f). The general protective mechanism could be associated with two phenomena : (i) the dissolution−redeposition of the LDH coating material (some liberation of Zn2+ions from the LDH structure may also occur,which are likely to precipitate in the form of Zn(OH)2) and,(ii) the dissolution/redeposition of MgWO4.In both cases,these insoluble deposits would isolate the exposed magnesium substrate from the aggressive media,thus reinstating partially the passive properties of the coating while preventing corrosion propagation.The protective corrosion mechanism is represented in Fig.11 which is based on the combination of three phenomena: ion−exchange,deposition of hydroxides and competitive adsorption. In the case of the Li−Al LDH system with and without corrosion inhibitors,a high anodic activity (50 mA/cm2) is identifie at the location of the defect from the beginning of the immersion test.This is accompanied by an intense generation of H2bubbles.Over time,corrosion progresses catastrophically through the exposed substrate and several initiation points are also developed outside the scribed area.This indicates that the barrier properties of this system are not that good when there is a defect on the surface [60]. Fig.11.Schematic representation of Zn−Al LDH W protective corrosion mechanism. The contact angle measurements were performed to evaluate the hydrophilicity/hydrophobicity of the developed coatings (Fig.12).All coatings show a hydrophilic behaviour.Zn−Al LDH shows a 0° contact angle and the water drop was completely spread on the coating’s surface.Li−Al LDH presents a slightly higher contact angle,13°,which is also considered highly hydrophilic.In both systems,this behaviour can be explained by the presence of hydroxyl groups within the LDH structures that can easily interact with water molecules through hydrogen bonding [61].This extreme hydrophilicity may cause the aggregation of the LDH fla es and significan water adsorption,which may promote corrosion initiation if the aqueous environment reaches the substrate.Both specimens containing corrosion inhibitors show higher contact angles,58nd 43°for Zn−Al LDH and Li−Al LDH,respectively.This increase can be related to the loss of the outer layer that modifie the roughness of the coating and to the presence of inhibitor-containing species at the LDH surface that prevents the formation of hydrogen bonding.In case of Zn−Al LDH W,these could be W−rich solid precipitates,while in case of Li−Al LDH-Li it could be associated with the adsorption of Li+cations. The roughness values of the studied coatings are presented in Table 7.The analyses of Zn−Al LDH and Li−Al LDH reveal fundamental differences between them.The Zn−Al LDH shows the highest values among studied coatings.This may be related with the presence of agglomerated fla es on top of the intermetallic particles,as observed in the SEM micrographs(Fig.2).This promotes the water adsorption,which is in accordance with the contact angle values.The post−treatment for that system results in the dissolution of the most external layer of the coating,including the above−mentioned agglomerations,leaving the dense and uniform inner layer exposed.As expected,this leads to a reduction of the superfi cial roughness (Saand S10z) and,consequently a decrease in the hydrophilicity as observed in the increased contact angle values after the post−treatment.The differences in the surface roughness for the Li−Al LDH system before and after post−treatments were not significant probably due to the lack of agglomerate fla es and their smaller size in comparison to Zn−Al LDH. Fig.12.Water contact angle measurements: a) Zn−Al LDH,b) Zn−Al LDH W,c) Li−Al LDH and d) Li−Al LDH Li. Fig.13.Paint adhesion of LDH coatings on AZ31:a)Zn−Al LDH.b)Li−Al LDH.c) Zn−Al LDH W.d) Li−Al LDH Li. The paint adhesion property of the coatings was evaluated according to the EN ISO 2409 standard using a water-based paint,where scores are allocated to quantify the area affected by paint delamination.The scale ranges from 0 to 5,where 0 corresponds to a 0% area delaminated,1 to 〈5%,2 to 5 -15%,3 to 15-35%,4 to 35-65% and 5 to an area 〉65%.Fig.13 shows the cross−cut test results and the allocated scores.Some differences are observed between the inhibitor−free and the inhibitor−containing LDH coatings.The Zn−Al and Li−Al LDH specimens show a paint adhesion score of 1,since some detachment of small fakes of the coatings was observed at the intersection of the cuts.This indicates a relatively good paint adhesion property,which can be explained by the high hydrophilicity and roughness of the most superficia layer of the LDH coating to prior the immersion post−treatment that provides a high surface area for an optimal paint anchorage. The coatings containing corrosion inhibitors,Zn−Al LDH W and Li−Al LDH Li,obtained after the post−treatment,exhibit a slightly higher level of delamination (score 2).However,it remains in the lower range (∼5%).The coatings fla e along the edges and at the intersections of the cuts.The slight decrease in paint adhesion is due to the physical and chemical changes suffered by the most external layer of the coating after the post−treatment resulting in a smoother surface with slightly higher hydrophobicity.Consequently,the contact area available for the pain anchorage is reduced,resulting in a decrease of the paint adhesion. The main conclusions of this work are summarised as follows: -Different Zn−Al and Li−Al LDH systems containing Li−,Mo−and W−based corrosion inhibitors were successfully synthesized and optimized in terms of corrosion resistance.The coatings with the highest corrosion resistance Zn−Al LDH W and Li−Al LDH Li were selected for further evaluation. -XRD,FTIR and XPS analysis confirme the incorporation of the inhibitors into the LDH structure.W is incorporated in the form of WO42−and it is likely to be physically adsorbed on the LDH’s most external layers.In contrast,Li is incorporated in the cationic form Li+and remains attached to the top and bottom layers of the LDH system attracted by electrostatic interactions. -The applied post−treatments results in the selective dissolution of the outermost layer of the LDH coating,reducing hydrophilicity and paint adhesion of the coatings. -Potentiodynamic polarization tests revealed that all the studied coatings reduced the corrosion current density and increased the pitting resistance of the AZ31 alloy. -The active corrosion properties of the Zn−Al−LDH W coating were confirme by SVET and SEM/EDS results on scribed specimens.The Li−Al LDH system did not show active protection. -The inhibition corrosion mechanism is attributed to the combination of three phenomena:ion−exchange of aggressive Cl−ions,dissolution−redeposition of LDH coating material,including W−rich precipitates. Declaration of Competing InterestThe authors declare that they have no known competing financia interests or personal relationships that could have appeared to influenc the work reported in this paper. Acknowledgments The authors gratefully acknowledge the support of the RTI2018-096391-B-C33 FEDER/ Ministerio de Ciencia e Innovación−Agencia Estatal de Investigación,S2018/NMT−4411 Regional Government of Madrid and EU Structural and Social Funds and PID2021-124341OBC22 (MCIU/AEI/FEDER,UE).M.Mohedano is grateful for the support of RYC-2017 21843,Ministerio de Ciencia e Innovación.B.Mingo is supported by the Royal Academy of Engineering through the RAEng Research Fellowship and by EPSRC (EP/V026097/1) Supplementary materials Supplementary material associated with this article can be found,in the online version,at doi:10.1016/j.jma.2022.09.014.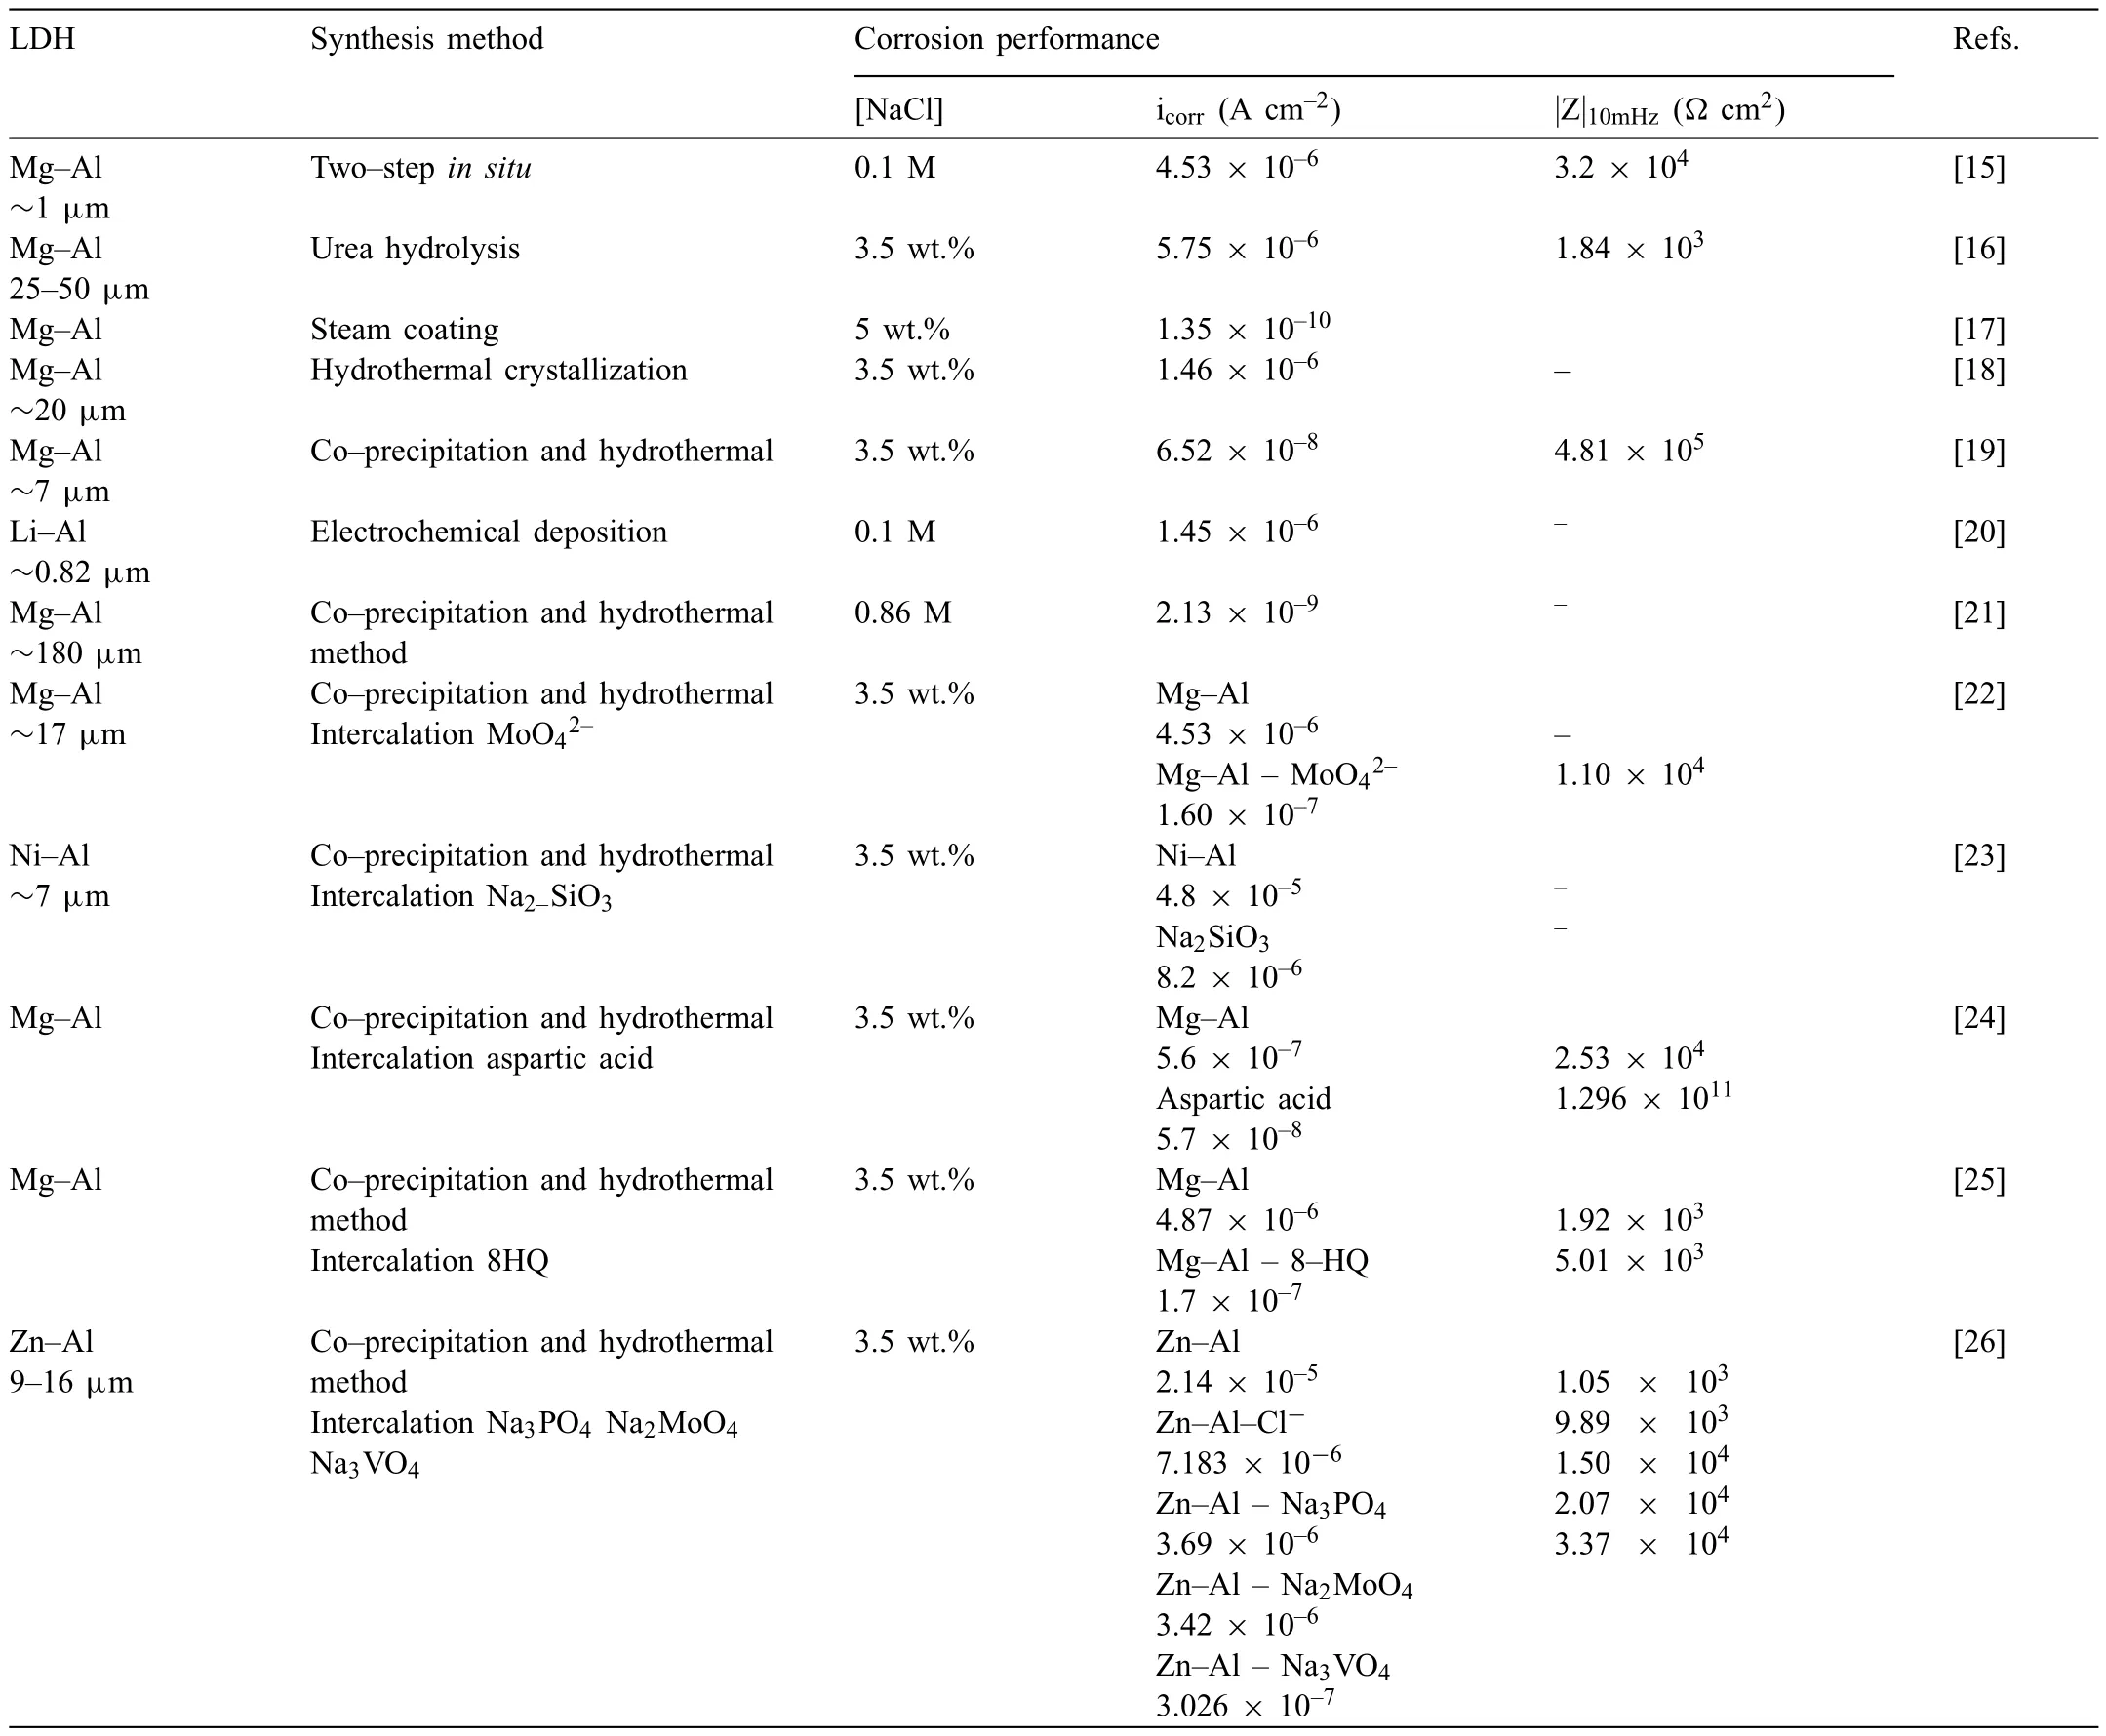
2.Material and methods
2.1.Material
2.2.LDHs synthesis
2.3.Surface characterisation
2.4.Corrosion tests
3.Results and discussion
3.1.Inhibitor screening
3.2.Characterization


3.3.Potentiodynamic polarization measurements
3.4.SVET measurements


3.5.Contact angle and surface analysis
3.6.Paint adhesion

4.Conclusions
杂志排行
Journal of Magnesium and Alloys的其它文章
- Development of high-strength magnesium alloys with excellent ignition-proof performance based on the oxidation and ignition mechanisms: A review
- Development and application of magnesium alloy parts for automotive OEMs: A review
- Recent advances in surface endothelialization of the magnesium alloy stent materials
- Recent developments in high-pressure die-cast magnesium alloys for automotive and future applications
- Exploring the contribution of oxygen reduction reaction to Mg corrosion by modeling assisted local analysis
- Microstructures,mechanical properties,corrosion,and biocompatibility of extruded Mg-Zr-Sr-Ho alloys for biodegradable implant applications
