Wave Force on the Crown Wall of Rubble Mound Breakwaters at Intermediate Depths
2023-03-17HANXinyuandDONGSheng
HAN Xinyu, and DONG Sheng
Wave Force on the Crown Wall of Rubble Mound Breakwaters at Intermediate Depths
HAN Xinyu, and DONG Sheng*
College of Engineering, Ocean University of China, Qingdao 266100, China
Rubble mound breakwaters with a crown wall are a common coastal engineering structure. The wave force on crown walls is an important parameter for the practice engineering design. Particularly, the wave force on crown walls under intermediate depths has been studied through physical model tests and numerical simulations. In this study, a three-dimensional numerical wave flume was developed to investigate monochromatic wave interactions in a rubble mound breakwater with a crown wall. Armor blocks were modeled in detail. The Navier-Stokes equations for two-phase incompressible flows, combined with shear stress transportturbulence model and volume of fluid method for tracking the free surface, were solved. A set of laboratory experiments were performed to validate the adopted model. Subsequently, a series of numerical simulations were implemented to examine the impacts of different hydrodynamic parameters (including wave height, incident wave period, and water depth) and the berm width on the wave force of the crown wall. Finally, a comparison of the experimental results and Martin method shows that the latter method is not suitable for this experimental scope. New empirical formulas are proposed to predict the wave force on crown walls under intermediate depth. The results can provide a basis for the design of crown wall of rubble mound breakwaters at intermediate depths.
wave force; crown wall; rubble mound breakwater; intermediate depth; experimental test; numerical simulation
1 Introduction
Crest elevation affects construction costs, overtopping rates, and the visual impact of breakwaters. The design of mound breakwaters must ensure a lower overtopping dis- charge than the tolerable limits for port operations and structural stability. A concrete crown wall is commonly designed to increase the crest freeboard and decrease the consumption of quarry materials. The crown wall also im- proves the accessibility of breakwaters and must withstand wave loads and other forces.
Iribarren and Nogales (1954) first presented the wave pressure distribution of crown walls. This method was only applied to a specific breakwater geometry and broken waves before arriving at a superstructure. However, it does not consider the influence of the berm width and wave height. According to Martin(1999), this method is quite conservative. Günback and Göcke (1984) proposed a method for assessing the wave pressure on a crown wall based on physical tests. They believed that the maximum wave force is composed of the impact pressurePcaused by the wave impact when the waves run-up to the maximum level and static pressureP. In this way, they divided the wave pressure distribution on the crown wall into rectangular and wedge-shaped distributions, which are asso-ciated with the kinetic energy and run-up, respectively. If the bottom of the crown wall is protected by armor blocks, then the impact wave distribution is linearly reduced to 50% in the protected area. Günback and Göcke (1984) first proposed the uplifting pressure distribution. They assumed that the wave pressure near the front of the crown wall was equal to the horizontal pressure at the bottom. If the dynamic effect is ignored, then this assumption is phy-sically correct. The uplifting pressure distribution is triangular. At the end of the bottom, the pressure is zero. Günback and Göcke (1984) first connected the horizontal wave force with the wave run-up and proposed a triangular form of the uplifting pressure distribution. These ideas were adopted by the following works. Jensen (1984) examined the wave force on a crown wall under irregular waves. Using experimental data, Jensen found that with the increase in the wave period, the wave force also increases. Accordingly, Jensen proposed a formula to describe the relationship between the horizontal and vertical wave forces with the freeboard level. However, this method relies on two coefficients and can only be used in small scopes. Bardbury(1988) studied the wave force on a crown wall under five different cross sections. They proposed the coefficients for Jensen (1984)’s formula, which achieved good results. However, it can only be applied to experimental geometry-shaped cross sections. Pedersen (1996) proposed a semi-empirical method through 373 tests, which is based on the idea of Günback and Göcke (1984). The wave run-up was adopted by van der Meer and Stam (1992)’s formula. The pressure in protected and unprotected areas was calculated. Pedersen (1996)’s method is used in coastal engineering design and adopted by the U. S. Army Corps ofEngineers (2002). Nørgaard(2013) indicated that Pedersen (1996)’s method can be applied in intermediate water, and Philips P13-OEM pressure transducers used in the method can be influenced by dynamic amplification, which overestimates the wave force. Amplification predominates only when the wave impacts the unprotected part of the crown wall. Their tests used the Drück PMP UNIK pressure transducers, which are unaffected by dynamic amplifications, and they proposed an updated formula with a wider range of applications. In Nørgaard(2013)’s work, the run-up was calculated by Kobayashi(2008)’s method, and Pedersen (1996)’s method was improved to make it suitable for deep and shallow water. Mar- tin(1999) proposed a formula to predict wave forces on a crown wall under regular waves, which is also based on the idea of Günback and Göcke (1984). The wave run-upwas calculated by Losada and Gimenez-Curto (1981)’s method. Martin(1999) also considered the effect of the uplift force. Valdecantos(2013) presented a suitable scope of Martin method. Berenguer and Baonza (2006) proposed a method to estimate wave forces on a crown wall under non-breaking waves and considered the effect of oblique waves. However, this method only considered the specified berm width. Bekker(2018) studied the effect of freeboard on the uplift force. The form of uplifting the pressure distribution changed with the freeboard. A reduction factor was introduced to Nørgaard(2013)’s method to calculate the uplift force. Molines (2016) introduced the roughness factor to represent the influence of the type of armor block and proposed wave force formulas through 163 tests. Then, Molines(2018) connected wave forces on a crown wall and the overtopping rate using a neural network. van Gent and van der Werf (2019a, b) proposed a prediction method to estimate wave forces on a crown wall for perpendicular wave attacks and reduction factors for oblique waves. In this method, the virtual wave run-up was calculated by van Gent (2001), and the roughness factor by a double layer of rock was 0.45. The solitary wave is an extremely long period wave. Aniel-Qu- iroga(2018, 2019) studied through experiments the armor stability and wave force on a crown wall when solitary wave attacks a rubble mound breakwater with a crown wall.
With the development of computational techniques, com- putational fluid dynamics (CFD) has been widely used in coastal and ocean engineering. Based on the fluid tracking method, the numerical method can be divided into the Euler method, such as finite differential method and finite volume method (FVM), and the Lagrangian method, such as smoothed particle hydrodynamics (SPH) and moving-particle semi-implicit method. Due to the complexity of the geometric structure and the violent interaction between waves and armor blocks, there are still many challenges in accurately simulating the interaction of waves and rubble mound breakwaters. Currently, two different methods are used for simulating the interaction between waves and rubble mound breakwaters. The first is to consider the armor layer as a porous medium layer. The waves seep through the porous medium. To simulate the seepage move- ment of fluid in porous materials, the porous material is considered a macroscopic continuous medium. This porous media model is used to simulate the average flow of fluid in a porous structure (Losada, 2016) and does not need to describe its internal geometry. The fluid resistance caused by porous media is represented by additional mass and linear and quadratic drag resistances (van Gent, 1995). Jensen(2014) proposed a method to determine the resistance coefficient to the porous media model. The verification results indicated that the model can accurately simulate the two-dimensional (2D) and three-dimensional (3D) fluid-structure interaction. Higuera(2014a, b) proposed an IHFOAM solver, which introduces turbulence models (andshear stress transport (SST)) into porous media and applies it to the interaction between waves and coastal structures. Jacobsen(2015, 2018) equated the armor layer as a porous medium layer and simulated waves run-up in a rubble mound breakwater. Ren(2014) introduced a porous media model into SPH and simulated waves and the permeable submerged breakwater interaction. Then, Wen(2018) extended this model to 3D. However, based on field observations and physical test phenomena, when waves travel to the breakwater, the fluid will not only seepage in the armor layer but also impact blocks, resulting in breaking and splashing. Therefore, another method is to clearly describe the geometry of blocks by simulating the interaction between the fluid and armor blocks to reflect the blocking effect of the armor layer. This method requires the mesh to be small enough to completely and accurately describe the geometric shape. Compared with the porous medium model, this method increases the amount of calculation. However, with the development of computer technology, the calculation cost is acceptable. Dentale(2013, 2014, 2018) modeled 3D rubble mound breakwaters in detail. This method is very similar to the actual engineering structure and physical model test, which uses the Reynolds-averaged Navier-Stokes (RANS) model to simulate the run-up process. Ren(2014) proposed a 2D discrete element method (DEM)-SPH model for simulating the movement of armor blocks on a rubble mound breakwater under wave actions and evaluated the hydraulic stability of the armor blocks. Altomare(2014) simulated the interaction between periodic waves and a Zeebrugge breakwater based on DualSPHysics. Antifers blocks are used as an armor layer and arranged in three regular permutations.
The objective of this work is to study the wave force on a crown wall under intermediate depth waves through physical model tests and numerical simulations. The Navier-Stokes equations for the two-phase incompressible flow, combined with the SSTturbulence model and volume of fluid for tracking the free surface, were solved. The armor blocks were modeled in detail using fine meshes to describe the flow of fluid between the armor blocks. This article is organized as follows: In Section 2, details are provided on numerical implementations for the governing equations, turbulence model, and free surface capturing method. In Section 3, the experiment arrangement is introduced. In Section 4, the validation of the numerical model is presented, and the influence of the wave condition and berm width on the wave force is analyzed. In Section 5, the applicability of Martin method under intermediate water depths is analyzed, and a new formula for estimating the wave force on the crown wall is proposed. In Section 6, the summary and conclusions are presented.
2 Numerical Model
In the present study, STAR-CCM+ was used to simulate the interaction between regular waves and rubble mound breakwaters with a crown wall. The program solves the 3D RANS equation. The application of STAR-CCM+ in ocean and coastal engineering was tested and verified by Yang(2018), Izquierdo(2019), and He(2021).
2.1 Governing Equation
The governing equation of incompressible fluid is RANSequations, which include the mass and momentum conservation equations:


whereis the mean strain rate tensor and=(Ñ+ÑT)/2.μis the turbulent viscosity, which can be calculated from the turbulence model.
2.2 Turbulence Model
In this study, the RANS turbulence model was used to simulate the interaction between waves and rubble mound breakwaters. The SST-model was adopted. This model overcomes the freestream dependence of. In this model, blending functions are applied to activate the-model in the inner region of the boundary layer and the-model in the outer and free-shear regions (Menter, 1994; Devolder, 2018). In the SST-model, the turbulent viscosityμis calculated as

whereis the turbulent time scale, and


where*=1,1=0.31,C=0.6, and*=0.09;is the distance to the wall; andis the dynamic viscosity.
The SST-model solves two transport equations to solve the turbulent kinetic energyand specific dissipation rate:


whereis the dynamic viscosity.σ=1σ1+(1−1)σ2,σ1=0.85,σ2=1,σ=1σ1+(1−1)σ2,σ1=0.5, andσ2=0.856.PandPare production terms, which depend on themodel variant.is the free-shear modification factor.is the vortex-stretching modification factor.Sandare the user-specified source terms.0and0are the ambient turbulence values that counteract the turbulence decay.

2.3 Interface Capturing
The physical model implemented in the CFD program is based on a two-phase Eulerian VOF unsteady model, taking into account gravity and surface tension. In the multiphase Eulerian VOF model, the air and water phases are solved in the whole computational domain, and the macroscopic regions filled with each fluid are defined (Hirt and Nichols, 1981). The position of the interface between phases is calculated by means of the evolution of the volume fraction property that defines the amount of each phase present in computational cells. The VOF model description assumes that all immiscible fluid phases present in a control volume share velocity, pressure, and temperature fields. The general equations of the VOF model are described below. The physical properties of the fluid are obtained from the constituent phases and volume fractions as


whereis the value of the volume fraction of each cell. When=1, the cell is water, and when=0, the cell is air.andare the density and dynamic viscosity of each cell, respectively, which are calculated by the density and dynamic viscosity of the water and air phases in each cell.
2.4 Boundary Condition
A no-slip wall condition was set on the solid boundary by forcing the velocity near the solid surface to satisfy the logarithmic law of the wall. Second-order Stokes wave theory was adopted to generate the designed waves, which is realized by imposing free surface elevation and velocity components at the inlet boundary:


whereis the free surface elevation;andare the horizontal and vertical velocity components, respectively;is the wave height;is the wave number; andis the angular frequency.
3 Experimental Tests
In coastal engineering, small-scale tests are important to analyze the interaction between waves and structureand to create or validate empirical/numerical models. Rubble mound breakwaters with a crown wall are typically used for protecting access roads against excess overtopping discharges. Fig.1 shows a typical rubble mound breakwater section with a crown wall.is the water depth,is the crest wall freeboard,is the distance between the crest level of the armor layer crest and SWL,is the crest width of the armor layer,is the width of the crest wall,wis the distance of the crest level of the filter layer and SWL,portis the distance of the crest level of the filter level and the crest level of the armor layer, andfis the distance of the crest level of the armor layer and the top of the crown wall.
Physical tests were performed in a 68m long, 1.0m wide, and 1.5m high at Tianjin Research Institute for Water Transport Engineering, Port Hydraulic Engineering Technology, as shown in Fig.2. The wave-making piston was set at the left side of the flume, which can generate regular and irregular waves.
In the physical model test, accropode blocks were used as the armor layer. The distance between the wave piston and toe is 38m. The thickness of the armor layer is 5cm. The slopeis 1:1.5.is 5.0, 10.0, and 15.0cm. The distance between the toe and the bottom of the crown wall is 46.7cm. The vertical distance between the berm and toe is 51.7cm. The height and width of the crown wall are both 25.0cm. The wave condition is shown in Table 1.

Fig.1 Cross section of a rubble mound breakwater with a partly unprotected vertical face.

Fig.2 Physical model test.

Table 1 Wave condition of the physical model
To measure the wave force on the crown wall, two pressure sections were arranged on the crown wall, and each pressure section was placed 33cm away from the flume wall. Each pressure section had six pressure sensors, and the layout is shown in Fig.3. The acquisition frequency of the pressure sensors was 100Hz. Each scenario was only run 20 wave cycles after the start of the wavemaker to guarantee that the measurements were not affected by the secondary wave reflection from the wavemaker. Then, the method of wave force is calculated by

wherepandprepresent the left and right pressure sections, respectively.
Fig.3 Layout of the pressure sensors.
4 Numerical Simulation
4.1 Numerical Model Establishment
A 3D model was built with a computational domain (24m×0.32m×1m), containing the water and air phases. The FVM was used to discretize the governing equations. A segregated scheme was used to solve the governing equations, where the momentum conservation equation was solved separately from the continuity conservation equation. The solutions were modified by the pressure correction equation and the equation for the volume fraction. An adopted time step controlled by the courant-Friedrichs-Lewy condition was used to ensure the adequate time step through the simulation process. A total of 50 inner interactions within each time step were performed. A second temporal discretization was used to improve accuracy.
4.2 Wave-Making Tests
The sensitivity to the mesh refinement of the present model and the selection of the turbulence model is investigated in this section. According to Eça and Hoekstra (2014), the following conditions should be satisfied in the convergence analysis: i) three meshes must be asymptotic to guarantee that the leading term of the power series expansion can sufficiently estimate the error; ii) the grid refinement ratio should be constant for different grids. Based on the experiment, which will be further discussed, six wave conditions were selected and reproduced in the present simulation. In the wave conditions,=0.467m,=0.1m, and=2.5560s were selected for verification. Fig.4 shows a sketch of a 3D numerical wave flume (NWF) used for the verification. The length of the NWF is 28m, the width is 0.32m, and the height is 1.0m. Three wave gauges were arranged, as shown in Fig.4. Three meshes, labeled I, II, and III, share the same background mesh and are refined asymptotically in the vicinity of the free surface from=0.4m to=0.6m. The basic parameters of the three meshes are listed in Table 2. The initial time step was set to 0.0001s, and it was adjusted automatically according to the maximum courant number, which was set to 0.5 in the present simulation.

Fig.4 Diagram of the wave-making test.

Table 2 Mesh parameters of the three meshes
The time histories of the surface elevations at WG1-WG3 are shown in Fig.5. The vertical and horizontal axes represent the non-dimensional surface elevation and non-dimensional time, respectively. As shown in the figure, the free surface elevations of different meshes are almost coincident at each specific measure position, which meansthat a convergent result is obtained. To mesh the armor blocks, Mesh II was adopted to the following numerical simulation.

Fig.5 Non-dimensional time histories of the surface elevation at x=12, 14, and 16m.
4.3 Validation of the CFD Model
A typical test scenario (=0.1m,=2.5560s, and=0.467m) in the laboratory experiments was selected for the model validation purpose. The 3D CAD software was used to finely model the armor blocks. To take into account the computing cost and grid of the armor blocks, Mesh II was used. Fig.6 presents the model of the rubble mound breakwater with a crown wall. The right side of Fig.6 is the mesh grids of the breakwater. Based on the grid quality inspection, the qualified grid accounted for 99.8%. Fig.7 shows the free surface and velocity at the free surface of the interaction between waves and breakwater interaction when=0.467m,=0.1m,=2.5560s, and=0.05m. When the wave propagated to the front of the breakwater, the water elevation gradually increased, and the wave was not broken (=14.90–15.39s). As the wave ran up to the berm, the velocity of water in front of the crown wall gradually increased (=15.49–15.60s). Then, the wave continued to climb along the crown wall to the highest (=15.81s). Under the action of gravity, the velocity of the water body gradually decreased. When the water body fell, the reflected wave was generated and propagated backward. The wave speed of the reflected wave was relatively high (=16.00–16.37s). As the water level in front of the breakwater gradually dropped, the water gradually fell under the blocking action of the armor layer (=16.56–16.76s).

Fig.6 Model of the rubble mound breakwater with a crown wall and its mesh diagram.
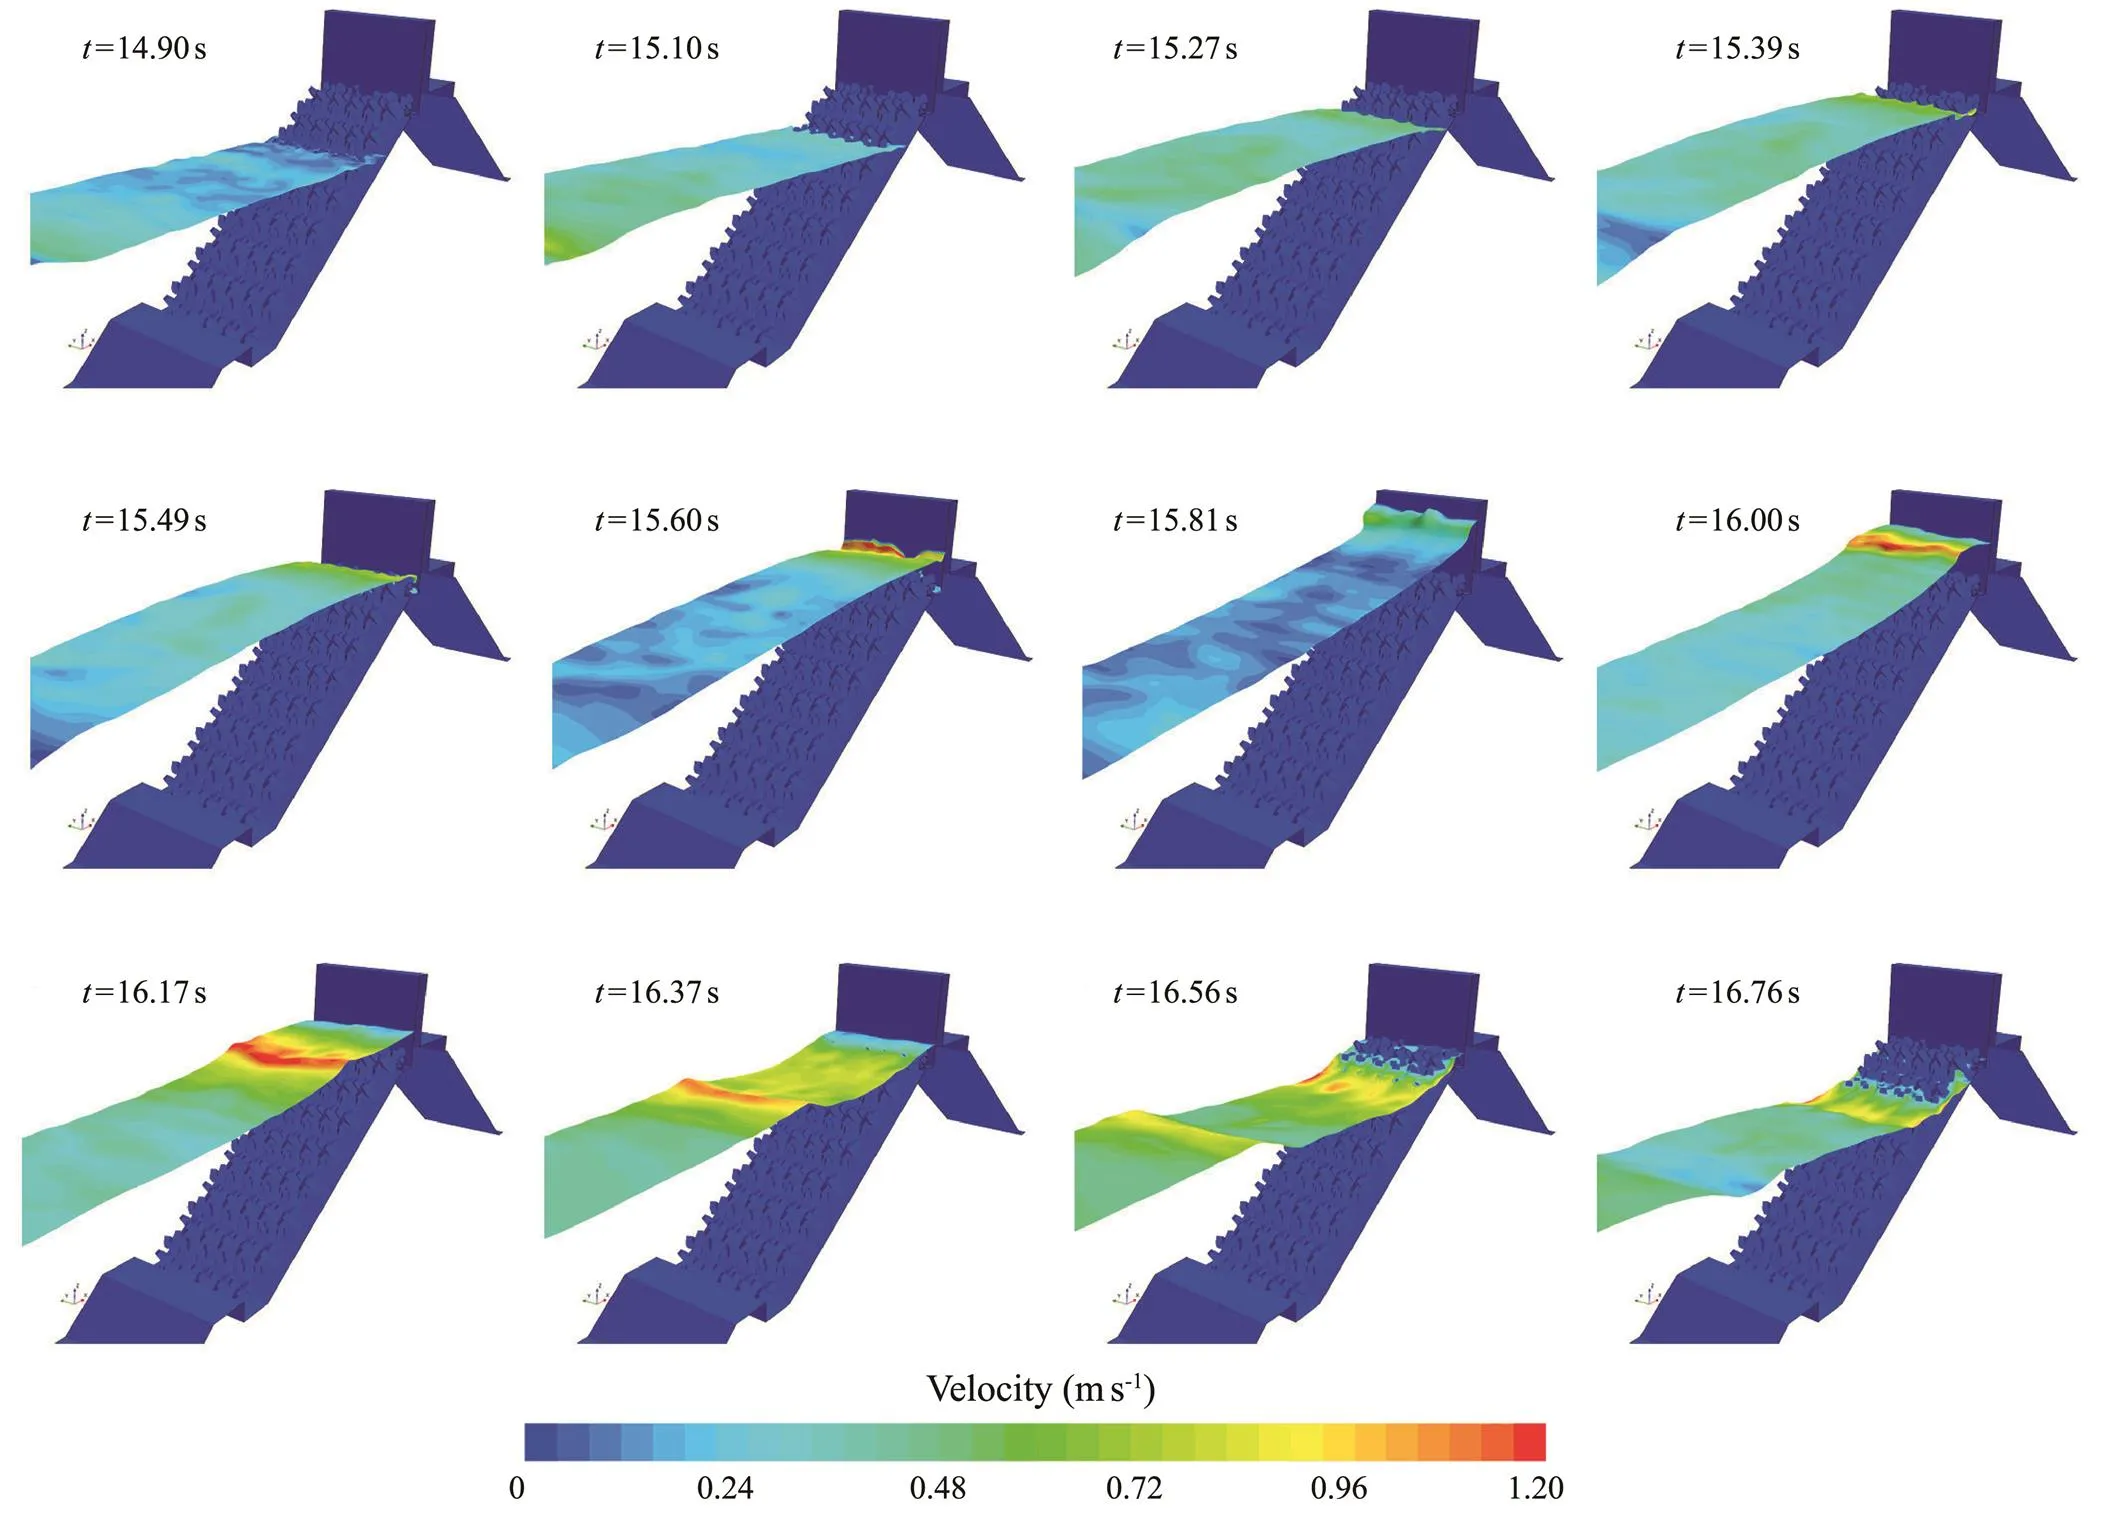
Fig.7 Interaction between waves and the rubble mound breakwater with a crown wall.
Fig.8 presents the comparison between the numerical calculation results and the experimental results of each measurement point under the wave condition of=14m,=3m, and=14s. The experimental results are in good agreement with the numerical results, which indicated that the numerical model can better simulate the interaction between waves and the rubble mound breakwater with a crown wall. Under berm widths of=1.5 and 3m, the pressure of the bottom of the crown wall was large, and the pressure of the top was small. Based on the pressure time history, there is no obvious impact pressure during the interaction between the waves and the crown wall. Comparing the pressure at the same position under different berm widths, such as P1, the maximum pressure of=3m is slightly larger than that of=1.5m. Hence, as the berm width increases, the pressure on the crown wall does not decrease accordingly.
Fig.9 presents the comparison of the tests and numerical simulation pressure distribution under different wave periods. Under=1.5m, the test results were basically consistent with the numerical results. Under=3m, for a shorter period (=6 and 8s), the test result of P2 was greater than the numerical result. Under a shorter wave period, the waves broke on the slope and berm. Due to wave breaking, waves attacked the crown wall in a state of water vapor mixing. Due to the compressibility of air, bubble breakage may cause great pressure in experiments. For a longer period (=10–18s), the test results were in good agreement with the numerical results. In general, the numerical calculation results are basically consistent with the experimental results. In Fig.9, the pressure distribution on the crown wall is triangular, similar to the shape produced by the hydrostatic pressure. Because the waves did not break in front of the crown wall, when the waves reached the berm and continued to climb up to the highest point along the crown wall, the water at this time exerted pressure on the crown wall under the action of gravity. Therefore, the shape of the pressure distribution was triangular.
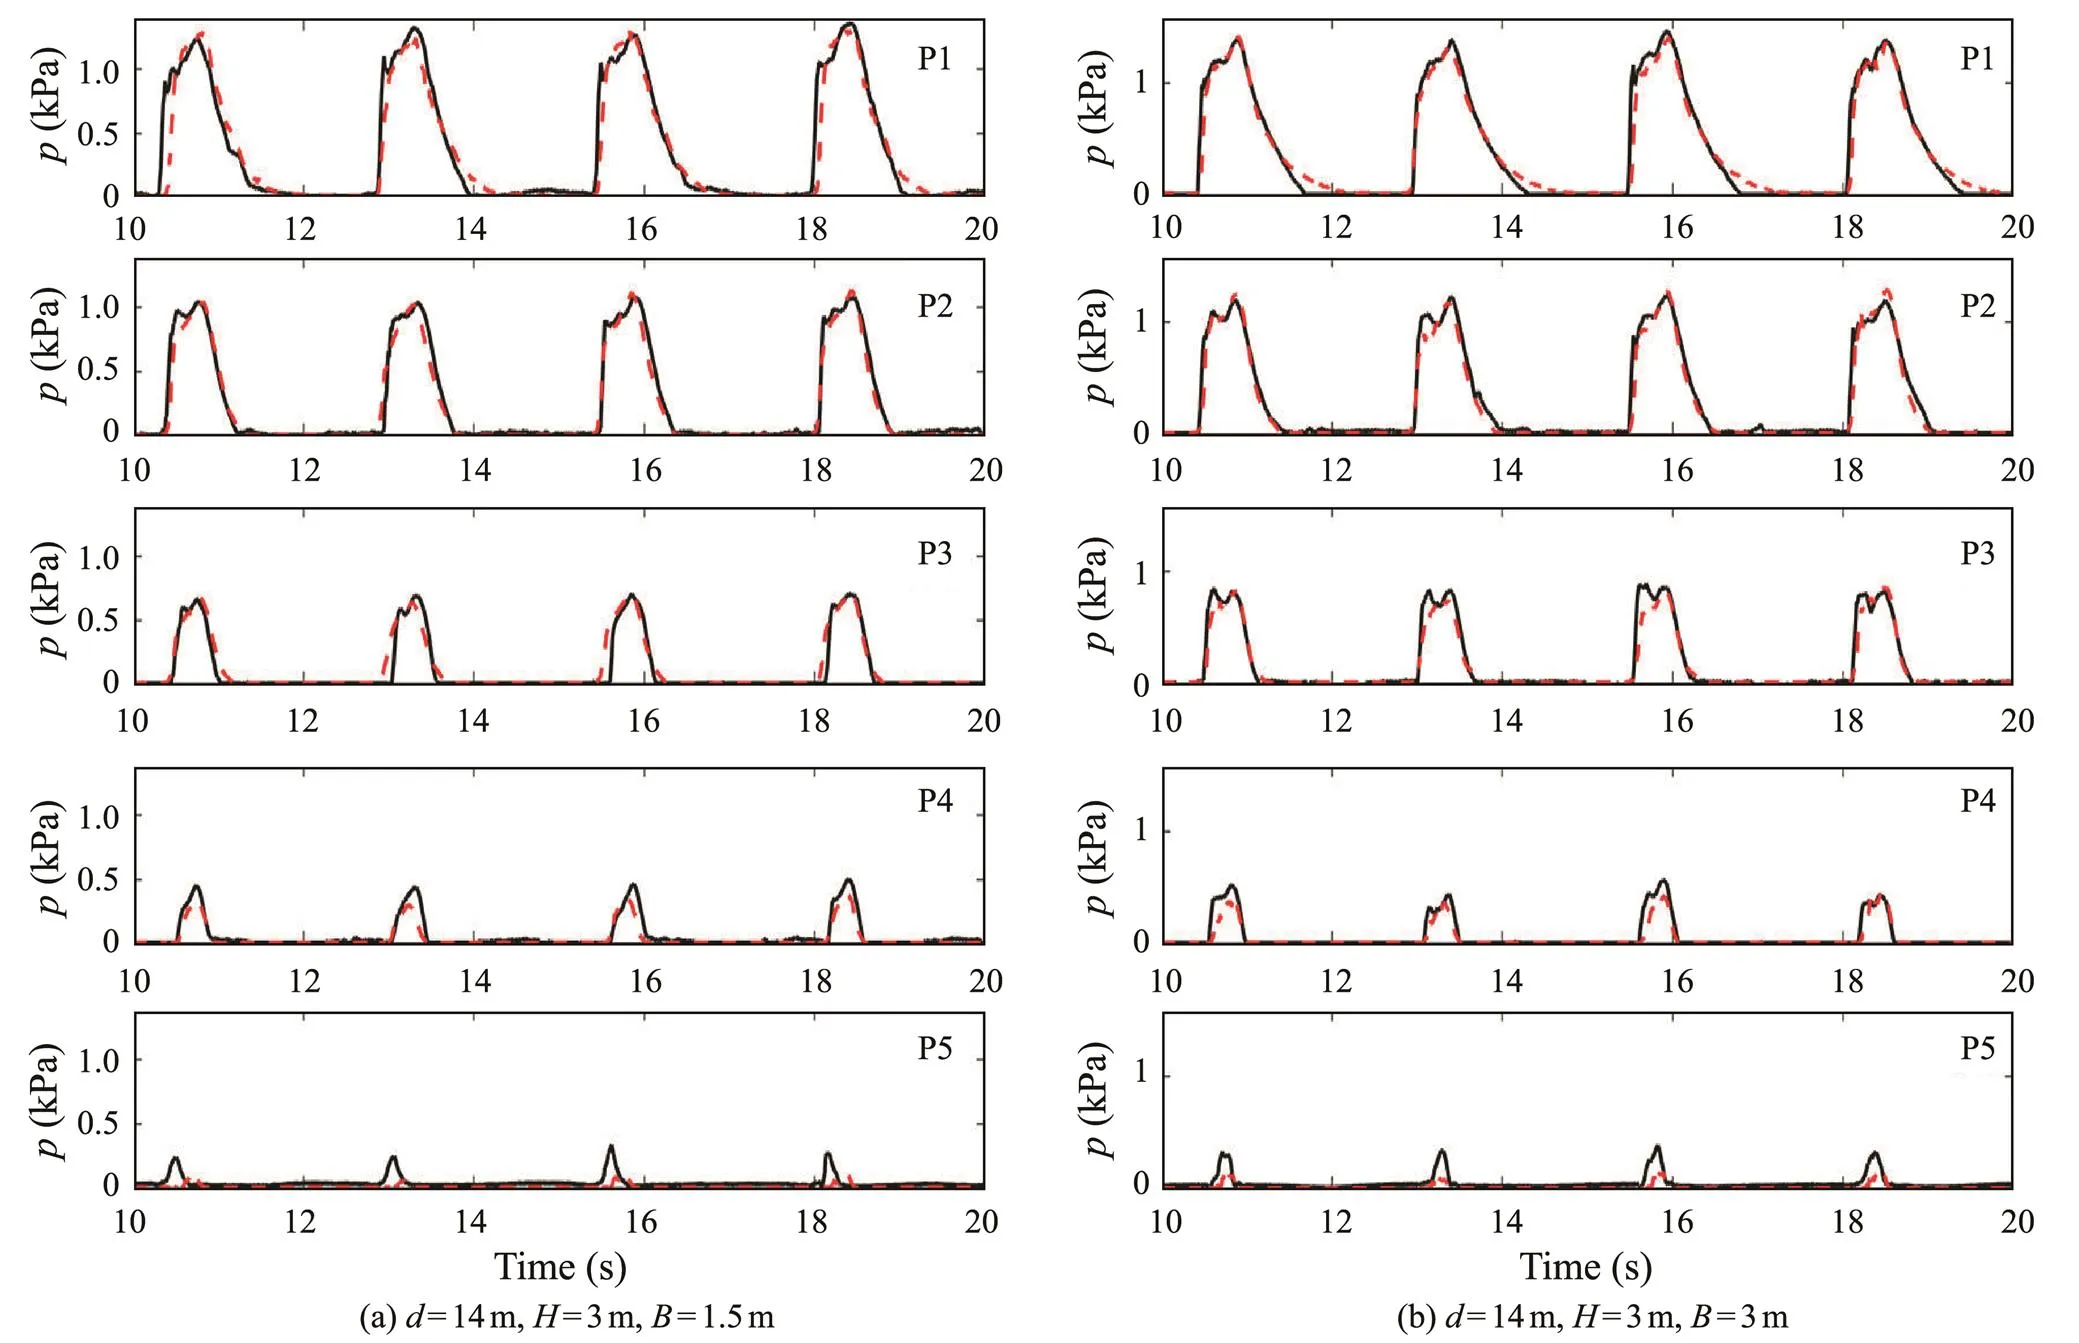
Fig.8 Comparison of the experimental results and numerical pressure time history. Black solid line, experiments; red dotted line, simulations.

Fig.9 Comparison of the experimental and numerical pressure distribution (d=14m, H=3m).
Fig.10 presents the variation of the wave force with the wave period under different wave heights, water depths, and berm widths. The wave force as a whole increased with the increase in the wave period. When=12m, in the shorter period (=6–14s), the wave force gradually increased as the period increased. In the longer period, when=16s increased to 18s, the wave force decreased. As the period increased, the maximum wave force was approximately 2–4 times that of the short-period wave force. When=14m, in the shorter period conditions, the wave forces increased with the increase in the wave period. In the longer period conditions, the wave force increased or slightly decreased with the increase in the wave period. As shown in Fig.10, as the berm width increased, the wave force did not show a decreasing trend. When=3m, the wave force on the crown wall was the largest. When=4.5m, the force in the long period was obviously suppressed.

Fig.10 Variations of the wave force with the wave period.
5 Comparison of the Experimental Results and the Method of Martin et al. (1999)
The formulas proposed by Martin(1999) are based on model tests performed in a 2-m-wide, 2-m-high, and 70-m-long wave flume at the Ocean and Coastal Engineering Laboratory at the University of Cantabria. The test cross section was a model of the Spanish Príncipe de Asturias breakwater in Port of Gijón (Fig.3 in Martin, 1999). The scale was 1:90, and the wave conditions were regular waves. The range of the wave steepness in the tests was 0.03

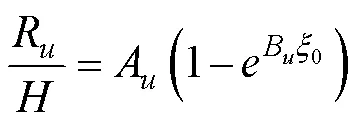
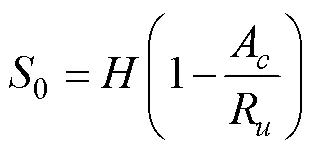


whereAandBin Eq. (17) are decided by the porosity of the armor layer. For some armor units (, cubic block, quadrapod, and tetrapod), Martin(1999) provided the reference values ofAandB. As shown in Fig.6 in Martin(1999),A=0.8969 andB=−0.7562 were adopted.,, andin Eq. (18) depend on the armor unit number (/) on the berm, as shown in Table 3.

Fig.11 Calculation diagram of Martin et al. (1999) and vertical distribution on the crown wall.

Table 3 Values of a, b, and c in Eq. (18)
The uplifting wave force is also divided into two parts: dynamic pressure and reflecting wave force. The dynamic and reflecting pressures are the first and second terms on the right side of Eqs. (19) and (20), respectively.p,is related to the porosity of the filtering layer and F/L (Martin, 1999). In this physical test, the porosity of the filtering layer was 0.3.
Fig.12 shows the comparison of the experimental results and the results calculated by Martin method. Martin method is not suitable for the test conditions. The analysis results of Martin calculation process show that the main reason for the inapplicability is the Losada run-up formula.Rcalculated by Eq. (17) was also underestimated. The application of Martin method requires waves breaking on the armor layer, such that only broken waves will reach the crown wall. In these tests, when=14m, the still water level was consistent with the bottom of the crown wall. When=12m,Awas 2m, which is smaller than the wave height. Therefore, the wave was not broken before the crown wall. Martin method is based on the cross section of Spanish Príncipe de Asturias breakwater in Port of Gijón, whose armor block is a parallel block. In this study, the armor block is an accropode block. Based on the experimental results, the parameters of the structure and wave condition were considered to establish a new formula to estimate the wave force on the crown:

Fig.12 Comparison of the experimental results and the results of Martin method.


where

In these tests, the wave conditions were intermediate depth waves, as shown in Fig.13. The wave length was cal- culated by the dispersion relation. The comparison of the experimental results and the wave force calculated by Eq. (25), as shown in Fig.14, shows a good agreement. The ranges of the validity of Eq. (25) are as follows:

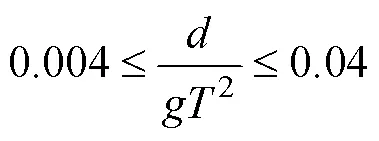
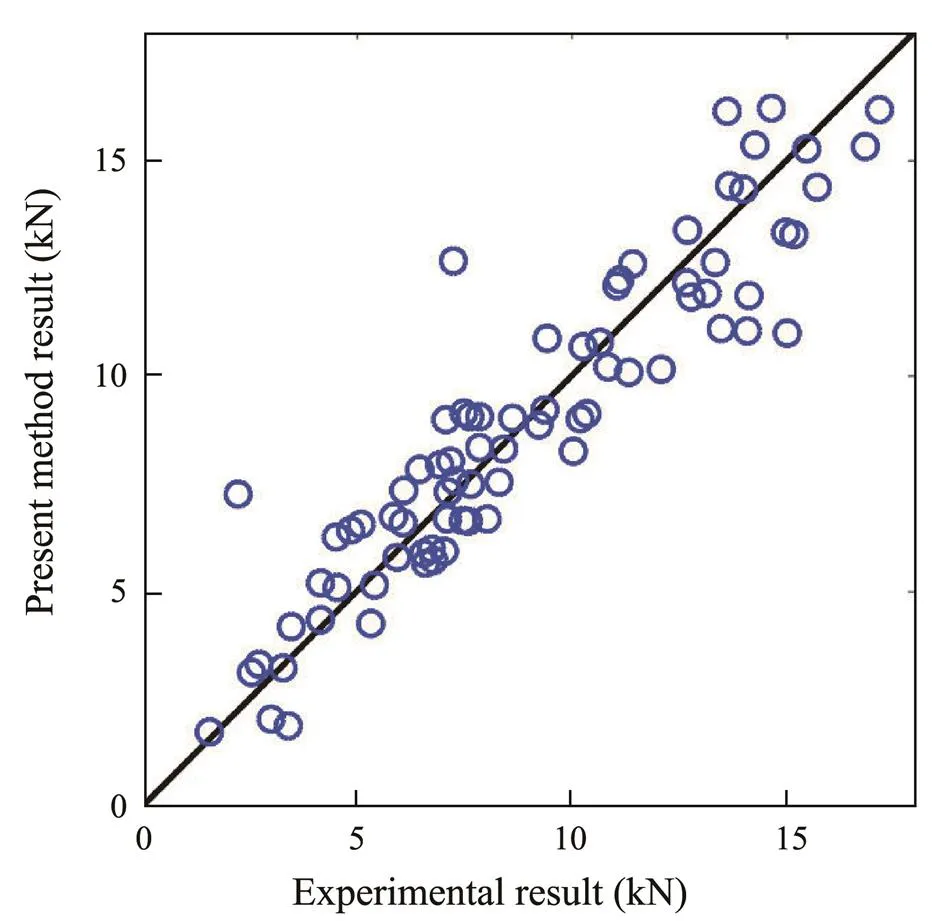
Fig.14 Comparison of the experimental results and proposed formula.
6 Conclusions
In this study, through physical model tests and numerical simulations, the influence of wave period on the wave force of a crown wall was examined. During the tests, the influence of the wave period on the wave force was analyzed under different wave heights, water depths, and berm widths. By comparing the experimental results with those of Martin method, the feasibility of Martin method on the scope of the experiments was tested. A new calculation for- mula is proposed to estimate the wave force on the crown wall. The following conclusions are drawn in this paper:
1) Through the SSTmodel, armor blocks were mod- eled in detail. The pressure distribution on the crown wall under different wave periods was calculated and compared with the test results. The results are in good agreement, which proves that the numerical model can effectively sim- ulate the interaction between waves and rubble mound breakwaters with a crown wall.
2) Based on the numerical calculation results and experimental results, with the increase in the wave period, the wave force shows an overall increasing trend. The increasing rate gradually decreases with the increase in the wave period. When the wave period increases from 16s to 18s, the wave force will decrease. The comparison of wave forces in different berm widths shows that the wave force does not gradually decrease as the berm width increases.
3) Compared with the test results of this study, Martin method cannot be applied to the range of the test conditions. The reason is that the wave force calculated by Martin method involved waves broken before reaching the crown wall. Therefore, based on the experimental results, a new wave force formula is proposed. Based on a comparison with the test results, this formula can effectively estimate the wave force on the crown wall.
Acknowledgements
The study was supported by the National Natural Science Foundation of China–Shandong Joint Fund (No. U1706226), and the National Natural Science Foundation of China (No. 52171284).
Altomare, C., Crespo, A. J. C., and Rogers, B. D., 2014. Numerical modelling of armour block sea breakwater with smoothed particle hydrodynamics., 130: 34-45.
Aniel-Quiroga, I., Vidal, C., Lara, J. L., González, M., and Sainz, A., 2018. Stability of rubble-mound breakwater under tsunami first impact and overflow based on laboratory., 135: 29-54.
Aniel-Quiroga, I., Vidal, C., Lara, J. L., González, M., and Sainz, A., 2019. Pressures on a rubble-mound breakwater crown-wall for tsunami impact., 152: 103522.
Bardbury, A. P., Allsop, N. W. H., and Stephens, R. V., 1988.. Report No. SR 146. HR Wallingford.
Bekker, J., Hofland, B., and Smith, G., 2018. Experiments of the effect of freeboard on the stability of a breakwater crown wall.. Baltimore, MD, USA, 92-105.
Berenguer, J. M., and Baonza, A., 2006. Rubble mound breakwater crown wall design.. Algeciras, Spain, 19-26 (in Spanish).
Camus, P. B., and Flores, G. J., 2004. Wave forces on crown walls: Evaluation of existing empirical formulations., 4: 4087-4099.
Dentale, F., Donnarumma, G., and Carratelli, P. E., 2013. Simulation of flow within armour blocks in a breakwater., 295 (3): 528-536.
Dentale, F., Donnarumma, G., and Carratelli, P. E., 2014. Numerical wave interaction with tetrapods breakwater., 6: 800-812.
Dentale, F., Reale, F., Leo, A. D., and Carratelli, P. E., 2018. A CFD approach to rubble mound breakwater design., 5 (10): 644-650.
Devolder, B., Troch, P., and Rauwoens, P., 2018. Performance of a buoyance-modifiedandSST turbulence model for simulating wave breaking under regular waves using OpenFOAM., 138: 49-65.
Eça, L., and Hoekstra, M., 2014. A procedure for the estimation of the numerical uncertainty of CFD calculations based on grid refinement studies., 262: 104-130.
Günback, A. R., and Göcke, T., 1984. Wave screen stability of rubble mound breakwaters.. Athens, Greece, 2999-2112.
He, G., Jing, P., Jin, R., Zhang, W., Zhang, J., and Liu, T., 2021. Two-dimensional numerical study on fluid resonance in the narrow gap between rigid-connected heave boxes in waves., 110: 102628.
Higuera, P., Lara, J. L., and Losada, I. J., 2014a. Three-dimen- sional interaction of waves and porous coastal structures using OpenFOAM. Part I: Formulation and validation., 83: 243-258.
Higuera, P., Lara, J. L., and Losada, I. J., 2014b. Three-dimen- sional interaction of waves and porous coastal structures using OpenFOAM. Part II: Application., 83: 259-270.
Hirt, C. W., and Nichols, B. D., 1981. Volume of fluid (VOF) method for the dynamics of free boundaries., 39: 201-225.
Iribarren, R., and Nogales, C., 1954.. Editorial Dossat Madrid, Madrid, Spain, 139-148.
Izquierdo, U., Esteban, G. A., Blanco, J. M., Albaina, I., and Peña,A., 2019. Experimental validation of a CFD model using a nar- row wave flume., 86: 1-12.
Jacobsen, N. G., van Gent, M. R. A., and Wolters, G., 2015. Numerical analysis of the interaction of irregular waves with two dimensional permeable coastal structures., 102: 13-29.
Jacobsen, N. G., van Gent, M. R. A., Capel, A., and Borsboom, M., 2018. Numerical prediction of integrated wave loads on crest walls on top of rubble mound structures., 142: 110-124.
Jensen, B., Jacobsen, N. G., and Christensen, E. D., 2014. Investigations on porous media equations and resistance coefficients for coastal structures., 84: 56-72.
Jensen, O. J., 1984.Danish Hydraulic Institute, Hørsholm, Denmark, 117-139.
Kobayashi, N., de los Santos, F. J., and Kearney, P. G., 2008. Time-averaged probabilistic model for irregular wave runup on permeable slopes., 134 (2): 88-96.
Losada, I. J., Lara, J. L., and del Jesus, M., 2016. Modelling the interaction of water waves with porous coastal structures., 6 (142):03116003-1-18.
Losada, M. A., and Gimenez-Curto, L. A., 1981. Flow characteristics on rough, permeable slopes under wave action., 4: 187-206.
Martin, F. L., Losada, M. A., and Medina, R., 1999. Wave loads on rubble mound breakwater crown walls., 37 (2): 149-174.
Menter, F. R., 1994. Two-equation eddy-viscosity turbulence mod-eling for engineering applications., 32 (8): 1598-1605.
Molines, J., 2016. Wave overtopping and crown walls stability of cube and cubipod-armoured mound breakwater. PhD thesis. Universitat Politècnica de València, Spain.
Molines, J., Herrera, M. P., and Medina, J. R., 2018. Estimations of wave forces on crown walls based on overtopping rates., 132: 50-62.
Nørgaard, J. Q. H., Andersen, T. L., and Burcharth, H. F., 2013. Wave loads on rubble mound breakwater crown walls in deep and shallow water wave conditions., 80: 137-147.
Pedersen, J., 1996. Wave forces and overtopping on crown walls of rubble mound breakwaters. PhD thesis. Aalborg University, Denmark.
Ren, B., Jin, Z., Gao, R., Wang, Y., and Xu, Z., 2014. SPH-DEM modeling of the hydraulic stability of 2D blocks on a slope., 140 (6): 0401022.
Ren, B., Wen, H., Dong, P., and Wang, Y., 2014. Numerical simulation of wave interaction with porous structures using an improved smoothed particle hydrodynamic method.,88: 88-100.
U. S. Army Corps of Engineers, 2002.. U. S. Army Corps of Engineers, Washington, D. C., VI-5-178-VI-5-181.
Valdecantos, V. N., López Gutiérrez, J. S., and Polvorinos Flors, J. I., 2013. Comparative study of breakwater crown wall–Calculation methods., 166 (MA1): 25-41.
van der Meer, J. W., and Stam, C. J. M., 1992. Wave runup on smooth and rock slopes of coastal structures., 118 (5): 534-550.
van Gent, M. R. A., 1995. Porous flow through rubble mound material., 3 (176): 176-181.
van Gent, M. R. A., 2001. Wave run-up on dikes with shallow foreshores.,127 (5): 254-262.
van Gent, M. R. A., and van der Werf, I. M., 2019a. Influence of oblique wave attack on wave overtopping and forces on rubble mound breakwater crest walls., 151: 78-96.
van Gent, M. R. A., and van der Werf, I. M., 2019b. Prediction method for wave overtopping and wave forces on rubble mound breakwater crest walls.. Hannover, DOI: 10.18451/978-3-939230-64-9_003.
Wen, H., Ren, B., and Wang, G., 2018. 3D SPH porous flow model for wave interaction with permeable structures., 75: 223-233.
Yang, F., Shi, W., Zhou, X., Guo, B., and Wang, D., 2018. Numerical investigation of a wave glider in head seas.,164: 127-138.
(April 18, 2021; revised August 9, 2021; accepted October 8, 2021)
© Ocean University of China, Science Press and Springer-Verlag GmbH Germany 2023
Corresponding author. E-mail: dongsh@ouc.edu.cn
(Edited by Xie Jun)
杂志排行
Journal of Ocean University of China的其它文章
- The Subduction Structure Beneath the New Britain Island Arc and the Adjacent Region from Double-Difference Tomography
- Differences of Polygonal Faults with Irregularly Polygonal Geometries: A Case Study from the Changchang Sag of Qiongdongnan Basin, Northern South China Sea
- Characterization of Bacterial Communities in Aerosols over Northern Chinese Marginal Seas and the Northwestern Pacific Ocean in Autumn
- Assessment and Application of Beach Quality Based on Analytic Hierarchy Process in Yangkou Beach, Qingdao
- Role of Resuspended Sediments as Sources of Dissolved Inorganic Phosphorus Along Different Dimensions in the Subei Shoal, South Yellow Sea, China
- Pharmacokinetics of Enrofloxacin and Its Metabolite in Carp (Cyprinus carpio) After a Single Oral Administration in Medicated Feed
