Predicting the Fuel Consumption of a Ship in Seaway Considering the Dynamic Interaction Among Environment-Hull-Propeller-Engine
2023-03-01ShukuiLiuKahHooiGeraldBehandApostolosPapanikolaou
Shukui Liu, Kah Hooi (Gerald) Beh and Apostolos Papanikolaou
Abstract The fuel consumption of a ship has always been an important research topic, but nowadays its importance has even increased as it is directly related to a ship’s greenhouse gas (GHG) emissions, which is now tightly regulated.In this paper, such a dynamic model is presented.The ship’s resistance in calm water and propeller’s performance in open water are required as input.The hull efficiency is estimated empirically.The diesel engine is modelled by a first-order transfer function with a delayed response and its performance is calibrated with the data from the manufacturer’s catalogue.A governor is applied to maintain the pre-set engine’s rotational speed and to control the engine fuel rate.A slope limiter is employed to approximate the actual engine operation during engine transients.The default values can be obtained from the manufacturer engine load acceptance diagram.The developed model is implemented in MATLAB SIMULINK environment.After validation against third-party published results, the influence of using different types of governors on ship speed and fuel consumption is investigated.The model is also applied to simulate the fuel consumption of a ship during a typical acceleration manoeuvre and the scenario of a real ship encountering harsh weather conditions.
Keywords Environment-hull-propeller-engine interaction; Fuel consumption in seaway; PI governor; Ship acceleration in harsh seaway; Marine diesel engine
1 Introduction
The fuel consumption of a ship has always been an im‐portant research topic, but nowadays its importance has even increased as it is directly related to a ship’s green‐house gas (GHG) emissions, which is now tightly regulat‐ed by IMO in its ambitious strategy fighting against cli‐mate change.A lot of studies are now being carried out on the maritime GHG emission issues (Flagiello et al.,2021;Nahim et al., 2015; Karabulut et al., 2020; Mocerino et al.,2021; Sherbaz and Duan, 2012).
In various engineering tasks, the fuel consumption is of‐ten predicted by staticmodels for specific operating point(s).This is very simplified and it essentially assumes an idealized steady-state condition of all the involved compo‐nents, including resistance, propeller, shaft and engine,etc.Such a modelling is simple to implement but unrealis‐tic as a ship is experiencing time-varying environmental forces and from time to time it has to conduct manoeuvres,such as acceleration/deceleration.Assuming that the sea‐way environment is a random process and it influences both the resistance exerted on hull and the propulsive per‐formance of the propeller, it naturally leads to a time-vary‐ing ship speed, if the engine is operating in the constant power mode, controlled by a governor.The experienced dynamic effects lead to an increased fuel consumption compared with the steady conditions.Thus, dynamic mod‐els are needed to capture the fuel consumption of a ship in realistic environmental conditions (Kim et al., 2021).
Several studies have been conducted to investigate the dynamic effect among the hull, propeller and diesel en‐gine.Schulten (2005) developed a system integrating multi-disciplinary sub-systems of diesel engine, ship and propeller, to examine the manouevering of a ship in calm water, to gain knowledge of the propulsion process to sup‐port the design of ship propulsion system.Bondarenko and Kashiwagi (2010) investigated the dynamic behavior of diesel engine and speed control system at off-design and transient conditions in actual seas with a view of improv‐ing the engine speed control schemes to ensure the safe op‐eration of ship propulsion plants.They concluded that a conventional proportional-integral (PI) governor cannot ef‐fectively control the ship propulsion plant in cases of large and abrupt propeller torque losses.Taskar et al.(2016)studied the effect of waves on engine-propeller dynamics and propulsion performance of ships using a coupled mod‐el of engine and propeller along with a method to estimate wake in waves for accurate estimation of ship perfor‐mance.Mizythras et al.(2018) studied a ship’s propulsion system’s transient response during acceleration in harsh conditions using a Propulsion System Performance Simu‐lation tool with low computational cost.A slope limiter was implemented on the diesel engine to represent the ac‐tual acceleration of the engine.Zeraatgar and Ghaemi(2019) presented a model to simulate the hull-propeller-en‐gine interactions and analysed the effects of applying the P or PI controllers, with the objective of achieving a lower fuel consumption.The conclusion was that it would be possible for the ship to conserve a considerable amount of fuel at the cost of a slightly longer duration of voyage.Til‐lig and Ringsberg (2019) presented a model for the predic‐tion of the fuel consumption of ships at sea with the mo‐tions solved in four degrees-of-freedom.To capture invol‐untary speed losses, engine limits are included in the mod‐el.The model was applied to study the fuel performance of alternative routes in the Baltic Sea with realistic weath‐er forecasts.The weather routing system, as discussed in various studies, for instance, by Vettor and Soares (2016),is believed to be able to play a significant role in the future maritime transportation sector, where alternative fuels and innovative propulsion means of higher operational cost are gradually phasing in.
In this paper, a dynamic model for the simulation of a ship’s fuel consumption is presented.In this model, the ship’s resistance in calm water and propeller’s perfor‐mance in open water are required as input.The diesel en‐gine is modelled by a first-order transfer function with a delayed response and its performance is calibrated with the data from the manufacturer’s catalogue (Zeraatgar and Ghaemi, 2019).A governor is applied to maintain the preset engine’s rotational speed and to control the engine fuel rate (Bendarenko & Kashiwagi, 2010).A slope limiter is em‐ployed to approximate the actual engine operation during en‐gine transients (Mizythras et al., 2018).The developed mod‐el, which is implemented in MATLAB SIMULINK envi‐ronment, is similar to that presented by Zeraatgar and Ghaemi (2019) except the implemented slope limiter.Af‐ter validation against the results of Zeraatgar and Ghaemi(2019) using the same case study, the tuned model is ap‐plied to simulate the fuel consumption of a ship during a typical acceleration manoeuvre and the speed/power per‐formance of a real ship in adverse conditions.The influ‐ence of using different types of governors together with a slope limiter on ship speed and fuel consumption is investi‐gated.This work is developed with the view of supporting the development of an advanced weather routing system(Papatzanakis et al., 2012).
2 Formulation
2.1 Ship resistance
In this study, we consider a new ship moving in calm water following a straight line.The total resistanceRTin calm water is supplied as input to the current problem.
Generally speaking, the total resistance (longitudinal force against ship’s advance) experienced by the ship at a specific steady speedVin operational condition can be de‐scribed using the following equation:
whereRTotalis the total resistance acting on a ship in sea‐way,RTthe total resistance of a new ship in calm water,Rflthe resistance due to fouling development on hull sur‐face,RAAthe mean added resistance due to relative wind,RˉAWthe mean added resistance due to waves,Rrudthe resis‐tance due to rudder action,Rdriftthe hull drifting forces in the steady condition,Ryawthe added resistance due to yaw motion, etc.
2.2 Propeller characteristics
The propeller open-water performance is typically pro‐vided in the form ofKT−KQ−Jcurves, which are supplied as input to the current problem.
When a ship is navigating at speedV, the advance veloc‐ityuAcan be calculated as:

whereTis the produced thrust,QPis the propeller torque,npis the number of propeller shaft revolutions per unit time andDpis the propeller diameter.
The wake fraction and thrust deduction fraction re‐quired in the simulation can be supplied based on experi‐mental or numerical results.If no data is provided, they can be estimated using the following empirical expres‐sions (Molland et al., 2011):
Finding the thrust produced by the propeller, the net thrust can be derived by factoring in the thrust reduction factor as follows:
It should be noted that during ship operation, both the ship speedVand the propeller speed may change with time, therefore resulting in an instantaneous change in the advance coefficientJA.Furthermore, the values of the wake fractionwand the thrust reduction fractiontwill al‐so change with ship operation.
2.3 Diesel engine
The diesel engine’s torque as a function of fuel con‐sumption is modelled as a 1storder transfer function with time delay (Xiros, 2002; Zeraatgar & Ghaemi, 2019),which takes the form as follows:
wherehis the fuel input to the engine,τis the time delay of the system,KEis the gain of the engine, andTEis the time constant.The engine torqueQE(s) is the output of the system.These can be calculated using the equations shown below:
whereZEis the number of engine cylinders,ωEandnEare the angular velocity in rad/s and rate of engine shaft revo‐lutions in rev/s, respectively, andnE0is the engine shaft revolutions at Normal Continuous Rating (NCR).The Spe‐cific Fuel Oil Consumption (SFOC) curve of the engine is required to calculate the fuel rateh.The fuel rate is mod‐elled based on the SFOC curve and the dynamic behaviour of this equipment is not taken into account.
2.4 General equations relating hull, propeller and engine
For a ship advancing on a straight line at speedV, the re‐sistance exerting on the hull is denoted asRTotaland the propulsor provides a net thrustTNto overcoming the resis‐tance.When the net thrustTNis larger than the total resis‐tanceRTotalof the ship, the ship will accelerate and this mo‐tion can be described following Newton’s Second Law:
where ∆ is the displacement of the ship anda11is the add‐ed mass in the longitudinal direction.The ship’s added mass is a function of the ship’s geometry and it can be esti‐mated numerically by using a potential theory seakeeping 3D panel code (Liu & Papanikolaou, 2012) or be approxi‐mated empirically (e.g., Korotkin, 2008).Estimated values by potential theory, are in general between 2% to 5% of ship’s mass, depending on the slenderness of the hull.It proved recently, while calculating the added mass of a cat‐amaran by CFD (Xing-Kaeding and Papanikolaou, 2021)that the effect of viscosity on the estimation of a11is signif‐icant and should not be neglected.
Similarly, we have the equation which relates the torque generated by the engine shaft and required by the propel‐ler, namely,QEandQP, respectively.When the engine torque is larger than the propeller torque, the shaft will be accelerated and this can be described as follows:
whereωPis the angular velocity of the propeller;JPis the propeller moment of inertia and can be approximated as follows:
wheremPis the mass of the propeller andkPis a value typ‐ically between 19~28, often cited as 23.
The added moment of inertia of the propeller can be ap‐proximated using the empirical formula of MacPherson et al.(2007) as:
where EAR andp/Dare the expanded area ratio and pitch ratio of the propeller, respectively.And the empirical val‐ues of the C1and C2coefficients are presented in Table 1.

Table 1 Coefficients used in calculating CIE
2.5 Engine’s governor and calculation of fuel index
Modern marine diesel engines are always equipped with a speed governor to maintain a certain commanded speed and to limit its operation within some constraints.A gover‐nor does this by computing the fuel rate input and controls the fuel actuator, while considering the limitations of the engine such as the maximum torque (Altosole and Figari,2011).This is especially important when the engine is op‐erating near the engine limits, or when the environment that the ship is operating in induces large propeller load variations.Therefore, the governor is crucial to ensure that the propulsion plant of the ship functions smoothly and safely (Lanchukovsky, 2009).
In this study, we will use a PI-type governor provided by MATLAB-Simulink to carry out the simulations.A PItype governor comprises action from both Proportional (P)control and Integral (I) control.P-control is the simplest form of feedback control and works by linearly correlating the controller output to the input signal.However, it tends to yield a bias signal, or steady-state error, thus preventing the system from achieving the steady-state set point.This behaviour is described as follows:
wherec(t) is the controller output,KPis the proportional gain of the controller,e(t) is the error signal andbis the bias.
In contrast to P-control, I-control is able to remove the bias and return the system to the intended state.A negative input signal will cause the I-controller to return a decreas‐ing signal, whilst a positive input signal will cause the sig‐nal to increase.However, the I-controller alone is much slower than the P-controller despite its accuracy.The be‐haviour of the I-controller is described as follows:
whereKIis the integral gain of the controller andc(t0) is the controller output before integration.
By combining both P- and I-controls, the bias is re‐moved, and the speed of the controller is ensured.The equation for PI-control is as follows:
In this study, we will follow the Ziegler-Nichols meth‐od (Ellis, 2012) to tune theKIandKPparameters of the controller.
The output signal of the governor is defined asm(t) in the time domain.It is used to calculate the change in fuel index, ∆Xf, as follows:
wherenssis the rotational speed of the shaft at steady-state conditions.This represents the dynamically changed incre‐ment of the fuel index.As the output of the governor changes when the ship is accelerating, ∆Xf(t) would be changing as well.
The fuel index at the current time,Xf, which is the oper‐ating point of the engine, is then changed by the value ∆Xf:
Therefore, the governor combines the dynamic incre‐ments of the fuel index with that of the steady state fuel in‐dex to return a new fuel index.The new fuel index will give us the new fuel rate, h, which can be determined by:
where SMCR is the specified maximum continuous rating.
3 Numerical implementation
The above outlined method has been implemented in MATLAB Simulink environment, as schematically pre‐sented in Figure 1.
When a higher speed is specified/commanded, the error signal to the PI governor, which is the difference between the commanded speed and the actual/current engine speed,will increase.Based on the gain settings of the governor,the output will be adjusted accordingly to reduce the error input.In this case, the change in fuel index, ∆Xf(t) will be increased to supply more fuel into the diesel engine.Sub‐sequently, the diesel engine will supply more torque to in‐crease the engine shaft revolutions.For a direct-drive con‐figuration, the propeller revolution rate will be the same as the engine shaft revolution rate.Therefore, the advance number will decrease, resulting in an increase in the thrust and torque coefficients, thereby increasing the net thrust and the propeller torque simultaneously.The increase in net thrust results in the ship undergoing acceleration, and the ship speed to increase with time.The increase in pro‐peller torque results in lower net torque available to accel‐erate the engine shaft revolutions, therefore decreasing the acceleration.The increase in ship speed results in an in‐crease in the ship resistance, leading to an increase in the effective power.Subsequently, the required brake power and the operating point of the engine is ramped up, which will determine the new steady-state fuel input to the en‐gine.After this, the cycle repeats with the new error signal to the PI governor being computed.The PI governor con‐tinues to increase the fuel index as long as the error signal is positive, but at a decreasing rate as the error signal gets smaller, until the error signal reaches a steady-state zero.
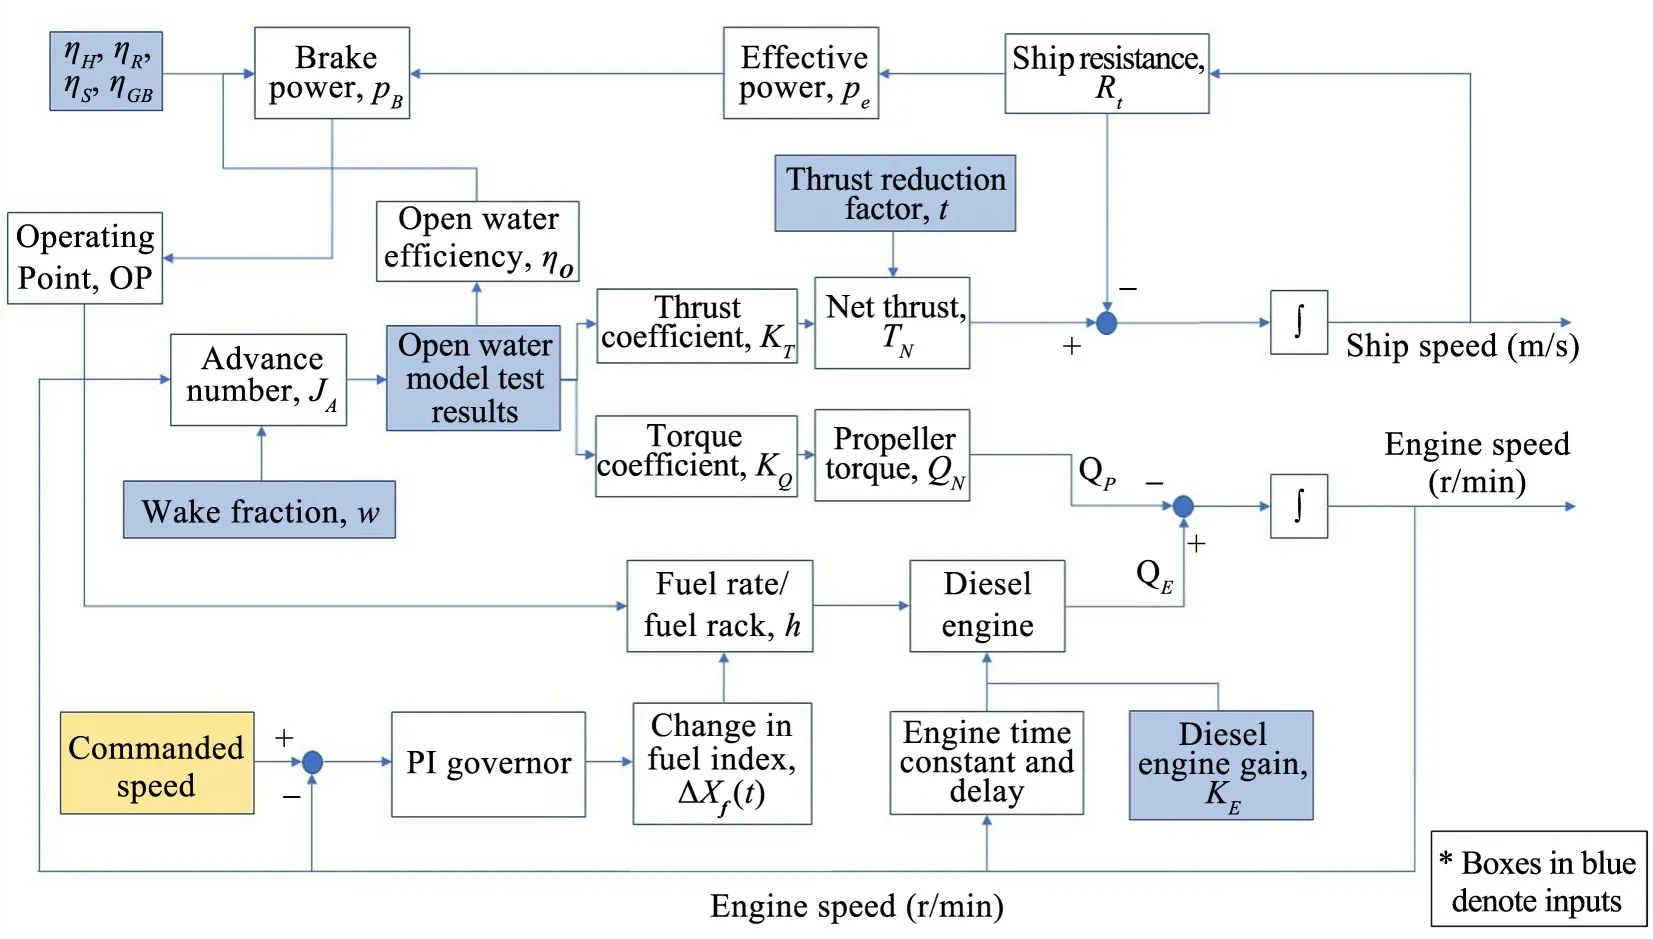
Figure 1 Diagram of the dynamic model set-up in MATLAB Simulink
4 Model validation
To validate the set-up model, a case study presented ear‐lier by Zeraatgar and Ghaemi (2019) was repeated.Table 2 shows the main characteristics of the hull, propeller, and engine, etc.The study was designed to capture the acceler‐ation from 70% to 100% of shaft rotational speed (at SMCR) in ship operation, which corresponds to a change of the engine’s power rating from approximately 35% to 100% of NCR.The simulations were conducted in two sce‐narios.In Case 1, the proportional gain valueKP, was ad‐justed while the integral gainKIwas set to 0.According to the Ziegler-Nichols method,KPwas raised from 0 until a value at which the system became unstable, as shown in Figure 2.Subsequently, the value ofKPbefore the point of instability is denoted byKmax.Afterwards, theKPwas set to 0.45Kmaxand the simulations were repeated by varying the integral gain valuesKI, which is Case 2.From the simula‐tions of Case 1,Kmaxwas found to be 33, and therefore the optimal value ofKPis 14.85.For Case 2, the simulations were conducted over the range ofKIfrom 1 to 23 to inves‐tigate the effect of changing the integral gainKIon the time taken and fuel consumption.The results for the two cases are given in Tables 3 and 4.
From the results of Case 1, we can observe a rather sig‐nificant difference between the fuel consumption across the range of values ofKP.Specifically, there is a 12.5% in‐crease in fuel consumption between the values ofKP=1 andKP=33, whereas the time taken to travel the distance of 15 km was only reduced by approximately 71.2 s, or 5.3%.Therefore, we can conclude that a lowerKPvalue will re‐sult in more significant fuel savings when the ship acceler‐ates under the sole action of the P-controller, if there is a higher leeway for travelling time.

Table 2 Ship particulars
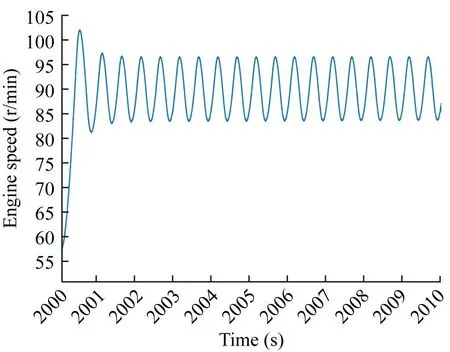
Figure 2 Engine speed oscillations at KP=34

Table 3 Simulation result from Case 1
As for the results of Case 2, we can deduce that there is no significant difference in travelling time or fuel con‐sumption due to the addition of the I-controller.This is be‐cause the I-controller works to counteract the effects of the P-controller, when the P-controller has caused the system to overshoot the intended point.The I-controller thus works to bring the system back to the intended steadystate value, and this effect can be seen below in the follow‐ing figures.While there are no significant differences across different values ofKI, the value of the optimalKIof the PI-controller is determined according to the Ziegler-Nichols method and is taken to be 1.2 times of the frequen‐cy atKP=Kmax+1.Figure 2 shows the oscillations when the system is unstable, and the period of oscillations is 0.52 s.The optimal value ofKIis therefore calculated to be 2.31.The optimal values of the PI-controller, namely,KP=14.85 andKI=2.31, are then used in the following simulations.
As can be seen in Figure 3, when the full-ahead com‐mand is given, the engine’s actual speed undergoes a very fast increase in revolution rate and reaches 103 r/min with‐in 1 s, while it reaches the steady state value of 92.8 r/min rapidly thereafter.This shows the engine overcompensat‐ing for the step increase in commanded speed, and may re‐sult in a waste in fuel consumption as the fuel input to the engine is increased by a large amount.

Figure 3 Time-history of engine speed (r/min)
Figures 4‒6 show the obtained time-histories of the con‐cerned characteristics, including the instantaneous ship speed, the distance travelled, and the total fuel consump‐tion of the ship with respect to time.

Figure 4 Time-history of ship speed V

Figure 5 Time-history of distance travelled by ship
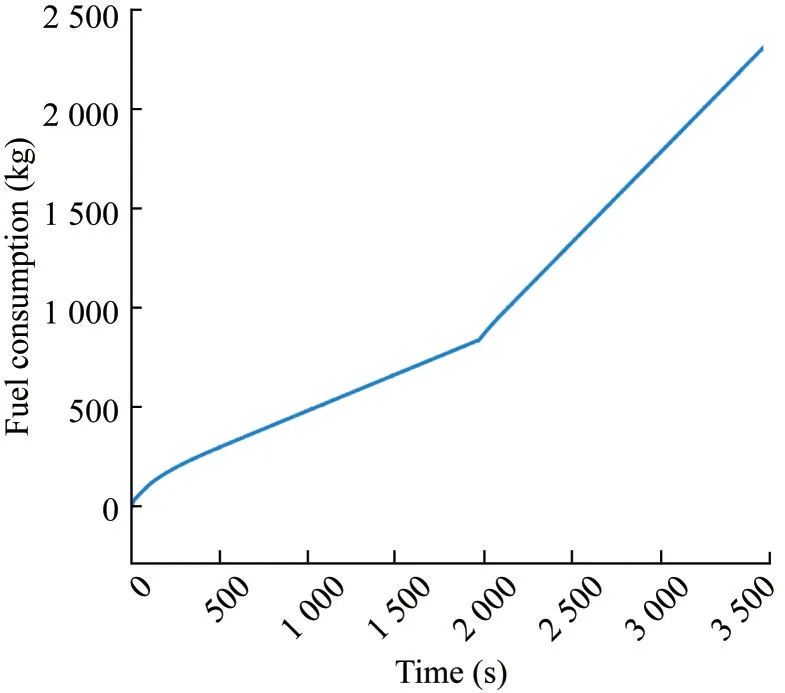
Figure 6 Time-history of fuel consumption
We observe in Figure 7 a significant difference betweenTN(in red) andRT(in blue) as the ship undergoes accelera‐tion aftert=2 000 s for over 200 s.This is owing to the large inertia/mass of the ship, which results in a long time required to bring the ship to the desired speed.While a large net thrust is required to accelerate the ship, the large inertia of the ship results in a very low acceleration.This results in a much higher fuel consumption compared with the case of reduced net thrust supplied to bring the ship to speed at a slower rate.In Figure 8, we also observe a much higher engine torque supplied as opposed to the pro‐peller torque for the initial 2 s of ship acceleration.While this difference exists for a shorter duration compared with what is observed in Figure 7, the significant difference be‐tween the two torques account for the sudden increase in the engine speed shown in Figure 3.Similarly, in Figure 9,the delivered brake power is much higher than the re‐quired brake power for several hundred seconds starting fromt= 2 000 s.This tells us that a high acceleration of the engine speed would result in an excessive power out‐put, subsequently a much higher fuel consumption rate throughout the acceleration phase, which will be further discussed in the following section.
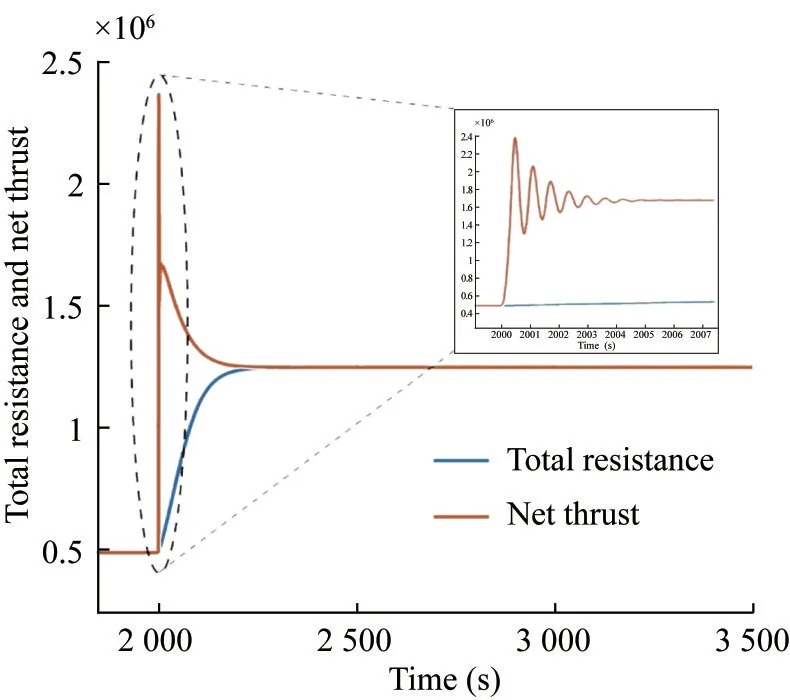
Figure 7 Time-history of total resistance (RT) and net thrust (TN)

Figure 8 Time-history of engine torque (QE) and propeller torque(QP)

Figure 9 Time-history of required and delivered brake power
In order to further examine the influence of the P Con‐troller, a case study was conducted by setting the integral gain to 0.Figure 10 shows the simulated shaft revolutions when the proportional gainKP=1 andKI=0.As can be seen, the shaft experiences an instantaneous jump in the revolution rate att=2 000 s, which is not realistic.The rev‐olution rate then gradually increases to the setpoint, over a period of approximately 800 s.When compared with re‐sults shown in Figure 3 using a PI-controller, this case takes significantly longer duration, which indicates that the engine is unable to respond quickly to command, and may not be desirable in maneuvering at sea.This “lag” in engine acceleration and therefore, ship speed, also ex‐plains the difference in time taken for the ship to travel 15 km as compared to a ship under the action of a PI control‐ler.It is also observed that the difference between the Net ThrustTN(in red) and Total ResistanceRT(in blue) over time is much smaller, as shown in Figure 11, when com‐pared with the scenario in the previous sub-section where a PI controller is used.This is due to the milder accelera‐tion of the shaft to the steady-state value, and therefore there is a lower fuel consumption in this case, as pointed out by Zeraatgar and Ghaemi (2019).

Figure 10 Time-history for engine speed for Case 1, KP=1

Figure 11 Time-history of total resistance (RT) and net thrust (TN)with P-controller, KP=1
Figure 12 shows a comparison of the achieved engine speed when using PI or P governors.When the model is first initialised for 65 r/min, the P governor is unable to bring the engine speed to the desired setpoint, and when the step input of 92.8 r/min is given, the engine speed over‐shoots without returning.Therefore, steady-state errors will exist when using a P-controller.This is in contrast to the PI governor, which is able to reach the desired setpoint very accurately.Note that PI-controllers are used in the maritime industry to control the main engines.
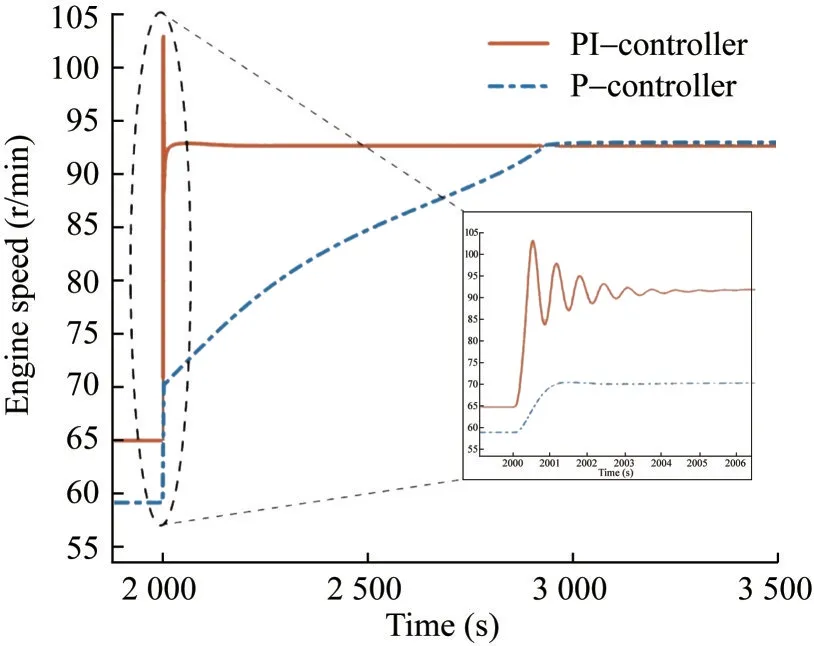
Figure 12 Comparison of engine speed when using P or PI governor
When using PI-controller, the diesel engine accelerates almost instantaneously, from 65 r/min to 101 r/min when a new speed is commanded, as shown in Figure 3, and the input power is increased from 30% to 100%.Such a situa‐tion is highly improbable and undesirable as such a high acceleration in engine revolutions would place high stress on the shaft and result in thermal overload of the engine,leading to damages and risks.Normally, an engine load limiter is implemented in the governor to control the rate of increase in shaft revolutions, as also indicated in the en‐gine manufacturer’s publications (MAN Diesel & Turbo,2016).As such, a slope limiter for the ordered engine speed can be employed to represent the actual engine oper‐ation, as shown in the study of Mizythras et al.(2018).In this study, we implement the same settings of the speed slope limiter in the governor.With the slope limiter, the en‐gine acceleration is limited to 0.04 r/min/s in the simula‐tion from 65 r/min to 92.8 r/min when the input power is increased from 30% to 100%, as shown in Figure 13.As a result, the target engine speed is achieved in over 700 s,which is more realistic than what has been observed in the simulations without a slope limiter.As the engine acceler‐ates at a slower, controlled rate, the ship speed increases at a slower rate, taking 800 s to reach the steady-state speed,as shown in Figure 14.This results in a longer time to complete the travelling distance of 15 km and the fuel con‐sumption during this voyage also decreases, as shown in Figures 15 and 16, respectively.

Figure 13 Time-history of engine speed with slope limiter,together with a PI governor

Figure 14 Time-history of ship speed with slope limiter

Figure 15 Time-history of distance travelled with slope limiter

Figure 16 Time-history of fuel consumption with slope limiter
Figures 17 and 18 present the comparison of the net thrust and the total resistance, as well as the delivered en‐gine power and the hydrodynamic power required by the propeller, obtained with or without the acceleration limiter being implemented.When an acceleration limiter is ap‐plied, it takes the ship a much longer time to achieve at the steady-state.During this process, the difference between the net thrust and the total resistance, as well as between the delivered brake power and the required hydrodynamic power, is much smaller when the limiter is applied.Subse‐quently, a mild acceleration is observed and less fuel is consumed.This is in line with manufacturer’s instruction on engine operation during acceleration manoeuvre (MAN Diesel & Turbo, 2012).

Figure 17 Time-history of total resistance (RT) and net thrust (TN)with slope limiter

Figure 18 Time-history of required and delivered brake power with slope limiter
5 Application to realistic scenario
Given that the model is able to account for the dynamic interactions of the hull-propeller-engine, the model is then applied to analyse the scenario that a ship encounters an adverse seaway condition.This is a realistic scenario, par‐ticularly related to the safe navigation of bulk carriers and tankers (IMO, 2021; Liu et al., 2022a).
A product carrier is selected for this case study.Its main features are list in Tables 6 and 7, and the resistance curve and open-water characteristics are presented in Figures 20 and 21, respectively.From the onboard monitored data, itwas noted that the ship encountered a harsh weather condi‐tion with 18 m/s wind and waves of significant height of 4.45 m in 2017.As the model requires the engine speed as input, the monitored engine speed is adopted as input.Figure 22 shows such a scenario where the engine speed drops from 118 to 92 within 45 minutes.A linear behav‐iour is assumed as the best approximation of the moni‐tored data (one point per 15 minutes).During the simula‐tion, the fouling, wind and wave effects are considered,and the increase in resistance and drop in propeller efficien‐cy are predicted (Liu & Papanikolaou, 2020 & 2023; Liu et al., 2022b), as shown in Figure 23.Figure 24 shows the en‐gine power output from the simulation and Figure 25 shows the ship speed drops from about 14 kn to approxi‐mately 2.75 kn during this process.Following the concept of the minimum propulsion power assessment, if a ship can maintain a minimum speed of 2 kn in adverse condi‐tions, then she can be manoeuvred efficiently to avoid any dangerous situation.The simulation results thus proves that the subject ship disposes the propulsion and steering abilities for safe navigation in adverse conditions.

Table 5 Simulation result from Case 2, KP = 14.85

Figure 19 Engine load during ship acceleration

Table 6 Ship characteristics

Table 7 Engine characteristics (MAN B&W 6S50MC-C)
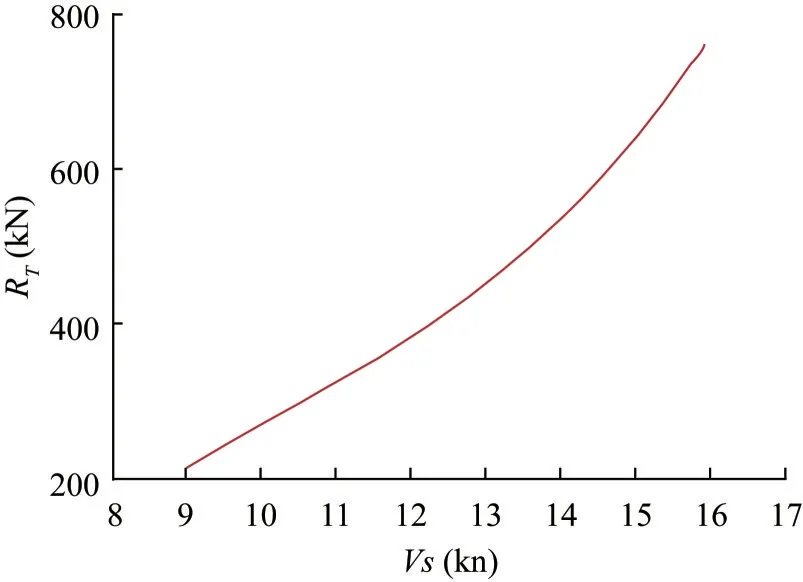
Figure 20 Resistance curve of the subject ship under design conditions

Figure 21 Propeller open-water characteristics

Figure 22 Engine speed as monitored onboard of the ship
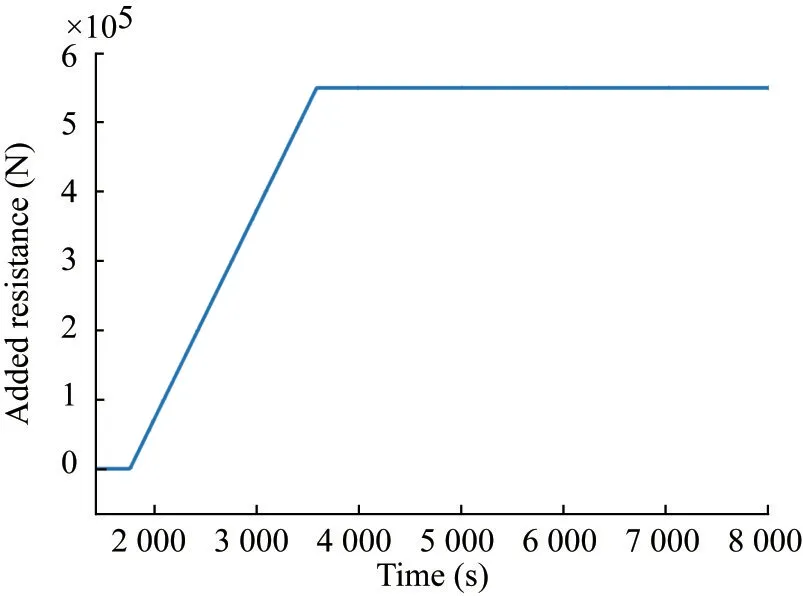
Figure 23 Added resistance in service condition estimated based on weather and ship condition

Figure 24 Simulation of the engine power output
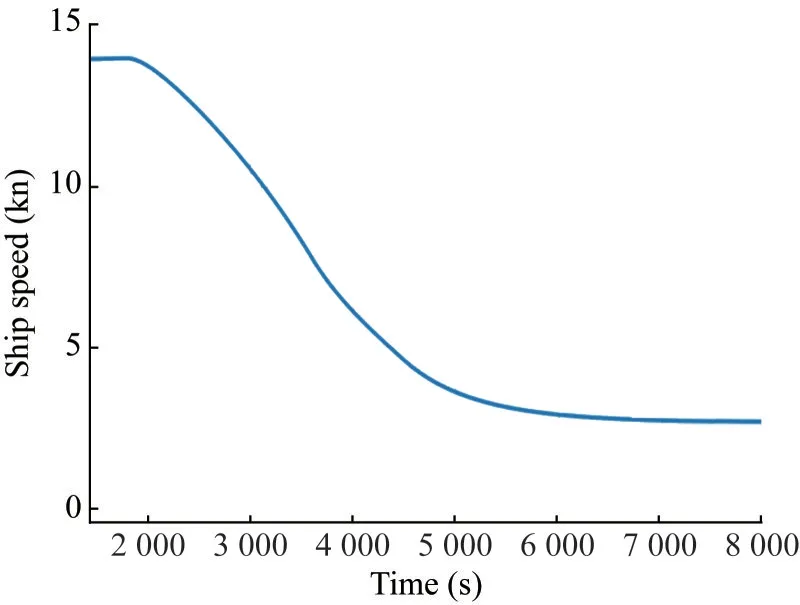
Figure 25 Simulation of the ship speed during this process
6 Conclusion
In this study, a dynamic model accounting for the inter‐actions between the hull, propeller, and engine is set up and implemented in MATLAB Simulink to simulate a ship’s fuel consumption during unsteady operation.In this model, the ship resistance and propeller characteristics are required as input.The diesel engine is modelled by a firstorder transfer function with a delayed response and its per‐formance is calibrated with the data from the manufactur‐er’s catalogue.A governor is applied to maintain the pre-set engine’s rotational speed and to control the engine fuel rate.In addition, a slope limiter is employed to approximate the actual engine operation during engine acceleration.
Using this model and the correlated software, the influ‐ence of using P or PI governor on fuel consumption is in‐vestigated.It is noted that using PI governor can achieve the commanded engine speed accurately, while the P gov‐ernor fails to do so.When a slope limiter is implemented,a significant reduction in fuel consumption is observed, as compared with the case without such a limiter, owing to the lower acceleration of the engine speed which results in lower fuel input to the engine.Therefore, by limiting the acceleration of the engine, considerable savings on fuel consumption can be achieved, with a slight increase in travelling time.Additionally, the dynamic process of ship acceleration, represented by the trace of engine operating point presented in the engine envelope, clearly demonstrat‐ed that the propeller curve will become heavier in this ma‐noeuvre.The findings of this study are rather different from what earlier studies showed, despite that very similar model has been implemented to conduct the same case study.
After validation, the established model is applied to sim‐ulate the case of a real ship encounters harsh seaway con‐dition.Simulation result show that the dynamic process of ship speed decreasing and the generated results are qualita‐tively in good agreement with monitored data.It should be noted that the current formulation is only a one degree of freedom (dof) model.We plan to extend it to multiple dof in the future and more validations and applications will be carried out.
AcknowledgementThe first author would like to thank Professor Theotokatos of University of Strathclyde for his discussion and support of this study.
Competing interestThe authors have no competing interests to de‐clare that are relevant to the content of this article.
杂志排行
Journal of Marine Science and Application的其它文章
- Review of Risk Analysis Studies in the Maritime LNG Sector
- Design and Optimization of an Integrated Power System of Solid Oxide Fuel Cell and Marine Low-Speed Dual-Fuel Engine
- Maritime Energy Transition: Future Fuels and Future Emissions
- Environmental and Economic Evaluation of Dual-Fuel Engine Investment of a Container Ship
- Combustion Analysis of Low-Speed Marine Engine Fueled with Biofuel
- The Potential of Inedible Biodiesel as an Eco-Friendly and Sustainable Alternative Fuel for Marine Diesel Engines in India
