Kinetic Energy Budgets during the Rapid Intensification of Typhoon Rammasun (2014)
2023-02-08XinQUANandXiaofanLI
Xin QUAN and Xiaofan LI
Key Laboratory of Geoscience Big Data and Deep Resource of Zhejiang Province, School of Earth Sciences,Zhejiang University, Hangzhou, Zhejiang 310027, China
ABSTRACT In this study, Typhoon Rammasun (2014) was simulated using the Weather Research and Forecasting model to examine the kinetic energy during rapid intensification (RI).Budget analyses revealed that in the inner area of the typhoon,the conversion from symmetric divergent kinetic energy associated with the collocation of strong cyclonic circulation and inward flow led to an increase in the symmetric rotational kinetic energy in the lower troposphere.The increase in the symmetric rotational kinetic energy in the mid and upper troposphere resulted from the upward transport of symmetric rotational kinetic energy from the lower troposphere.In the outer area, both typhoon and Earth’s rotation played equally important roles in the conversion from symmetric divergent kinetic energy to symmetric rotational kinetic energy in the lower troposphere.The decrease in the symmetric rotational kinetic energy in the upper troposphere was caused by the conversion to asymmetric rotational kinetic energy through the collocation of symmetric tangential rotational winds and the radial advection of asymmetric tangential rotational winds by radial environmental winds.
Key words: Typhoon Rammasun (2014), rapid intensification, kinetic energy budget, symmetric and asymmetric winds,divergent and rotational circulations, environmental flows
1.Introduction
Typhoons may experience a rapid intensification (RI)period before landfall, which often leads to large economic losses and deaths in the coastal areas.For example, the maximum wind speed in the super Typhoon Rammasun (2014),which is analyzed in this study, increased from 40 m s-1to 60 m s-1within 24 h before landfall at Hainan, China on 18 July 2014, causing a huge economic loss of over 26 billion Chinese Yuan and approximately 30 deaths.To effectively reduce the damage caused by typhoons, accurate typhoon forecasting is required to facilitate informed governmental decisions before landfall.When compared to the significant improvement in the track forecasts of tropical cyclones (TC)in recent decades, improvement in TC intensity forecasts have shown relatively slower progress (Elsberry et al.,2007; Rappaport et al., 2009; DeMaria et al., 2014).The intensity forecasts mainly rely on numerical model guidance; however, improvement of numerical predictions requires an indepth understanding of the physical processes associated with the intensity change.Primary physical processes and factors associated with TC intensity change include environmental effects (DeMaria et al., 1993; Zeng et al., 2010; Feng et al., 2014), inner core dynamics (Montgomery and Kallenbach, 1997; Wang, 2002; Miyamoto and Takemi, 2015;Chen, 2016; Chen et al., 2019), underlying surface forcing(Yang et al., 2008; Cheng et al., 2012; Cheng and Wu,2020), and convection and latent heat release (Kanada and Wada, 2015; Li et al., 2016).
Many studies have contributed to enhancing the understanding of dynamic processes associated with the RI of TCs.The RI of Hurricane Opal (1995) was caused by the mean vertical advection and mean vorticity flux terms (Persing et al., 2002).The RI of TC Dora (2007) was related to the superposition of potential vorticity structure of the trough with strong deformation (Leroux et al., 2013).The RI of Typhoon Man-yi (2013) was associated with the enhanced mesovortex under the condition of reduced static stability (Wada, 2015).The RI of Typhoon Megi (2010)resulted from strengthened rotational circulations in the mid and upper troposphere through the transport of vorticity(Chang and Wu, 2017).The RI of Typhoon Vicente (2012)was largely affected by an upper-tropospheric “inverted ”trough (Shieh et al., 2013).The analysis of the asymmetric impacts at multiple scales during RI found that the changes in asymmetric circulations were associated with the baroclinic conversion from available potential to kinetic energies, and the conversion between asymmetric kinetic energies (Prasanth et al., 2020).
Budgets of tangential wind, vorticity, and kinetic energy have been analyzed to examine dynamic processes associated with the RI in previous studies.The RI of Vicente was related to mean radial flux of absolute mean vertical vorticity and vertical advection of the azimuthal mean tangential wind by the azimuthal mean vertical motion in the azimuthal mean tangential wind budget (Chen et al., 2017),and to tilting of the horizontal vorticity and upward vorticity advection in the mean vorticity budget of circular area(Chen et al., 2018).The positive tendency of the TC kinetic energy associated with the RI of Typhoon Hato (2017)resulted mainly from the conversion of kinetic energy of large-scale circulations in the barotropic eddy kinetic energy equation (Zhang et al., 2019).
Previous studies have focused on the analyses of RI mechanisms using analyses that have been carried out in the inner core of the tropical cyclone where maximum winds are located.In the current case study of Typhoon Rammasun(2014), kinetic energy budgets in outer area during RI are also examined in addition to the analyses in the inner region.The questions that are discussed in this study are: How do kinetic energies during RI change vertically and horizontally? What dynamic processes control the kinetic energy changes in inner and outer areas and in the lower, middle,and upper troposphere during RI?
The paper is organized as follows.An overview of super Typhoon Rammasun (2014) is presented, the model simulation design is introduced, and a comparison between observations and simulations is presented in section 2.The vertical structures of kinetic energy budgets are analyzed in section 3, and the dominant dynamic terms in kinetic energy budgets are discussed in-depth through partitioned analysis in section 4.Lastly, a summary is given in section 5.
2.Overview of Typhoon Rammasun (2014),model design, and kinetic energy budgets
Typhoon Rammasun (2014) originated in the northwest Pacific Ocean at 1400 Local Standard Time (LST; LST =UTC + 8) on 12 July 2014 and moved westward, developing into a severe typhoon.The first landfall was made on the southern Luzon Island of the Philippines at 1700 LST on 15 July.Rammasun (2014) weakened to a typhoon following landing, continued to move northwestward after 1400 LST on 17 July, and subsequently began to strengthen rapidly.It developed into a super typhoon at 1000 LST on 18 July and landed at Wenchang, Hainan, China at 1400 LST.During landing, the central pressure dropped to 918 hPa and the maximum wind speed increased to 72 m s-1, making it the strongest typhoon among those that made landfall in China since 1973.
Kaplan and Demaria (2003) defined RI when change in the maximum wind speed of the typhoon in 24 h is more than 15 m s-1.This definition has been adopted by previous studies (Yamada et al., 2010; Leroux et al., 2016).Based on this definition of RI, the 13-h period from 0200 LST to 1400 LST on 18 July was considered as the RI of Rammasun(2014) in this study.
Version 4 of the Weather Research and Forecasting(WRF) Model was used to simulate Typhoon Rammasun(2014), and Global Forecast System analysis data (GFS;0.5° × 0.5°) were used to construct the initial and lateral boundary conditions.The model used two-way nesting and three nested domains (Fig.1) with horizontal grid spacings of 18, 6, and 2 km and domain sizes of 299 (lon.) × 235(lat.), 634 (lon.) × 538 (lat.), and 1015 (lon.) × 904 (lat.)grid points, respectively.The model had 50 vertical layers,with the top at 10 hPa.The model physics packages included the WRF single-moment 6-class cloud microphysics scheme (WSM6; Hong and Lim, 2006), BouLac planetary boundary layer (Bougeault and Lacarrere, 1989), Kain-Fritsch cumulus parameterization scheme (Kain, 2004),which was only used in the outermost domain, longwave radiation parameterization scheme (Mlawer et al., 1997), shortwave radiation parameterization scheme (Dudhia, 1989),Monin-Obukhov surface layer model (Moon et al., 2007),and Noah Land surface model (Ek et al., 2003).The model was integrated from 1400 LST on 16 July to 1400 LST on 19 July, which covered the 13-h RI period of Rammasun(2014) in the South China Sea.An average of the 13-h simulation data was used to conduct the following analysis of the kinetic energy budget.
Comparing the simulation of Rammasun (2014) with the Joint Typhoon Warning Center best track data (Fig.2),it can be seen that the simulated maximum wind speed of Rammasun (2014) is consistent with the observation, and the difference in peak intensity between the simulation and observation only was 0.74 m s-1at 1400 LST on 18 July.The simulated minimum sea-level pressure generally followed observations and the simulated typhoon track wasslightly north of the observed track.The largest difference between the simulated and observed centers was less than 90 km at 1400 LST on 17 July.Thus, the simulation reasonably reproduced the intensity and track of Rammasun(2014).
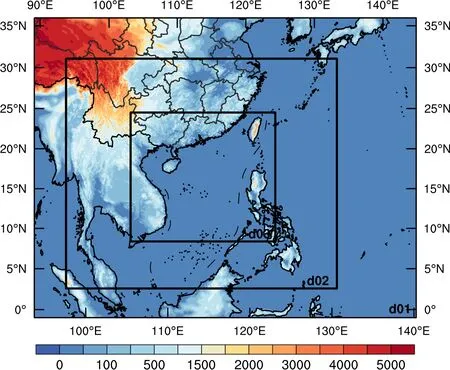
Fig.1.Map of the three nested model domains.The color bar indicates the height (m) of the topography.
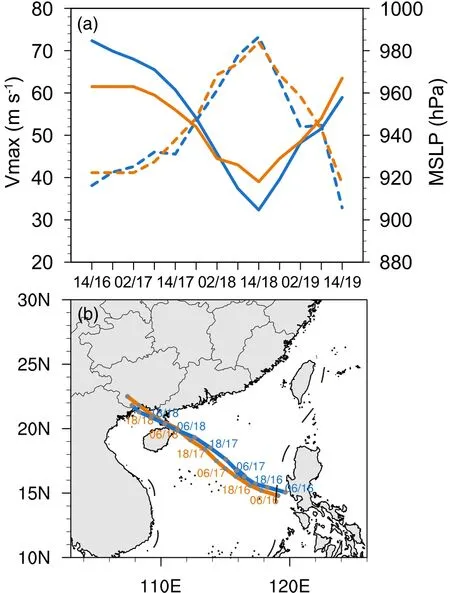
Fig.2.(a) Maximum wind speed (solid, m s-1) and minimum sea level pressure (dashed, hPa) and (b) track of Typhoon Rammasun (2014) from simulation (blue) and observation(orange).Time is in LST.
The change in TC intensity is accompanied by complex energy conversion processes, including the conversion between the kinetic energies of the TC and the energy conversion between the large-scale environmental and TC components, as well as the conversion between the potential and kinetic energies.When a cylindrical coordinate system is established at the center of the typhoon and moves with the typhoon, the kinetic energy associated with typhoon circulation can be decomposed into four components: symmetric rotational, symmetric divergent, asymmetric rotational, and asymmetric divergent components.The associated four kinetic energy budgets can then be derived accordingly (Li,1993; Wang et al., 2016).The derivation of the four kinetic energy equations is provided in the appendix.Note that the tendencies of kinetic energy at a given time were calculated taking the differences in kinetic energy between the simulation data a time step ahead and a time step behind to guarantee the accuracy of kinetic energy budgets.
The conversion between the environmental kinetic energy and TC kinetic energy in Eq.(A3) can be used to study the impacts of environmental wind, particularly environmental wind shear, on the change in typhoon intensity.We separated environmental and typhoon circulations using Kurihara’s filtering method (Kurihara et al., 1993, 1995), multiscale window transform (Liang and Anderson, 2007), and acombination of these two methods, respectively.We found that the combination of these two methods resulted in the better separation than the individual methods as shown in a study by Zhao et al.(2015).Therefore, a combination of these two methods was used in this study.
3.Analysis of area-averaged kinetic energy budgets
Since winds in the inner area of the typhoon are considerably larger than those in the outer area, the kinetic energy budgets in the inner area may be different from those in the outer area during RI.Thus, kinetic energy budgets were calculated in a circular area with a radius of 200 km (inner area)and annular areas with radii of 200-400 km and 400-600 km (outer area), respectively.Because the maximum wind of a typhoon is mainly tangential rotational wind, we first analyzed the symmetric rotational kinetic energy budget(Fig.3).Analysis of symmetric rotational kinetic energy budget averaged over a circular area with a radius of 200 km showed that the symmetric rotational kinetic energy increased in the troposphere; however, the physical processes that were responsible for the increase varied with increasing height (Fig.3a).Below 800 hPa, the increase in the symmetric rotational kinetic energy resulted from the conversion from symmetric divergent kinetic energy to symmetric rotational kinetic energy.From 800 hPa to 600 hPa,the increase in symmetric rotational kinetic energy was equally contributed from the convergence of the flux of the symmetric rotational kinetic energy and geopotentialand the conversion from asymmetric rotational kinetic energy to symmetric rotational kinetic energy.Above 600 hPa, the increase in symmetric rotational kinetic energy originated from the convergence of the flux of the symmetric rotational kinetic energy and geopotential.Near 300 hPa, the conversion from environmental kinetic energy to symmetric kinetic energyand F Kψscontributed equally to the increase in the symmetric rotational kinetic energy.
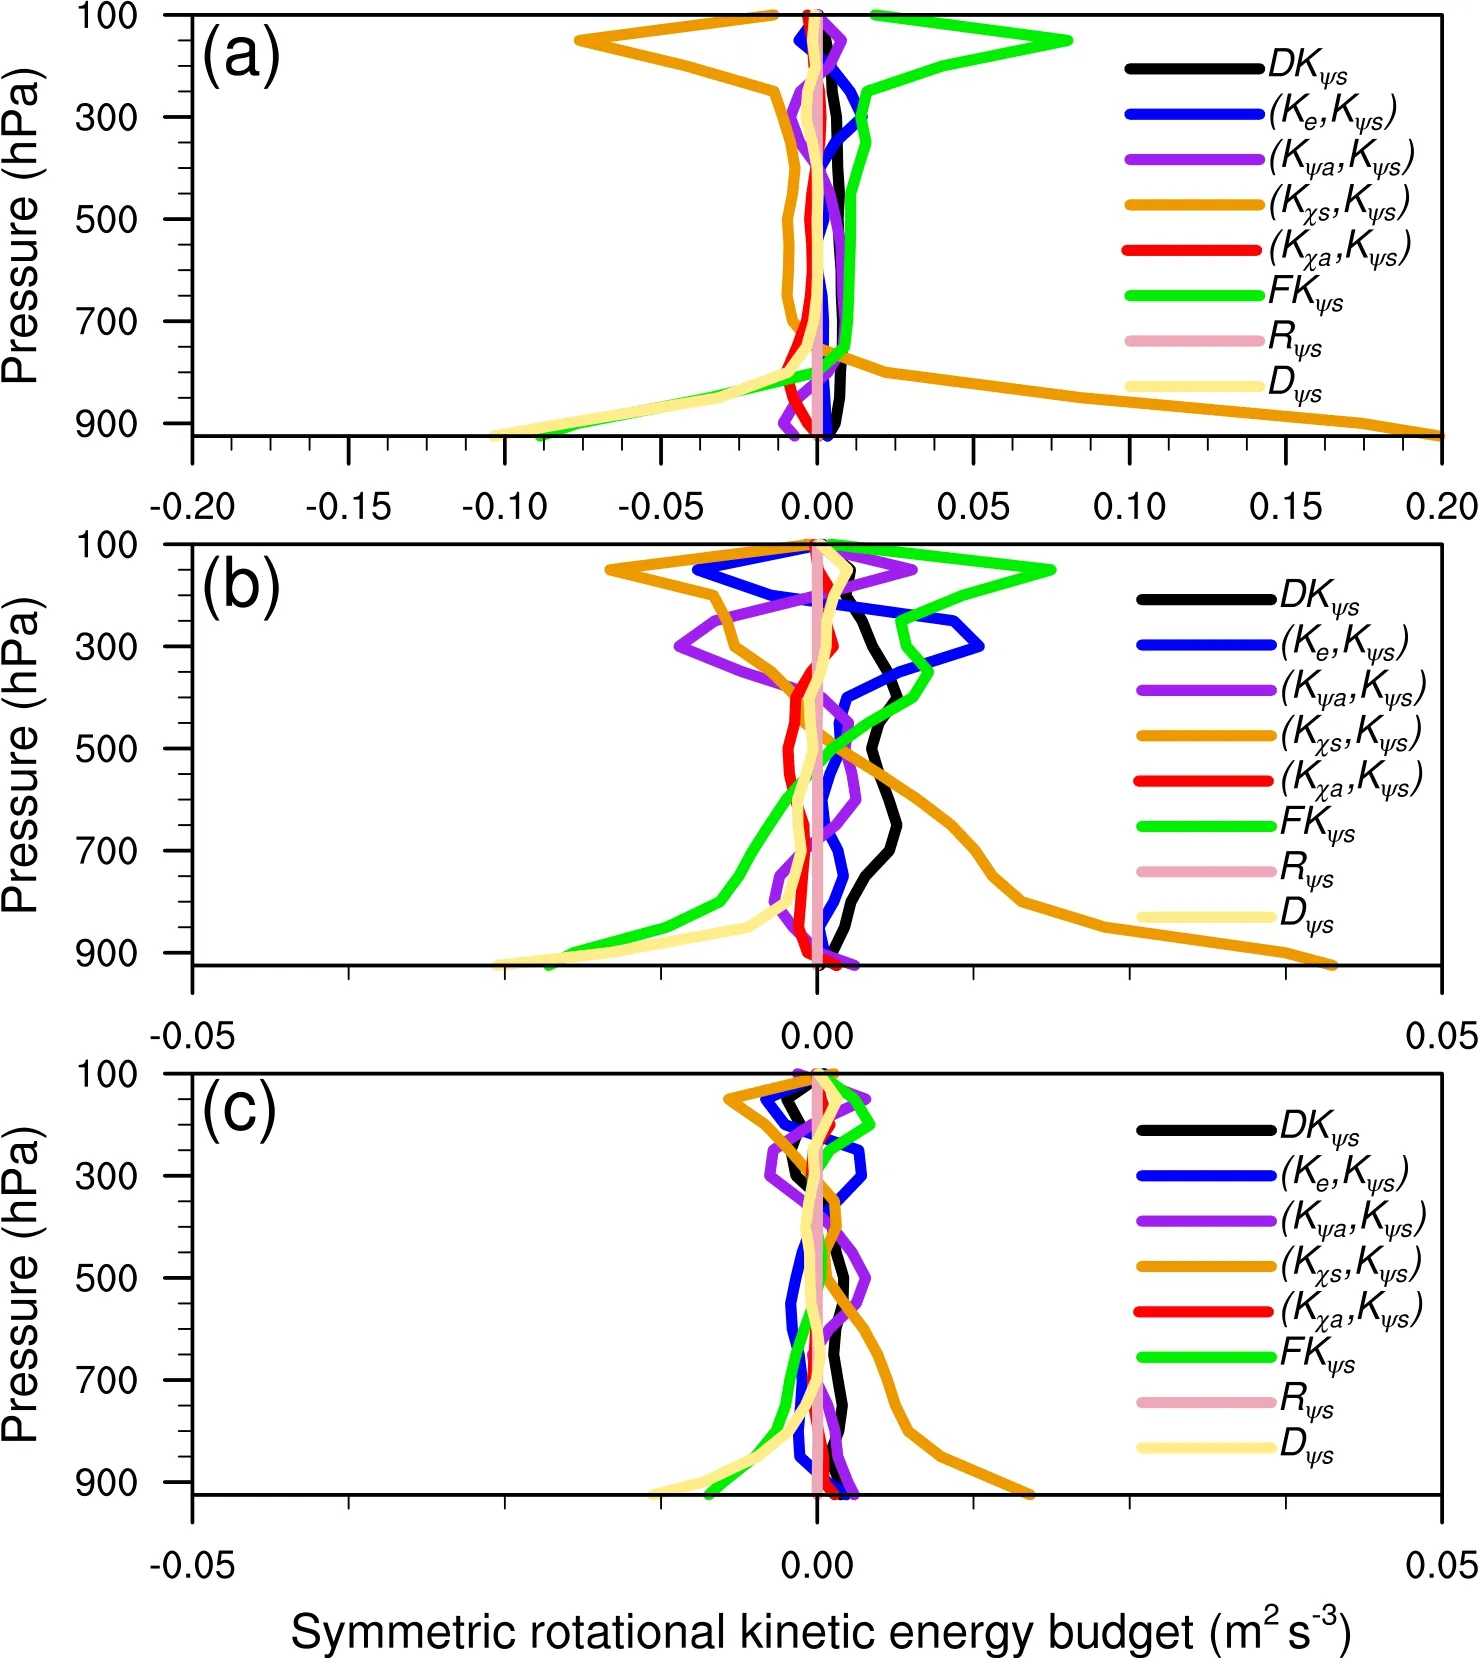
Fig.3.Vertical profiles of symmetric rotational kinetic energy budgets (m2 s-3) averaged in (a)the circular area with a radius of 200 km and the annular area with radii of (b) 200-400 km and (c)400-600 km, respectively.
Similarly, the analysis of symmetric rotational kinetic energy budget averaged over the annular area with a radius of 200-400 km revealed an increase in the symmetric rotational kinetic energy in the troposphere (Fig.3b).However,the increase only appeared below 350 hPa in the calculation of the symmetric rotational kinetic energy budget averaged in the annular area with a radius of 400-600 km (Fig.3c).The magnitude of the increase in symmetric rotational kinetic energy and the associated conversion from symmetric divergent kinetic energy to symmetric rotational kinetic energy significantly decreased as the radius increased(Fig.3).The conversion from symmetric divergent kinetic energy to symmetric rotational kinetic energy made a dominant contribution to the increase in the symmetric rotational kinetic energy below 800 hPa within a radius of less than 200 km (Fig.3a) and below 550 hPa within a radius of 200-600 km (Figs.3b and 3c).Unlike the analysis of the 200 km circular area average, the analysis of the annular area average with the radius of 200-400 km showed thatcontributed more to the increase in the symmetric rotational kinetic energy than F Kψsnear 300 hPa (Fig.3b).Analysis of the annular area average of a radius of 400-600 km revealed that the conversion from asymmetric rotational kinetic energy to symmetric rotational kinetic energyplayed a dominant role in the increase in symmetric rotational kinetic energy in the mid-troposphere(Fig.3c).
Since the increase in symmetric rotational kinetic energy in the mid and lower troposphere mainly originated from the conversion from symmetric divergent kinetic energy, we analyzed the symmetric divergent kinetic energy budget (Fig.4).In the mid and lower troposphere, the loss of symmetric divergent kinetic energy was compensated for by the conversion from potential energy,which is consistent with the results of Ding and Liu (1986).The balance betweenand (P,Kχs) occurred below 800 hPa, 500 hPa, and 300 hPa in the budget averaged over the circular areas with a radius of 200 km (Fig.4a),200-400 km (Fig.4b), and 400-600 km (Fig.4c).The conversion from symmetric divergent kinetic energy to potential energy appeared above 800 hPa in the budget averaged over a circular area with a radius of 200 km (Fig.4a).The budget averaged over the annual area with a radius of 200-400 km showed that the symmetric divergent kinetic energy gained from the conversion of symmetric rotational kinetic energy above 500 hPa was converted to potential energy from 500 hPa to 200 hPa, whereas it led to an increase in symmetric divergent kinetic energy above 200 hPa (Fig.4b).The budget averaged over the annual area with a radius of 400-600 km revealed that in the upper troposphere, symmetric rotational kinetic energy and potential energy were converted to symmetric divergent kinetic energy, which led to an increase in symmetric divergent kinetic energy (Fig.4c).
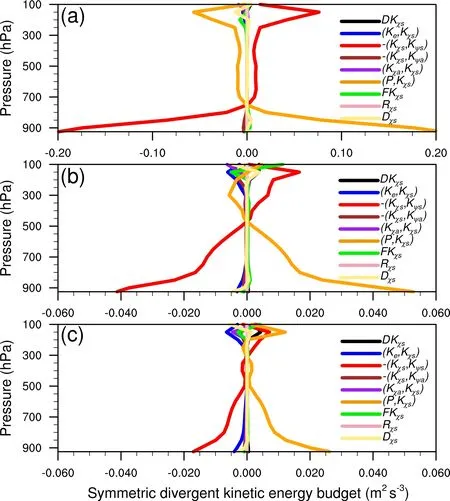
Fig.4.Vertical profiles of symmetric divergent kinetic energy budgets (m2 s-3) averaged in (a)the circular area with a radius of 200 km and the annular area with radii of (b) 200-400 km and (c)400-600 km, respectively.
The asymmetric rotational kinetic energy decreased with time (Fig.5).The decreasing rate was one order of magnitude lower than the increasing rate of the symmetric rotational kinetic energy.The budget averaged in the circular area with a radius of 200 km showed that the decrease in asymmetric rotational kinetic energy below 300 hPa mainly resulted from the divergence of the flux of asymmetric rotational kinetic energybelow 800 hPa and from 300-400 hPa and from the conversion to symmetric rotational kinetic energyfrom 400-800 hPa(Fig.5a).The budgets averaged in the annual areas withradii of 200-400 km and 400-600 km showed that the asymmetric rotational kinetic energy was converted to environmental kinetic energy, which caused a decrease in the asymmetric rotational kinetic energy below 400 hPa(Figs.5b and 5c).
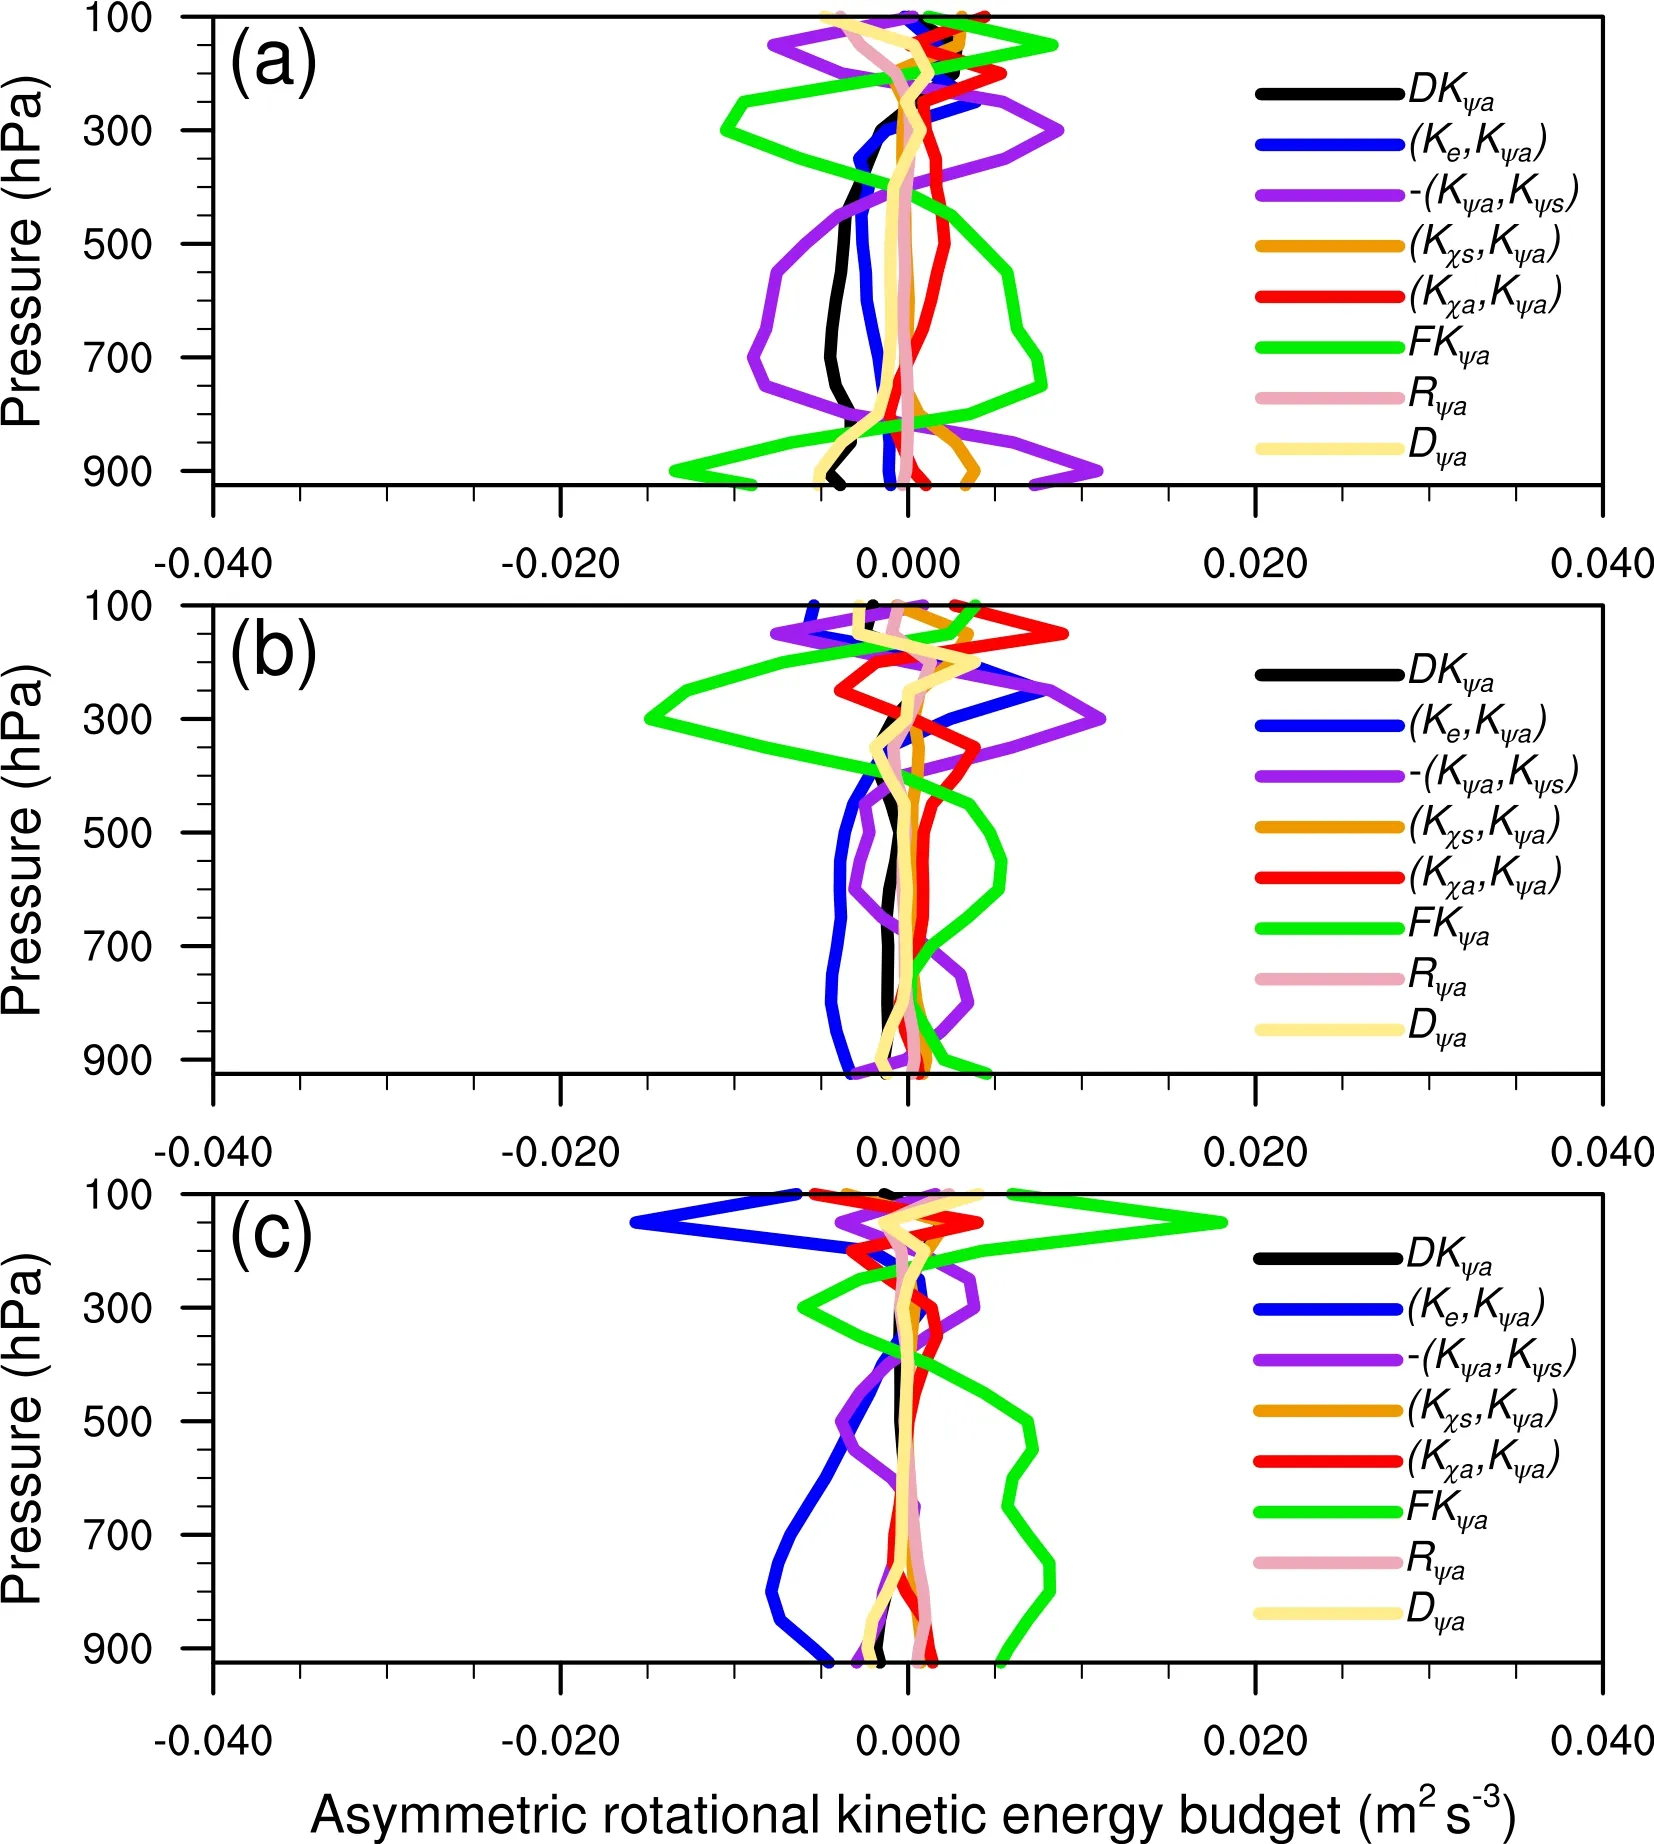
Fig.5.Vertical profiles of asymmetric rotational kinetic energy budgets (m2 s-3) averaged in (a) the circular area with a radius of 200 km and the annular area with radii of (b) 200-400 km and (c) 400-600 km,respectively.
The change in asymmetric divergent kinetic energy was small (Fig.6).The budget averaged in the circular area with a radius of 200 km revealed that below 600 hPa, the conversion from asymmetric divergent kinetic energy to symmetric rotational kinetic energywas balanced by the divergence of the flux of asymmetric divergent kinetic energy(Fig.6a).At approximately 500 hPa, the conversion from symmetric rotational kinetic energy to asymmetric divergent kinetic energy was offset by the conversion from asymmetric divergent kinetic energy to asymmetric rotational kinetic energy.Above 300 hPa,the conversion from environmental kinetic energy to asymmetric divergent kinetic energywas balanced bythe divergence of the flux of asymmetric divergent kinetic energy as well as the conversion from asymmetric divergent kinetic energy to potential energy.The terms of the asymmetric divergent kinetic energy budgets averaged in the annular areas with radii of 200-400 km and 400-600 km (Figs.6b and 6c) are considerably smaller thanthose averaged in the circular area with a radius of 200 km,which is not discussed in this study.
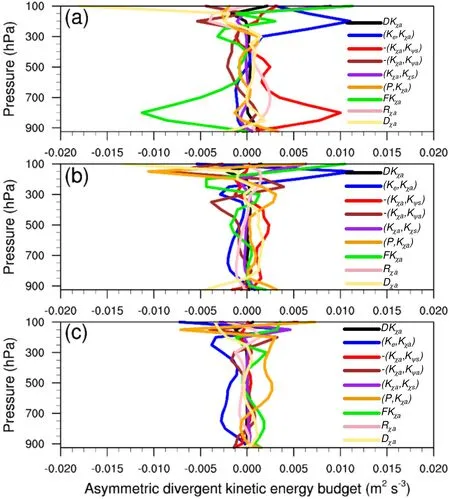
Fig.6.Vertical profiles of asymmetric divergent kinetic energy budgets (m2 s-3) averaged in (a) the circular area with a radius of 200 km and the annular area with radii of (b) 200-400 km and (c) 400-600 km, respectively.
4.Partitioned analysis of major physical terms
The analysis of kinetic energy budgets in the previous section showed that the important terms depend on the radius and vertical levels.To further explore the dominant processes associated with these major terms, partitioned analyses were conducted in the lower (850 hPa), middle (500 hPa)and upper (300 hPa) troposphere.The results from the previous section revealed that in a circular area with a radius of 200 km, the increases in symmetric rotational kinetic energy were related to the conversion from symmetric divergent kinetic energy to symmetric rotational kinetic energy at 850 hPa, the convergence of the flux of symmetric rotational kinetic energy at 500 hPa, the flux convergence and the conversion from environmental kinetic energy to symmetric rotational kinetic energy at 300 hPa.Thus, the terms are partitioned as follows: following (A3a), (A4a) (A4b) and (A5a)in the Appendix,can be written as:


where the first (subscript “1”) and second (subscript “2”)terms on the right-hand side of Eqs.(1)-(3) are from the first and second terms on the right-hand side of Eqs.(A3a),(A4a), and (A4b), which are the conversions related to the horizontal and vertical advection processes of environmental winds, asymmetric rotational winds and symmetric divergent winds, respectively; the third (subscript “3”) terms on the right-hand side of (1)-(3) are from the third terms on the right-hand side of (A3a), (A4a), and (A4b), which are the Coriolis force of environmental winds, asymmetric rotational winds and symmetric divergent winds, respectively; the first(subscript “1”) and second (subscript “2”) terms on the righthand side of (4) are from the first and second terms on the right-hand side of (A5a), which are the convergence of horizontal and vertical fluxes of symmetric rotational kinetic energy, respectively; and the third (subscript “3”) term in the right-hand side of (4) is from the third term on the righthand side of (A5a), which is the convergence of horizontal geopotential flux by symmetric rotational winds.
Within the radius of 200 km from the typhoon center,the conversion from symmetric divergent kinetic energy to symmetric rotational kinetic energy was determined by the horizontal advection processes [ (Kχs,Kψs)1] at 850 hPa(Fig.7g).The flux convergence was due to the convergence of vertical flux of symmetric rotational kinetic energyat 500 hPa (Fig.7d) and 300 hPa (Fig.7a).The strong upward motions resulted from prevailing low-level convergent inflow of air that transported the symmetric rotational kinetic energy associated with themaximum wind from the lower troposphere to the mid and upper troposphere, strengthening the symmetric rotational kinetic energy in the mid and upper troposphere.The conversion from environmental kinetic energy to symmetric rotational kinetic energy was related to vertical advection processes [ (Ke,Kψs)2] (Fig.7a).The conversion from symmetric divergent kinetic energy to symmetric rotational kinetic energy occurred within 100 km from the typhoon center, with a maximum at approximately 30 km.The flux convergence at 500 hPa and 300 hPa and the conversion from environmental kinetic energy to symmetric rotational kinetic energy at 300 hPa occurred within 20-40 km with their maxima at approximately 30 km.
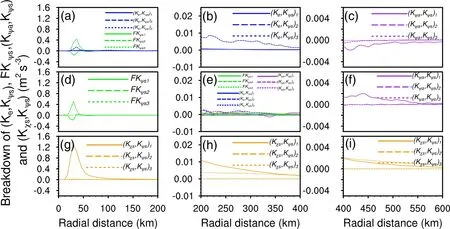
Fig.7.Radial variation of tangentially averaged partitioned components of (a) the conversion between environmental kinetic energy and symmetric rotational kinetic energy and the flux divergence of symmetric rotational kinetic energy, (b) the conversion between asymmetric rotational kinetic energy and symmetric rotational kinetic energy ,and (c) ( K ψa,Kψs) at 300 hPa, (d) F Kψs ,(e) , ( K ψa,Kψs), the conversion between symmetric divergent kinetic energy and symmetric rotational kinetic energy and F K ψs , and (f) ( K ψa,Kψs) at 500 hPa and (g-i) ( K χs,Kψs) at 850 hPa.Units:m2 s-3.
Analysis of the tangential average from 200 km to 400 km showed that the conversion from symmetric divergent kinetic energy to symmetric rotational kinetic energy was related to the horizontal advection processesfrom 200 km to 400 km and the Coriolis forcefrom 300 km to 400 km (Fig.7h).Figure 3b shows that the conversion from both asymmetric rotational (Kψa,Kψs)and symmetric divergent kinetic energy to symmetric rotational kinetic energy and flux convergence contributed equally to the increase in the symmetric rotational kinetic energy at 500 hPa.The comparison between 500 hPa (Fig.7e),300 hPa (Fig.7b), and 850 hPa (Fig.7h) revealed that the four terms that contributed to the increase in symmetric rotational kinetic energy at 500 hPa had negligibly small magnitudes, which will not be discussed in this study.The conversion from environmental kinetic energy to symmetric rotational kinetic energy at 300 hPa was determined by the vertical advection processes(Fig.7b).
Analysis of the tangential average from 400 to 600 km revealed that the conversion from symmetric divergent kinetic energy to symmetric rotational kinetic energy at 850 hPa was due to both (Kχs,Kψs)1and (Kχs,Kψs)3(Fig.7i).The conversion from asymmetric rotational kinetic energy to symmetric rotational kinetic energy at 500 hPa was related to(Fig.7f).The conversion from symmetric rotational kinetic energy to asymmetric rotational kinetic energy at 300 hPa is related to(Fig.7c).
Substituting Eq.(A1a) into the first term on the righthand side of Eq.(A4b), (Kχs,Kψs)1can be separated as:
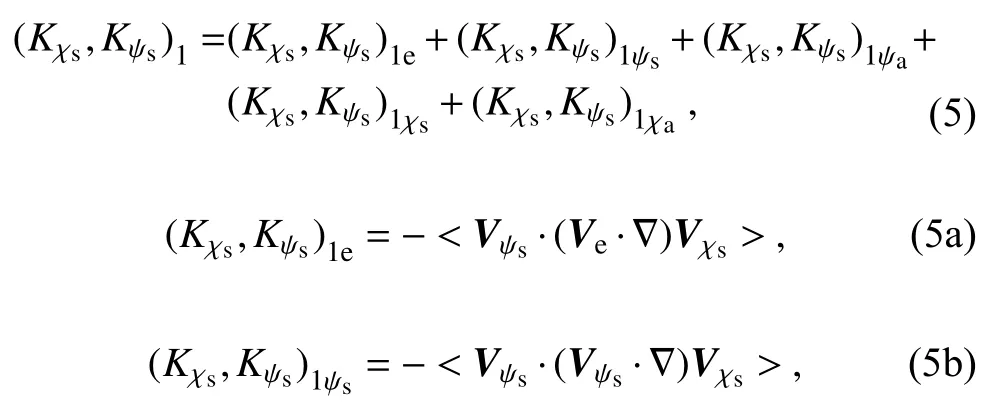
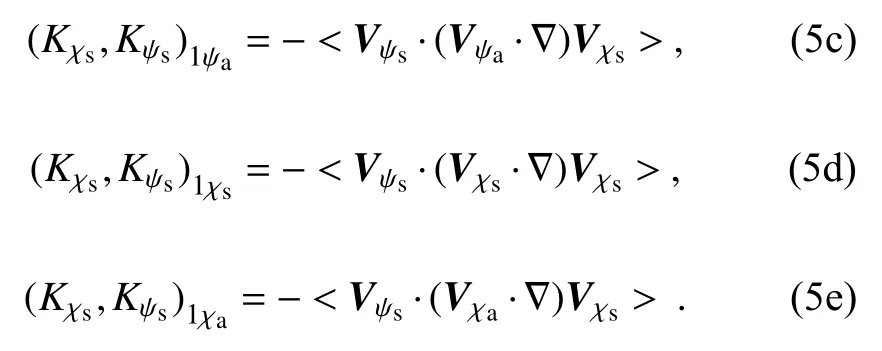
Within a radius of 600 km, (Kχs,Kψs)1at 850 hPa was controlled by (Kχs,Kψs)1ψs(Figs.8a, 9b and 10a3).In cylindrical coordinates, (Kχs,Kψs)1ψscan be further partitioned into terms related tothe horizontal advection, and the terms (Kχs,Kψs)1ψs,Candthat aregenerated due to thetransformation from Cartesian coordinates to cylindrical coordinates, that is,
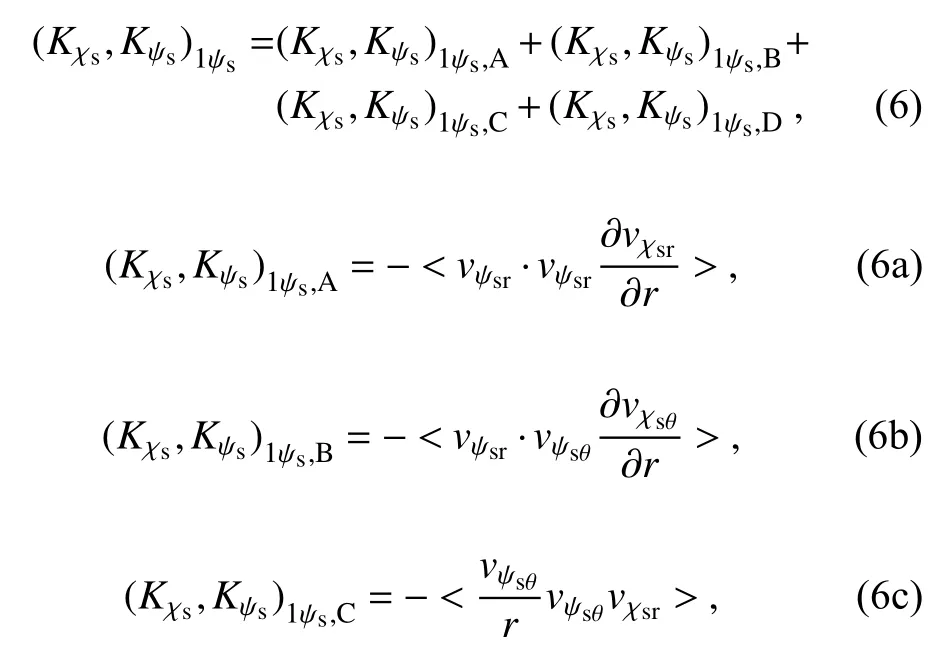
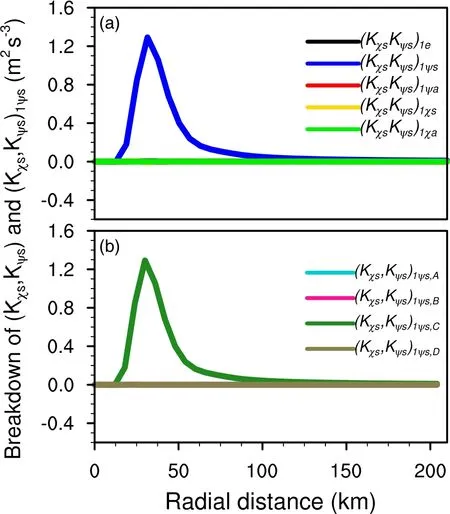
Fig.8.Radial variation of tangentially averaged partitioned components of (a) ( Kχs,Kψs)1 and (b) ( Kχs,Kψs)1ψs . Except for(Kχs,Kψs)1ψs in (a) and ( K χs,Kψs)1ψs,C in (b), the other partitioned components of ( K χs,Kψs)1 and ( K χs,Kψs)1ψs are negligibly small.Units: m2 s-3.

Within a radius of 600 km, (Kχs,Kψs)1ψsat 850 hPa is determined by the collocation of tangential component of symmetric rotational winds and radial component of symmetric divergent winds(Figs.8b, 9c and 10b3).Maximum cyclonic winds and inward convergent flows occurred in the lower troposphere during RI.The interaction between strong symmetric cyclonic tangential winds and inward convergent radial flows led to the conversion of symmetric divergent kinetic energy to symmetric rotational kinetic energy in the lower troposphere, which further increased symmetric rotational kinetic energy and strengthened cyclonic circulations.This indicates that the low-level inflow played an important role during the RI.
(Ke,Kψs)2at 300 hPa can be further partitioned into:
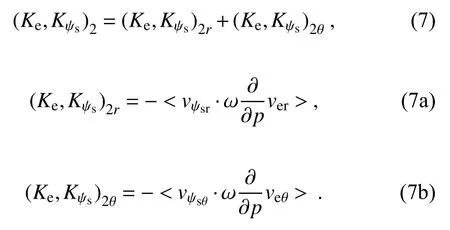
Figure 9a shows that (Ke,Kψs)2is determined by(Ke,Kψs)2θ, suggesting that the conversion from environmental kinetic energy to symmetric rotational kinetic energy results from the collocation of vertical advection of tangential environmental winds and tangential component of symmetric rotational winds.
Substituting Eq.(A1a) into the first term on the righthand side of Eq.(A4a), (Kψa,Kψs)1can be separated into:
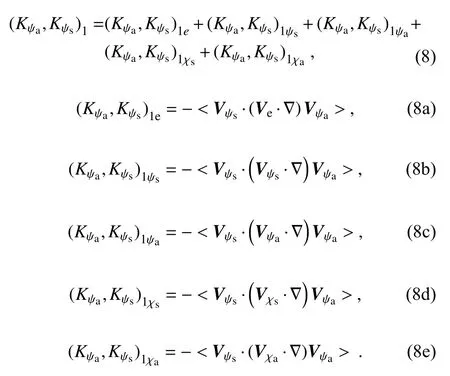
The tangential average of 400-600 km revealed that the increase in symmetric rotational kinetic energy owing to the conversion from asymmetric rotational kinetic energy at 500 hPa resulted from the horizontal advection by the environmental winds(Fig.10a2).The decrease in the symmetric rotational kinetic energy due to the conversion to asymmetric rotational kinetic energy at 300 hPa was related to the horizontal advection by the environmental winds(Fig.10a1).In cylindrical coordinates,can be further separated into terms related to the horizontal advection of asymmetric rotational circulation by environmental windsand the termsthat are generated due to the transformation from Cartesian coordinates to cylindrical coordinates, that is,
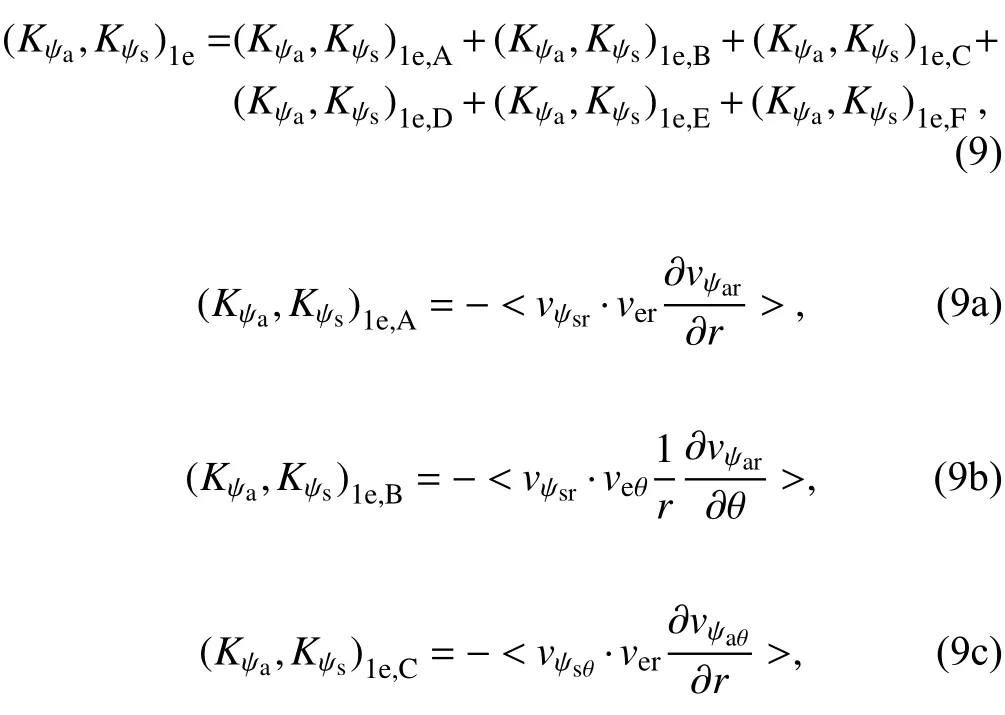
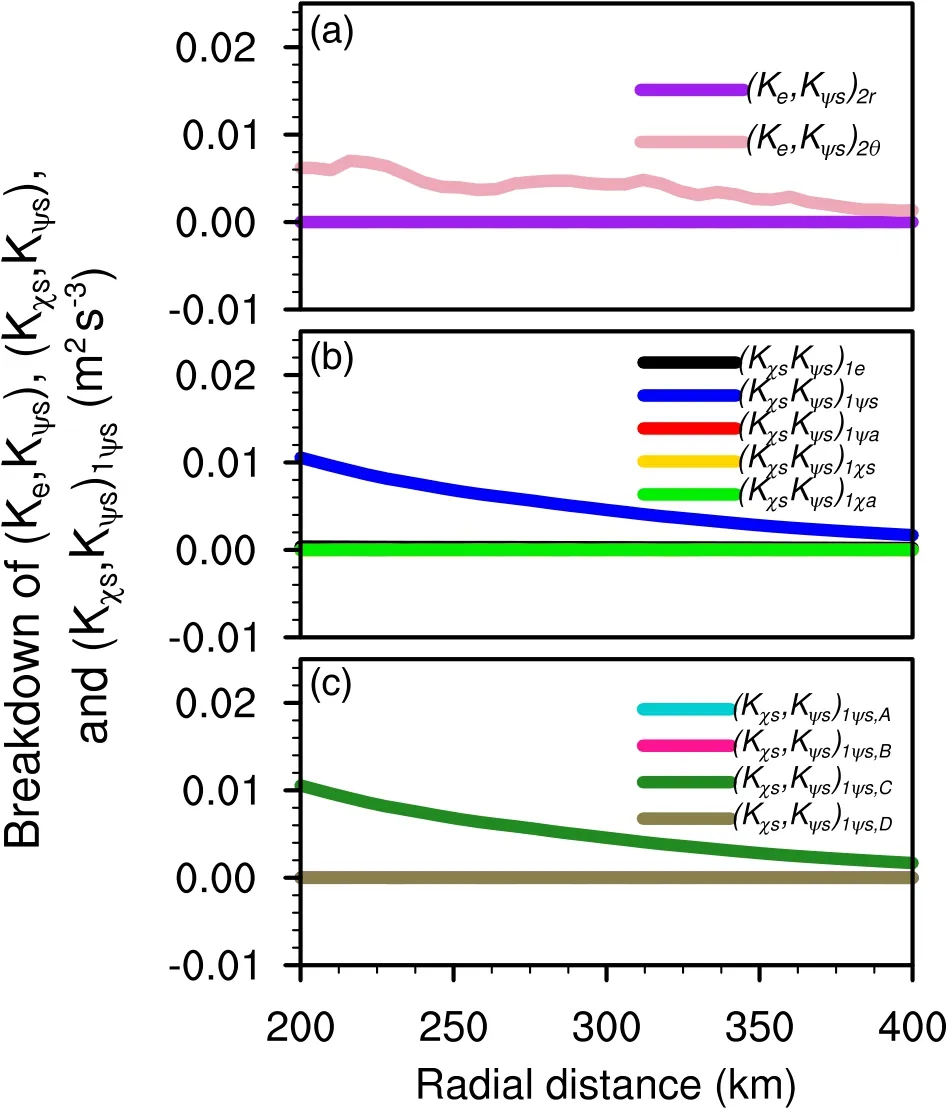
Fig.9.Radial variation of tangentially averaged partitioned components of (a) ( Ke,Kψs)2 (m2 s-3) at 300 hPa, and (b)(Kχs,Kψs)1and (c) ( K χs,Kψs)1ψs at 850 hPa.Except for(Ke,Kψs)2θ in (a), ( Kχs,Kψs)1ψs in (b), and ( Kχs,Kψs)1ψs,C in (c), the other partitioned components of (Ke,Kψs)2, (Kχs,Kψs)1, and(Kχs,Kψs)1ψsare negligibly small.Units: m2 s-3.
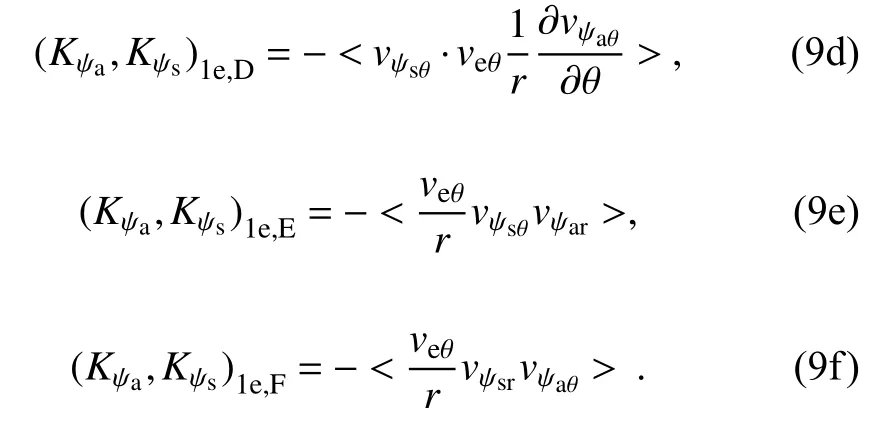
The conversion from asymmetric rotational kinetic energy to symmetric rotational kinetic energy due to the horizontal advection of asymmetric rotational circulations by environmental windsat 500 hPa was caused by the collocation of the tangential component of symmetric rotational winds and the radial advection of asymmetric tangential rotational winds by the radial environmental windsand the interaction between radial component of asymmetric rotational winds and tangential components of environmental winds and symmetric rotational winds(Fig.10b2).The conversion from symmetric rotational kinetic energy to asymmetric rotational kinetic energy due to the horizontal advection of environmental windsat 300 hPa was mainly attributed to the collocation of tangential component of symmetric rotational winds and the radial advection of asymmetric tangential rotational winds by radial environmental winds(Fig.10b1).(P,Kχs)can be partitioned into:
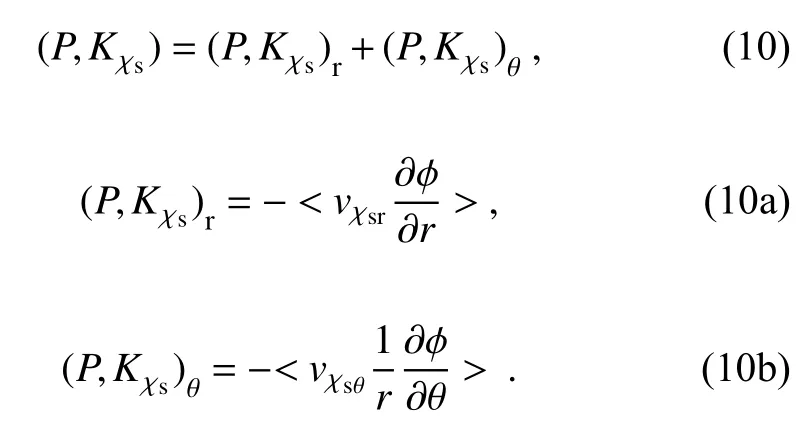
Within a radius of 200 km, the conversion from potential energy to symmetric rotational kinetic energy at 850 hPa resulted from the work done through radial geopotential advection by symmetric convergent inflows(Fig.11).In the lower troposphere, the geopotential increased dramatically as the radius increased, while convergent inflows prevailed.The collocation of an outward geopotential gradient and prevailing inflows transferred the potential energy to symmetric rotational kinetic energy in the lower troposphere.Similar results were found in the tangential average within 200-400 km and 400-600 km (not shown).
Following Eq.(A5b), F Kψacan be separated into:
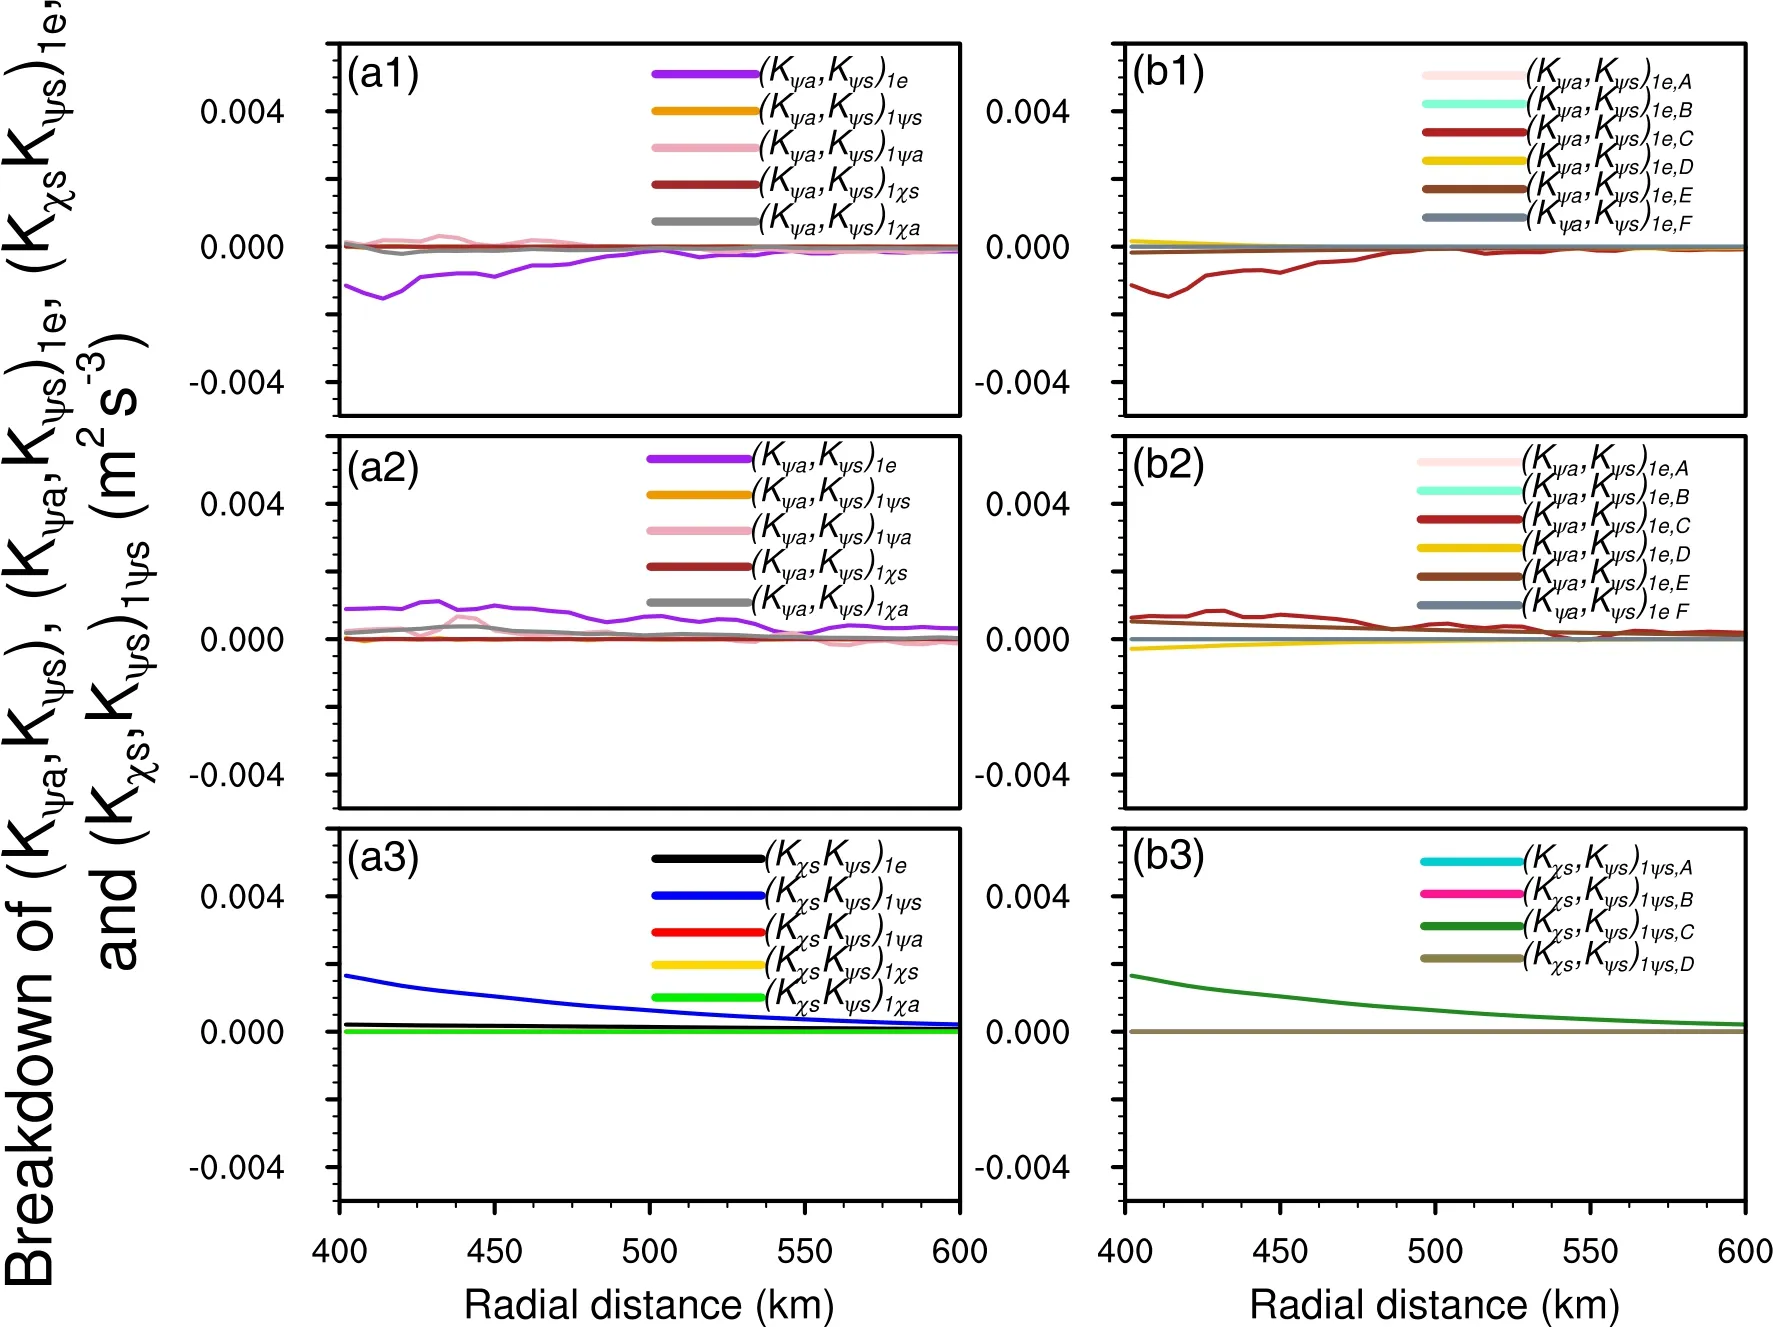
Fig.10.Radial variation of tangentially averaged partitioned components of (a1, a2) ( Kψa,Kψs)1 and (b1, b2)(Kψa,Kψs)1e at (a1, b1) 300 hPa, and (a2, b2) 500 hPa, and (a3) ( K χs,Kψs)1 and (b3) ( K χs,Kψs)1ψs at 850 hPa.Units:m2 s-3.

where the first (F Kψa1) and second (F Kψa2) terms on the right-hand side of (11) are from those of (A5b), which are the convergence of horizontal and vertical fluxes of asymmetric rotation kinetic energy, respectively; the third (F Kψa3)and fourth (F Kψa4) terms on the right-hand side of (11) are from those of (A5b), which are the convergence of horizontal and vertical fluxes of dot product of symmetric and asymmetric rotational winds, respectively; the fifth term (F Kψa5) on the right-hand side of (11) is from that of (A5b), which is the convergence of horizontal geopotential flux by asymmetric rotational winds.
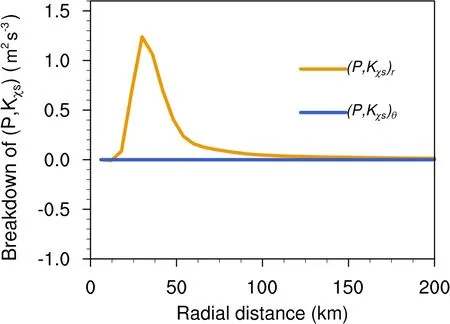
Fig.11.Radial variation of tangentially averaged partitioned components of the conversion from potential energy to symmetric rotational kinetic energy at 850 hPa.Units:m2 s-3.
Within a radius of 400-600 km, the conversion from asymmetric rotational kinetic energy to symmetric rotational kinetic energy at 500 hPa was supported by both flux convergence of the dot product of symmetric and asymmetric rotational windsand flux convergence of the geopotential field(Fig.12b).The conversion from symmetric rotational kinetic energy to asymmetric rotational kinetic energy at 300 hPa was balanced by the flux divergence of the dot product of the symmetric and asymmetric rotational winds(Fig.12a).
5.Summary
In this study, the RI of Typhoon Rammasun (2014) that occurred in 2014 was simulated using the WRF model.The simulation was compared with observations in terms of maximum winds, minimum sea level pressures and typhoon movement.The simulation data were used to analyze the kinetic energy budget during RI.The winds were first partitioned into environmental winds and typhoon circulations, and the typhoon circulations were further separated into symmetric and asymmetric rotational winds, and symmetric and asymmetric divergent winds in cylindrical coordinates.The symmetric rotational kinetic energy generally showed anincrease within a radius of 600 km from the typhoon center during RI.
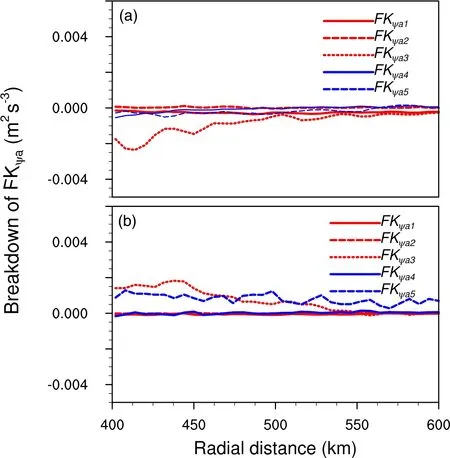
Fig.12.Radial variation of tangentially averaged partitioned components of the flux divergence of asymmetric rotational kinetic energy at (a)300 hPa and (b) 500 hPa.Units: m2 s-3.
The dominant dynamic processes associated with the increase in the symmetric rotational kinetic energy during the RI of Typhoon Rammasun (2014) are summarized in Fig.13.In the lower troposphere, the increase in the symmetric rotational kinetic energy results from the conversion of symmetric divergent kinetic energy.The conversion is caused by the collocation of strong symmetric cyclonic tangential flows and symmetric inward radial flows.The loss of symmetric divergent kinetic energy was compensated for by the transfer of potential energy through the collocation of inward decreased geopotential and prevailing inward flows.In the inner area of the typhoon (e.g., within a radius of 200 km from the typhoon center), where the maximum winds were located, the typhoon rotation was considerably larger than Earth’s rotation.As a result, strong symmetric cyclonic tangential rotational winds with symmetric inward convergent radial flows under typhoon rotation were responsible for the increase in symmetric rotational kinetic energy.In the outer area (e.g., within the radii of 400-600 km), the typhoon rotation became weak, having the same order of magnitude as the Earth’s rotation.Thus, symmetric cyclonic tangential rotational winds with symmetric inward radial flows due to typhoon and the Earth’s rotation accounted for the increase in the symmetric rotational kinetic energy.
In the upper troposphere, the upward advection of the symmetric rotational kinetic energy in the mid and upper troposphere led to an increase in the symmetric rotational kinetic energy in the inner area.The radial advection of asymmetric tangential rotational winds by radial environmental winds generates a reduction in the symmetric rotational kinetic energy in the outer area.
The results from this study showed that the low-level inflow played the following important roles during the RI of Rammasun (2014): (1) the low-level inflow did work against the outward geopotential gradient, which converted available potential energy to symmetric divergent kinetic energy; (2) the low-level inflow interacted with cyclonic flow, which converted symmetric divergent kinetic energy to symmetric rotational kinetic energy; and (3) the low-level inflow resulted in upward motion in the inner area, which transported kinetic energy from the lower troposphere to the mid and upper troposphere.
Several differences between this study and previous studies are noted.First, the analysis of symmetric divergent kinetic energy budget in this study revealed that the increase in symmetric rotational kinetic energy associated with the RI eventually resulted from the conversion from available potential energy, but the tangential momentum budget did not have any term related to the geopotential gradient.Also,the analysis of the vorticity budget did not show that thesolenoidal term associated with geopotential gradient was important in previous studies.Secondly, the winds were separated into environmental and typhoon components in this study, whereas they have not been separated as such in previous studies.Finally, this study presents a case analysis of kinetic energy budgets in inner and outer areas during RI,whereas previous studies focused on the analysis of RI mechanisms only in inner area.
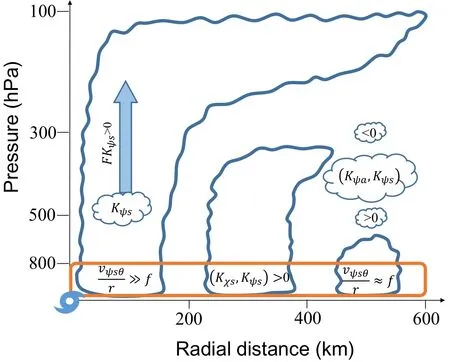
Fig.13.Schematic diagram that summarizes dominant dynamic processes associated with the change in symmetric rotational kinetic energy during the rapid intensification of Typhoon Rammasun (2014).K ψs is the symmetric rotational kinetic energy; is the conversion between symmetric divergent kinetic energy (K χs ) and symmetric rotational kinetic energy;is the conversion between asymmetric rotational kinetic energy (K ψa )and symmetric rotational kinetic energy; F Kψs is the flux divergence of symmetric rotational kinetic energy; v ψsθ is the tangential component of symmetric rotational wind; r is the radial distance from typhoon center; f is the Coriolis parameter due to the Earth’s rotation.
It should be understood that, while the kinetic energy budget analysis of rapidly intensifying TC has been conducted in this study, the analyses of slowly intensifying TCs are required to identify the dominate dynamic processes for RI in future studies.
Acknowledgements.The authors thank the Training Center of Atmospheric Sciences of Zhejiang University and two anonymous reviewers for their constructive comments and suggestions.We also thank Huiyan XU for deriving kinetic energy equations,Liguang WU and Huarui ZHAO for providing the MWT filter codes, Xinyong SHEN for improving the simulation of Typhoon Rammasun (2014), and Liangliang LI, and Chi ZHANG for valuable discussions.This study was supported by the National Natural Science Foundation of China (Grant No.41930967).
APPENDIX
Derivation of Kinetic Energy Equations
The governing momentum equation in a p-coordinate system can be written as:

Here, V [= (u, v)] is the horizontal wind vector, f is the Coriolis parameter due to the Earth’s rotation, and ϕ is the geopotential,Fis frictional dissipation, ∇ is horizontal differential operator, andkis a unit vector in vertical direction.
The winds (V) can be partitioned into environmental(Ve)and tropical cyclone (TC)components.TC winds can be separated into rotationaland divergentcomponents, which can be further separated into symmetric(Vψs,Vχs)and asymmetric (Vψa,Vχa) components in cylindrical coordinates.Thus, the wind vectors can be expressed as:

Here ψsand χsare symmetric componential of stream function and velocity potential, and ψaand χaare asymmetric componential of stream function and velocity potential.Ve,Vψs,Vχs,Vψa, andVχaare environmental wind, symmetric components of rotational and divergent wind, and asymmetric components of rotational and divergent wind, respectively.
By multiplying momentum equation (A1) with the symmetric (Vψs) and asymmetric (Vψa) rotational wind vectors and symmetric (Vχs) and asymmetric (Vχa) divergent wind vectors, respectively, the corresponding kinetic energy equations can be written as:

where
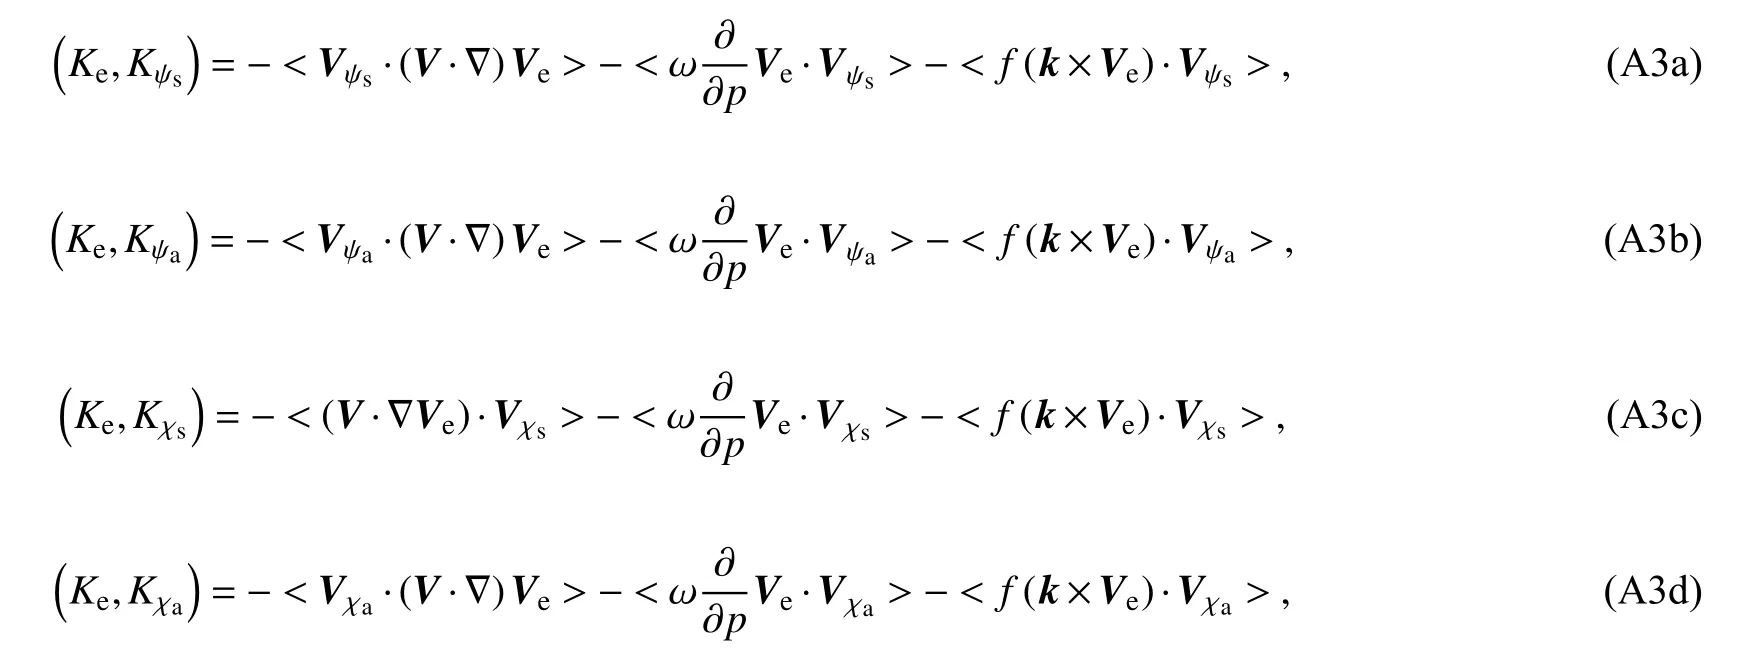
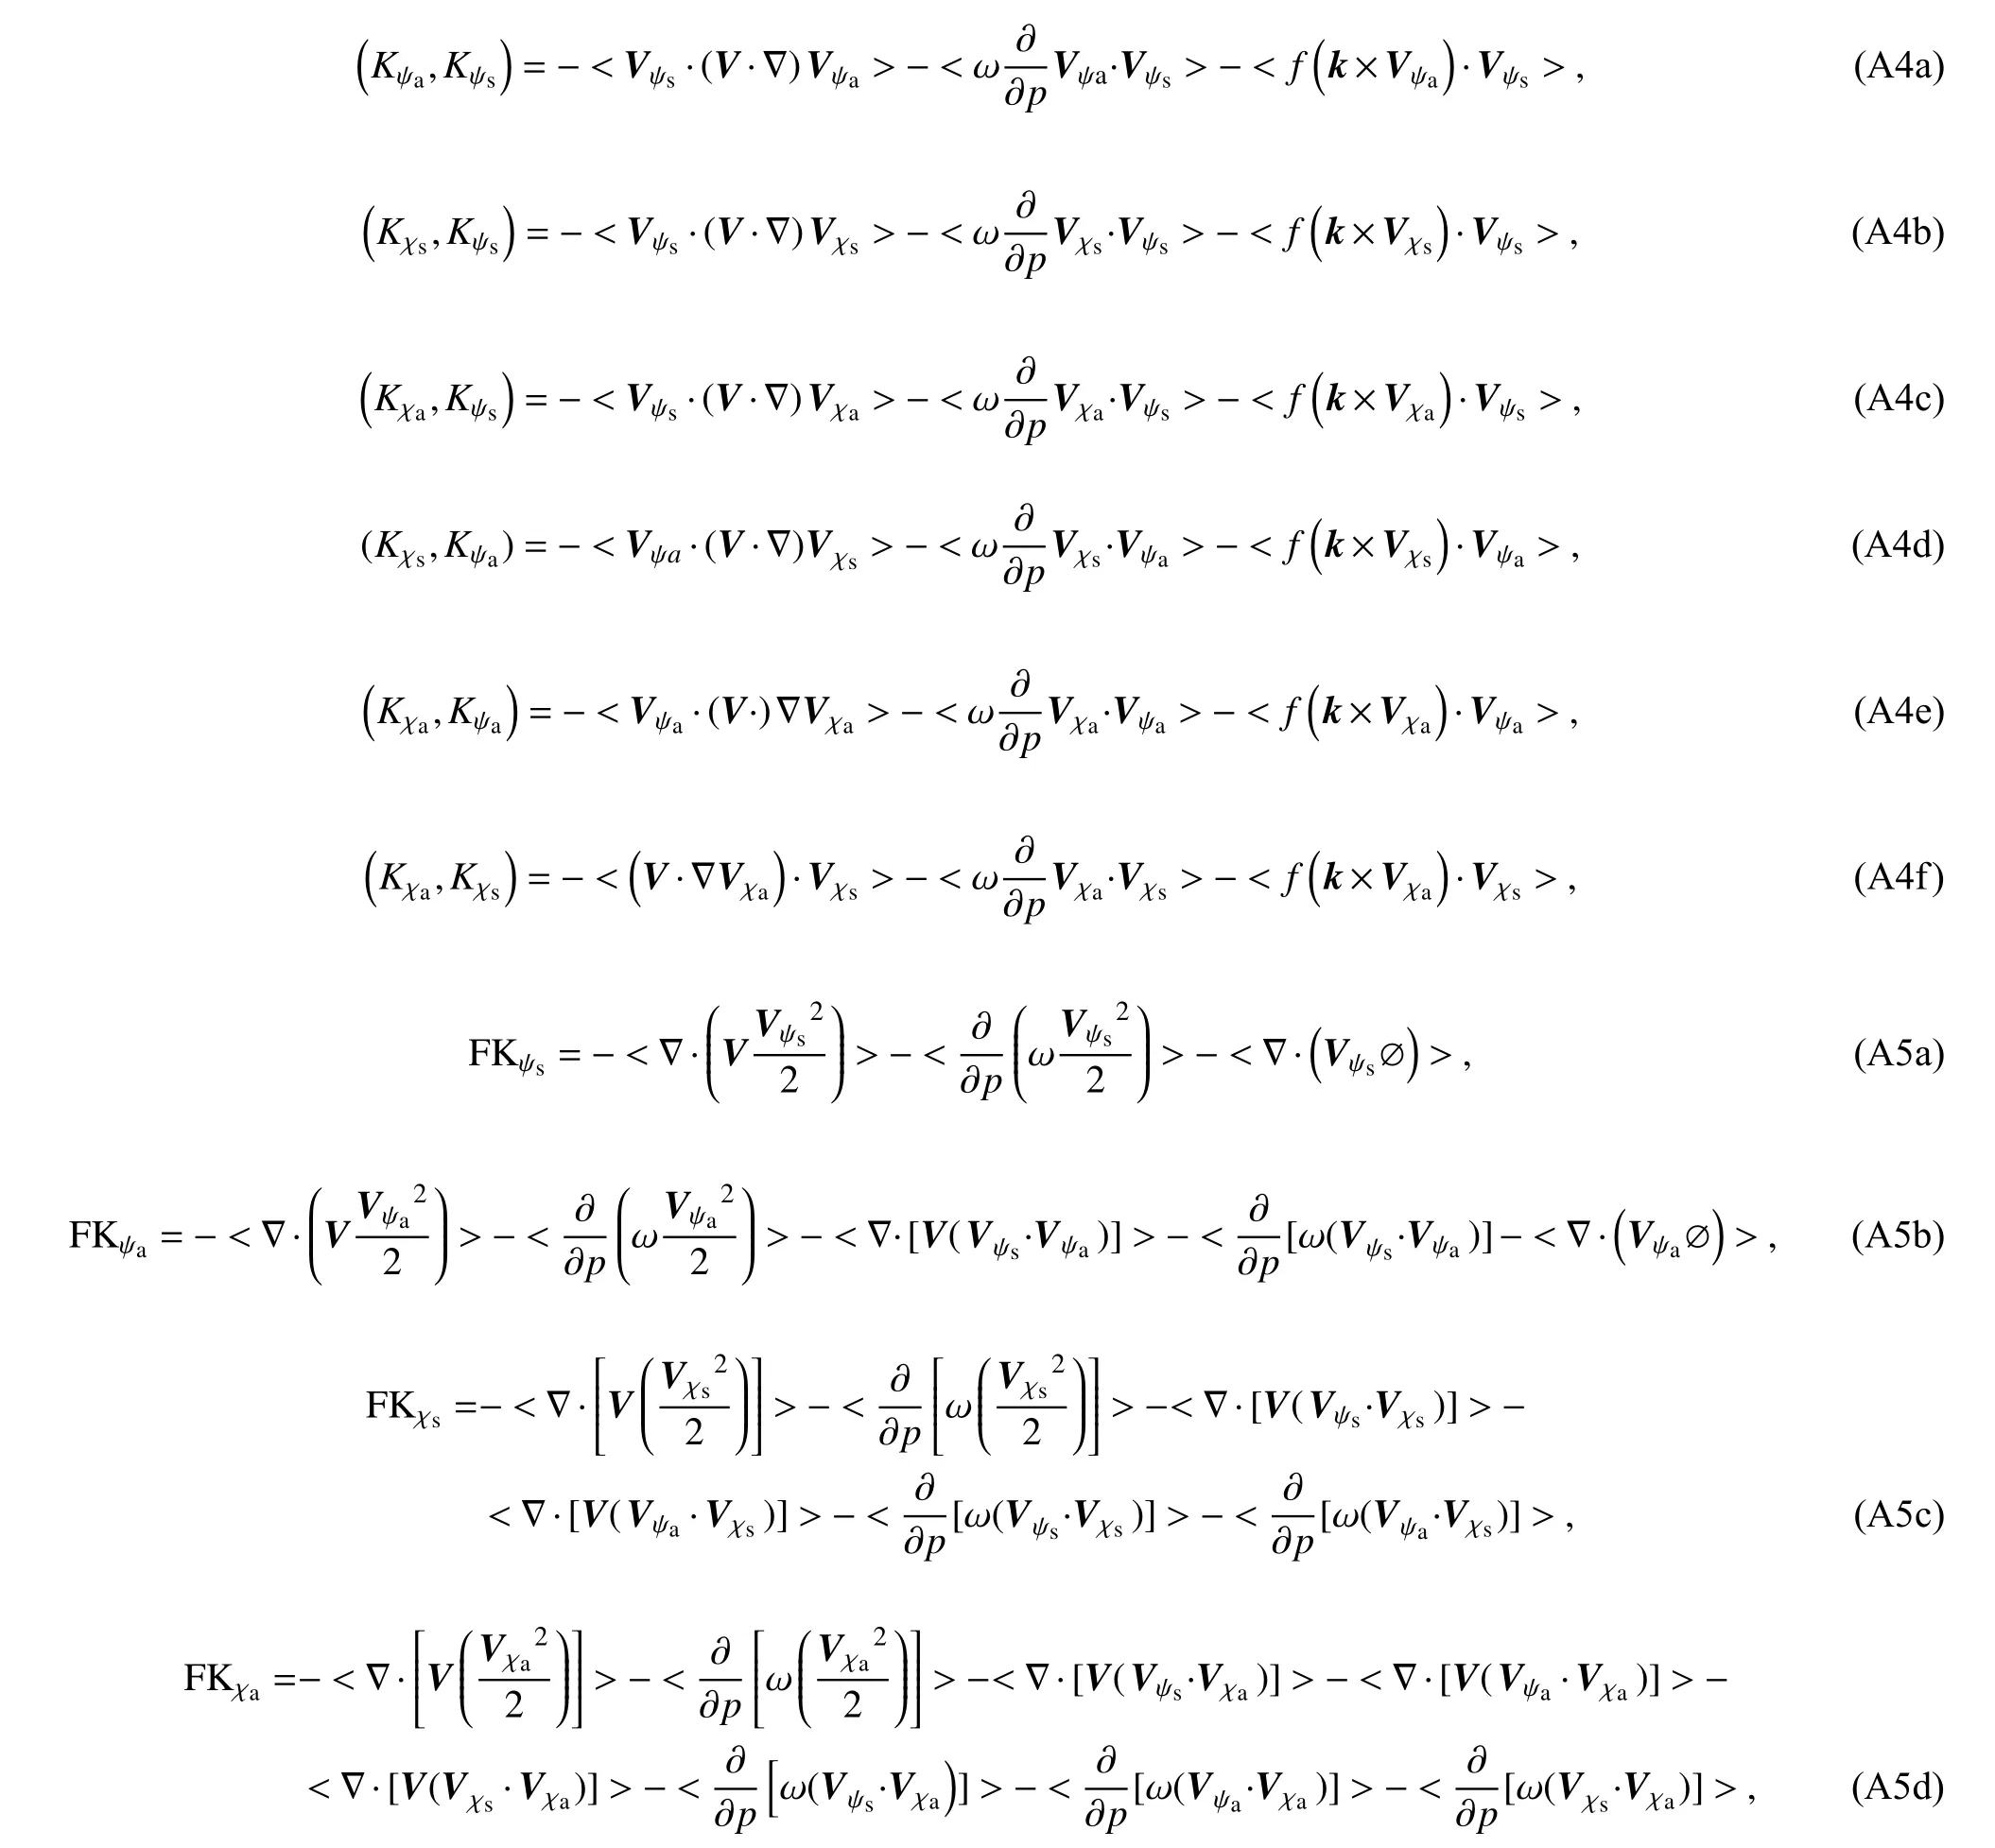
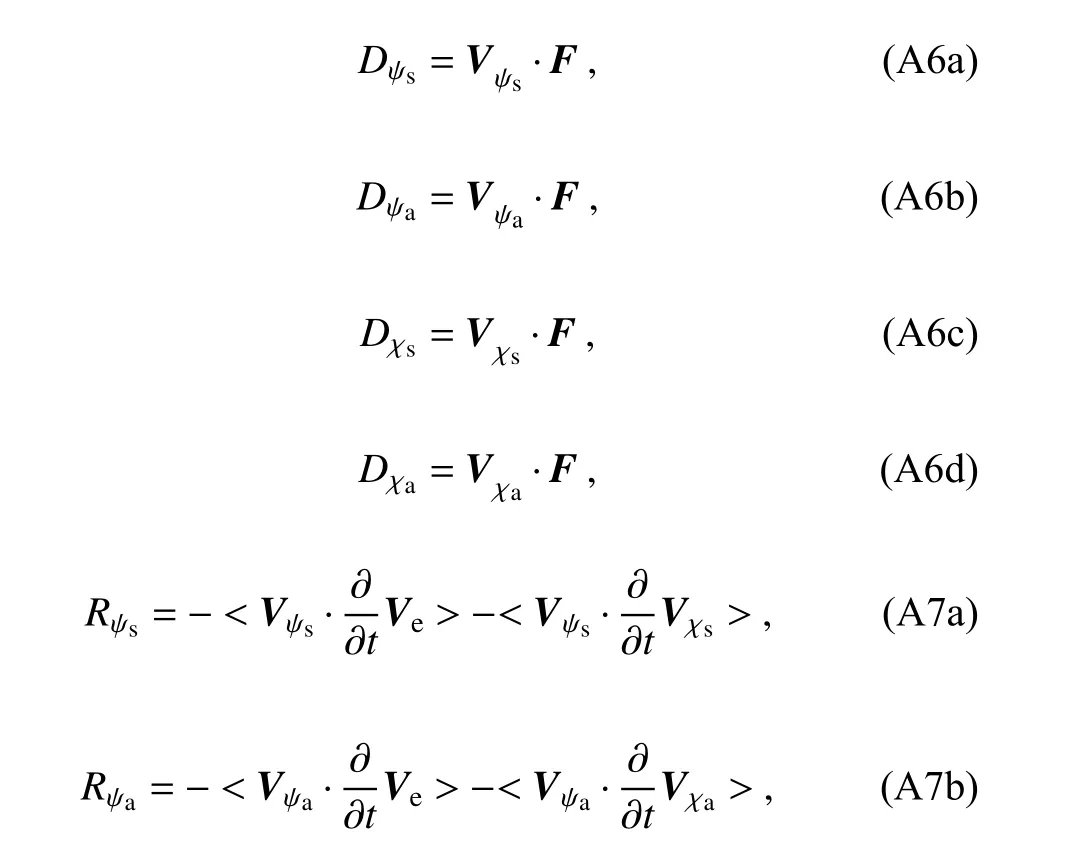
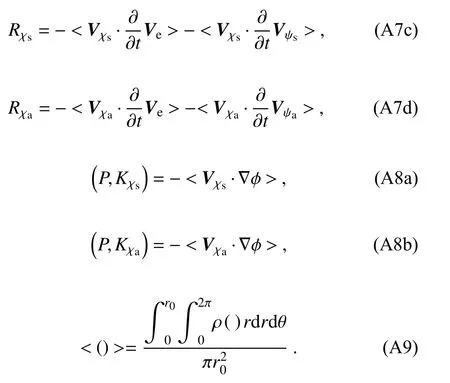
Here, D K is the kinetic energy tendency of every wind component, K and P are kinetic and potential energies,respectively, r and θ are radial distance and tangential angle,andr0is radius of circular area for average.Equations (2a-d)are budgets of symmetric and asymmetric rotational kinetic energies and symmetric and asymmetric divergent kinetic energies, respectively.Equations (3a-d) are the conversion terms from environmental kinetic energy to TC kinetic energy, Eqs.(4a-f) are the conversion terms between TC kinetic energy components, Eqs.(5a-d) are flux divergence terms, Eqs.(6a-d) are the residual terms mainly due to dissipation (Kornegay and Vincent, 1976; Sun et al., 2012;Wang et al., 2016), Eqs.(7a-d) are the correlation terms of the wind components with their tendencies.Equations (8a-b)are the conversion terms between the potential energy and divergent kinetic energy.The angle bracket represents the area average that is defined as Eq.(9).
Wang et al.(2016) derived similar kinetic energy equations for cylindrical coordinates.The differences between the kinetic energy equations in this study and those derived by Wang et al.include the following: (1) In this study, the winds are separated into environmental and typhoon components; thus, the environmental effects on typhoon intensity can be examined; however, Wang et al.(2016) did not perform this separation.(2) Our study indicates the presence of the divergence of the flux of dot product of rotational wind and symmetric divergent wind in symmetric divergent kinetic energy budget and the divergence of the flux of dot product of rotational wind and asymmetric divergent wind in asymmetric divergent kinetic energy budget [Eqs.(A5c)-(A5d)]; however, they are absent in the study by Wang et al.[Eqs.(1c)-(1d)].(3) The term R in the study of Wang et al.[Eqs.(1a)-(1d)] can be simplified to the term R in this study [Eqs.(A7a)-(A7d)].
杂志排行
Advances in Atmospheric Sciences的其它文章
- Detection of Anthropogenic CO2 Emission Signatures with TanSat CO2 and with Copernicus Sentinel-5 Precursor (S5P) NO2 Measurements: First Results
- Will the Historic Southeasterly Wind over the Equatorial Pacific in March 2022 Trigger a Third-year La Niña Event?
- Unprecedented Heatwave in Western North America during Late June of 2021: Roles of Atmospheric Circulation and Global Warming
- Evolution of Meteorological Conditions during a Heavy Air Pollution Event under the Influence of Shallow Foehn in Urumqi, China
- Assimilation of Ocean Surface Wind Data by the HY-2B Satellite in GRAPES: Impacts on Analyses and Forecasts
- The Coordinated Influence of Indian Ocean Sea Surface Temperature and Arctic Sea Ice on Anomalous Northeast China Cold Vortex Activities with Different Paths during Late Summer
