Evolution of Meteorological Conditions during a Heavy Air Pollution Event under the Influence of Shallow Foehn in Urumqi, China
2023-02-08XiaLIKemingZHAOShiyuanZHONGXiaojingYUZhiminFENGYutingZHONGAyitkenMAULENandShutingLI
Xia LI, Keming ZHAO, Shiyuan ZHONG, Xiaojing YU, Zhimin FENG, Yuting ZHONG,Ayitken MAULEN, and Shuting LI
1Institute of Desert Meteorology, China Meteorological Administration, Urumqi 830002, China
2Xinjiang Meteorological Observatory, Urumqi 830002, China
3Department of Geography, Environment and Spatial Sciences, Michigan State University, East Lansing 48823-5243, USA
4LASG, Institute of Atmospheric Physics, Chinese Academy of Sciences, Beijing 100029, China
5Urumqi Meteorological Satellite Ground Station, Urumqi 830011, China
ABSTRACT The air pollution in Urumqi which is located on the northern slope of the Tianshan Mountains in northwestern China,is very serious in winter.Of particular importance is the influence of terrain-induced shallow foehn, known locally as elevated southeasterly gale (ESEG).It usually modulates atmospheric boundary layer structure and wind field patterns and produces favorable meteorological conditions conducive to hazardous air pollution.During 2013-17, Urumqi had an average of 50 d yr-1 of heavy pollution (daily average PM2.5 concentration >150 μg m-3), of which 41 days were in winter.The majority (71.4%) of heavy pollution processes were associated with the shallow foehn.Based on microwave radiometer, wind profiler, and surface observations, the surface meteorological fields and boundary layer evolution during the worst pollution episode in Urumqi during 16-23 February 2013 are investigated.The results illustrate the significant role of shallow foehn in the building, strengthening, and collapsing of temperature inversions.There were four wind field patterns corresponding to four different phases during the whole pollution event.The most serious pollution phase featured shallow foehn activity in the south of Urumqi city and the appearance of an intense inversion layer below 600 m.Intense convergence caused by foehn and mountain-valley winds was sustained during most of the phase, resulting in pollutants sinking downward to the lower boundary layer and accumulating around urban area.The key indicators of such events identified in this study are highly correlated to particulate matter concentrations and could be used to predict heavy pollution episodes in the feature.
Key words: foehn, elevated southeasterly gale (ESEG), heavy air pollution, boundary layer structure, wind field pattern,complex terrain
1.Introduction
Foehn is a name given to strong downslope winds that are often warm and dry and usually occur on the lee side of mountains when airflow crosses mountain tops (Seibert,1990).Strong foehn can bring risks to the safety of infrastructure, transportation, etc., and contribute to the spread of wildfires (Fotini et al., 2012).Warm foehn can lead to early melting of snow on mountains, which can affect skiing as well as prompt an earlier start of the phonological cycle (Richner and Hächler, 2013; MacDonald, et al., 2018).Moreover,foehn winds have competing effects on air quality.On the positive side, foehn flows can blow away local haze andimprove the air quality (Levin et al., 2005; Holla et al.,2015).Negatively, foehn, as a kind of flow, can transport air pollutants.The Altdorf region in Switzerland, on the lee side of the Alps, often suffers from an increase in ozone concentration carried by foehn from high-altitude ozone-rich areas (Baumann et al., 2001).Furthermore, air quality becomes poor in Munich of Germany (Hoinka and Rösler,1987) and in Calgary of Canada (Nkemdirim and Leggat,1978) due to temperature inversions associated with warm foehn.In Inn Valley in Austria, there are three types of mechanisms related to the types of foehn that impact air pollution transport (Gohm et al., 2009).Thus, the effects of foehn winds on air quality are complex.
Foehn winds have been observed in the Taihang Mountains, Daxinganling Mountains, Tianshan Mountains (Pan,1994), Ailao Mountain (Zhang et al., 1993), and Xialiang Mountain (Ren, 1998) in China.Many studies on foehn in China have focused on the its formation mechanisms (Qi and Fu, 1993; Meng et al., 1996; Ren, 1998; Wang et al.,2012a), the weather and climatology (Zhang, 2007; Wang et al., 2012b; Chen and Lu, 2015; Luo et al., 2020) and the influence of foehn on agriculture (Zhang et al., 1993; Zhang and Zhang, 1996) and skiing (Kong and Lian, 2022).Now that it is understood how foehn winds influence climate, such as extreme heat waves in eastern China (Chen and Lu, 2015),and local weather (Zhang, 2007, Wang et al., 2012b), they are suspected to also have impacts on air pollution.However, the effects of foehn on air quality in China have so far not been paid much attention (Yang et al., 2018).
Urumqi, the capital city of Xinjiang Uyghur Autonomous Region of China, has been known as one of the world’s top ten polluted cities since the late 1990s (Mamtimin and Meixner, 2007).Apart from excessive anthropogenic pollutant emissions, the local topography and adverse meteorological conditions have also made contributions.Urumqi is situated on the lee side of the northern Tianshan Mountains in northwestern China (Fig.1a).Standing at the northern exit of the Middle Tianshan Mountains Valley (MTMV),Urumqi is surrounded on three sides by mountains of 1300-5000 m above sea level (ASL), with only one opening on the north side to the Junggar Basin (Fig.1b).The urban terrain slopes from southeast to northwest with an average elevation of 800 m ASL and a drop of 300-400 m.
Often in cold seasons, as cold air mass from the periphery of the Mongolian high pressure returns to the south of the Tianshan Mountains, a strong pressure gradient across the Tianshan Mountains can build up, causing airflow to pass through the MTMV and form a southeasterly gale (SEG)over Urumqi and its surrounding areas (Zhang et al., 1986;Meng et al., 1995).The SEGs, a kind of shallow foehn, can be classified into two types: ground-based SEG (GBSEG)and elevated SEG (ESEG) (Li et al., 2012, 2015, 2020).Li et al.(2020) described the characteristics of these two types of foehn winds in detail.In short, the GBSEGs can lead to strong winds both in urban areas at the surface and in southern and western suburbs, especially in spring and autumn.ESEGs, which occur up to 128.5 d yr-1with a maximum frequency of 47 days in winter (Li et al., 2020), usually split into two layers upon landing on the southern suburbs of Urumqi.The upper foehn layer spreads across the city to the northwest downwind region, while the lower foehn layer oscillates around the southern suburbs.Over the Urumqi urban area, winds are generally light or even calm (Li, 2013).
The impacts of SEGs on air quality in Urumqi are different depending on their occurrence seasons and other factors.In winter, the GBSEGs can clean out a heavily polluted air mass originally present over an urban area (Li, 2006).However, GBSEGs can sometimes result in dusty weather in Urumqi in the warmer half of the year, including summer.Observations taken during a GBSEG event on 3 April 2014 show an astonishing PM10concentration of 3720 μg m-3.Composite analyses of meteorological fields on 53 heavily polluted days in winter demonstrate that the boundary layer over Urumqi is characterized by the ESEG, which is not only favorable for maintaining a stable boundary layer, but also conducive to the accumulation pollutants due to interaction with mountain-valley winds (Li, 2013; Li et al., 2015).However, in-depth investigation into the effect of ESEG on atmospheric conditions has been lacking.
Each heavy pollution weather process must exhibit a relatively long duration in order for the pollutants to gradually pile up and reach peak concentrations.At the same time, the boundary layer structure and surface meteorological fields must also evolve step by step to eventually resemble unfavorable meteorological conditions.The composite analyses (Li et al., 2015) illustrated the typical pattern of boundary layer structure and surface fields related to heavy pollution in Urumqi, but they failed to explain the detailed situation in different stages regarding the whole heavy pollution process,which is important information for forecasters to be able to identify trends in air quality.Furthermore, is each heavy pollution event accompanied by ESEG? Which factors are effective for predicting air pollution in Urumqi? Up to now, there is no in-depth analysis of the above questions.
The aim of this paper is to present a comprehensive analysis of a heavy pollution event related to ESEGs that occurred in Urumqi during 16-23 February 2013.The observation sites and instrumentation are introduced in section 2.Section 3 describes the classification and statistics of heavy pollution events in Urumqi from 2013 to 2017.Then, the investigation of both the three-dimensional boundary layer structure and the surface meteorological fields under the influence of shallow foehn is given in section 4, and the potential forecast indicators for the development of heavy pollution events are shown in section 5.Finally, section 6 presents the conclusion.
2.Methods
2.1.Instruments and data
More than 60 automatic weather stations were established around Urumqi in 2008 (Fig.1b), providing hourly wind, temperature, pressure, humidity, and other meteorologi-cal data for the city and the surrounding areas.At the Urumqi weather station (Fig.1b), a US MP-3000A microwave radiometer and a wind profiler (CFL-03) have been in operation since 2011 (Yang et al., 2013; Li et al.,2016).The microwave radiometer can get atmospheric radiation brightness temperature through microwave signals emitting from the atmosphere.Historical radiosondes at sites representative of the observing location are used with a neural network to retrieve tropospheric profiles from the microwave,infrared, and surface meteorological measurements (Ware,2003).The retrieved temperature profiles at Urumqi station are in good accordance with the radiosonde data (Li, 2013).
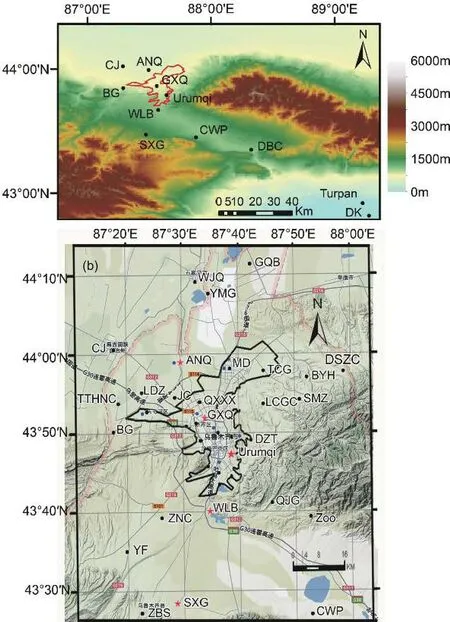
Fig.1.Topography of the Middle Tianshan Mountains (a) and location of weather stations (black dots and red five-pointed star) and atmospheric environment monitoring stations (blue dots) in Urumqi and its surroundings(b).The black solid line roughly represents the border of the Urumqi urban area.Abbreviations for stations around Urumqi in (a): CJ = Changji; ANQ =Anninqu; GXQ = Gaoxinqu; WLB = Wulabo; SXG = Shuixigou; CWP =Chaiwopu; DBC = Dabancheng; DK = Dongkan.
There were seven atmospheric environment monitoring stations in Urumqi in 2013, as marked by the blue dots in Fig.1b.The air pollution data in Urumqi were obtained from the Ministry of Environmental Protection of People’s Republic of China.The hourly average concentration of a certain type of pollutant in Urumqi is considered when observations are available from more than three stations, and the daily average concentrations are computed from more than 18 hourly averaged values.
2.2.Mixing layer algorithm
Vertical profiles of potential temperatures are obtained from the temperature data of a microwave radiometer based on the following equation (Zhang, 2003):

where T is temperature at height z,γis the dry adiabatic lapse rate of the free atmosphere (0.0098°C m-1), and h0is the local altitude (936 m ASL).The height at which the maxi-mum value of variability in the entire vertical profile of potential temperatureθis located at a certain moment is taken as the height of the mixing layer (Cimini et al., 2013).
3.Classification and statistics of heavy air pollution processes
3.1.Classification of heavy air pollution processes
The Air Quality Index (AQI), used to assess ambient air quality in China (CEA, 2016), is classified into six grades: Grade I (0-50), Grade II (51-100), Grade III(101-150), Grade IV (151-200), Grade V (201-300), and Grade VI (> 300).For many years, the primary pollutant in Urumqi has been PM2.5, especially in winter (Li, 2013).An AQI > 200 corresponds to a daily average PM2.5concentration> 150 μg m-3.In this paper, a daily average AQI > 200 defines a heavily polluted day.From 2013 through 2017,Urumqi experienced a total of 248 heavily polluted days(Table 1), with an annual average of 49.6 days, of which 40.8 days were in winter (82.3% of the whole year), 5.0 days in spring (10.0%), 0.6 days in summer (1.2%), and 3.2 days in autumn (6.5%).
Pollution in Urumqi is a result of both anthropogenic emissions related to human activities and natural emissions from sources in the surrounding desert and bare land surfaces.The timing of heavy pollution events caused by these two types of emission sources rarely overlaps.Northern Xinjiang, where Urumqi is located, is covered by snow in winter, and as a result, dusty weather is rare.However, temperature inversions with light winds are prevalent in winter,which often leads to heavy pollution events.The incidence of winter inversions over Urumqi is as high as 89% of the days, and the average inversion layer thickness is 860 m above ground level (AGL) (Liu et al., 2007; Li, 2013).Some studies have linked air quality in Urumqi to the intensity of temperature inversions in this region (Li et al., 2007,2015).Shallow foehn, which frequently occurs in winter, further strengthens the intensity and increases the thickness of the inversion layer over the city, promoting the convergence of airflows (Li, 2013; Li et al., 2015).
When cold air from the north enters Xinjiang during the warm half of the year (late spring through early fall),strong winds can lead to meso- to large-scale dust weather(Xu and Wang, 2002; Wu, 2003; Li et al., 2005; Shayiti et al., 2008), which is often referred to as northwesterlyinduced dusty weather.In addition, the GBSEG originating from the MTMV can entrain sand and dust along the way to the urban area of Urumqi, leading to southeasterly-induced dust weather, also known as GBSEG-induced dusty weather(Wang and Zhang, 2014).In contrast to these dust pollution events associated with strong winds, heavy pollution events also occur under light winds and temperature inversions with or without the occurrence of ESEG.
3.2.Statistics of heavy air pollution processes
A heavy pollution weather process is defined in this paper as the period when the average daily AQI changes from a minimum value to a peak value greater than 200,before dropping back to another minimum of less than 200.An examination of the AQI values between 2013 and 2017 yielded 70 heavy pollution weather processes in Urumqi that were distributed unevenly from one year to another(Table 2).Although only seven heavy pollution processes were recorded in 2017, one of them, with daily average AQI greater than 200 for 34 consecutive days, was the all-time record.Among the 70 total processes, 50, or 71.4%, belong to the type of light wind and inversion accompanied by ESEG.The next is the northwesterly-induced dusty weather type with 10 occurrences (14.3%).As for the other two types, the type of light wind and inversion without ESEG was experienced eight times (11.4%), while the GBSEG-induced dusty weather occurred only twice.As the predominant type of heavy pollution weather processes, the type of light wind and inversion along with ESEG warrants further investigation.

Table 1.The number of heavy pollution days in Urumqi during 2013-17.

Table 2.The occurrence number of heavy pollution weather processes in Urumqi and process classifications during 2013-17.
4.PM concentration and synoptic background
4.1.PM concentration
Figure 2a shows the variation of daily average PM10and PM2.5in Urumqi from January through February 2013.The concentrations of PM10and PM2.5in Urumqi vary synchronously, as indicated by a very high correlation coefficient of 0.985 (p < 0.01).Urumqi experienced nine heavy pollution weather processes during the two months (Fig.2a).The worst pollution event occurred over 16-23 February, with daily average concentrations of PM2.5reaching 327 μg m-3,406 μg m-3, and 266 μg m-3consecutively on 20, 21, and 22 February (Fig.2b), which fell under the highest grade(Grade VI) of air pollution in China.
According to the hourly PM2.5concentration, which varies around 150 μg m-3(AQI: 200), the whole pollution process can be roughly divided into four phases.The first phase was from 0600 Local Standard Time (LST, LST=UTC+6)16 February to 1000 LST 17 February, with an average PM2.5concentration of 81.2 μg m-3(Grade III).The second phase began at 1000 LST 17 February and ended at 0700 LST 19 February, and the average PM2.5concentration was 142.0 μg m-3(Grade IV).The average PM2.5concentration rose to 335.0 μg m-3(Grade VI) in the third phase from 0700 LST 19 February to 1500 LST 22 February.The last phase, from 1500 LST 22 February to 0700 LST 23 February, was the dying-out phase, when the average PM2.5concentration dropped rapidly down to 101.2 μg m-3(Grade III).
4.2.Synoptic background
Figure 3 illustrates the 500-hPa circulation and the sea level pressure field over Eurasia during 16-23 February 2013 after the snowfall of 1.3 mm and 0.3 mm on 15 and 16 February, respectively.A broad-500 hPa ridge extending from Siberia to the west of Xinjiang existed between 50°E and 70°E on 16 February (Fig.3a).A low pressure trough led to precipitation in Xinjiang as it moved southeastward.There was a cold air mass from the north of the Aral Sea to northern Xinjiang (Fig.3e).From 17 to 22 February, the ridge at 500 hPa almost persisted over Xinjiang (Figs.3c and 3d) and the high pressure center slowly migrated eastward to the west of Mongolia.Then, a typical pattern developed, characterized by opposite air masses to the east (cold/high) and to the west (warm/low) of Xinjiang.Such a pattern was very conducive to the returning of cold air mass from the periphery of the Mongolia high to Xinjiang (Zhang et al.,1986; Li, 2013), which in turn led to the formation of a north-south pressure gradient between the two exits of the MTMV and the development of an ESEG over Urumqi.On the night of 22 February, another cold air mass entered northern Xinjiang (Fig.3h), resulting in the disappearance of the north-south pressure gradient across the Tianshan Mountains, which further enforced the ending of the ESEG as well as the heavy pollution event.
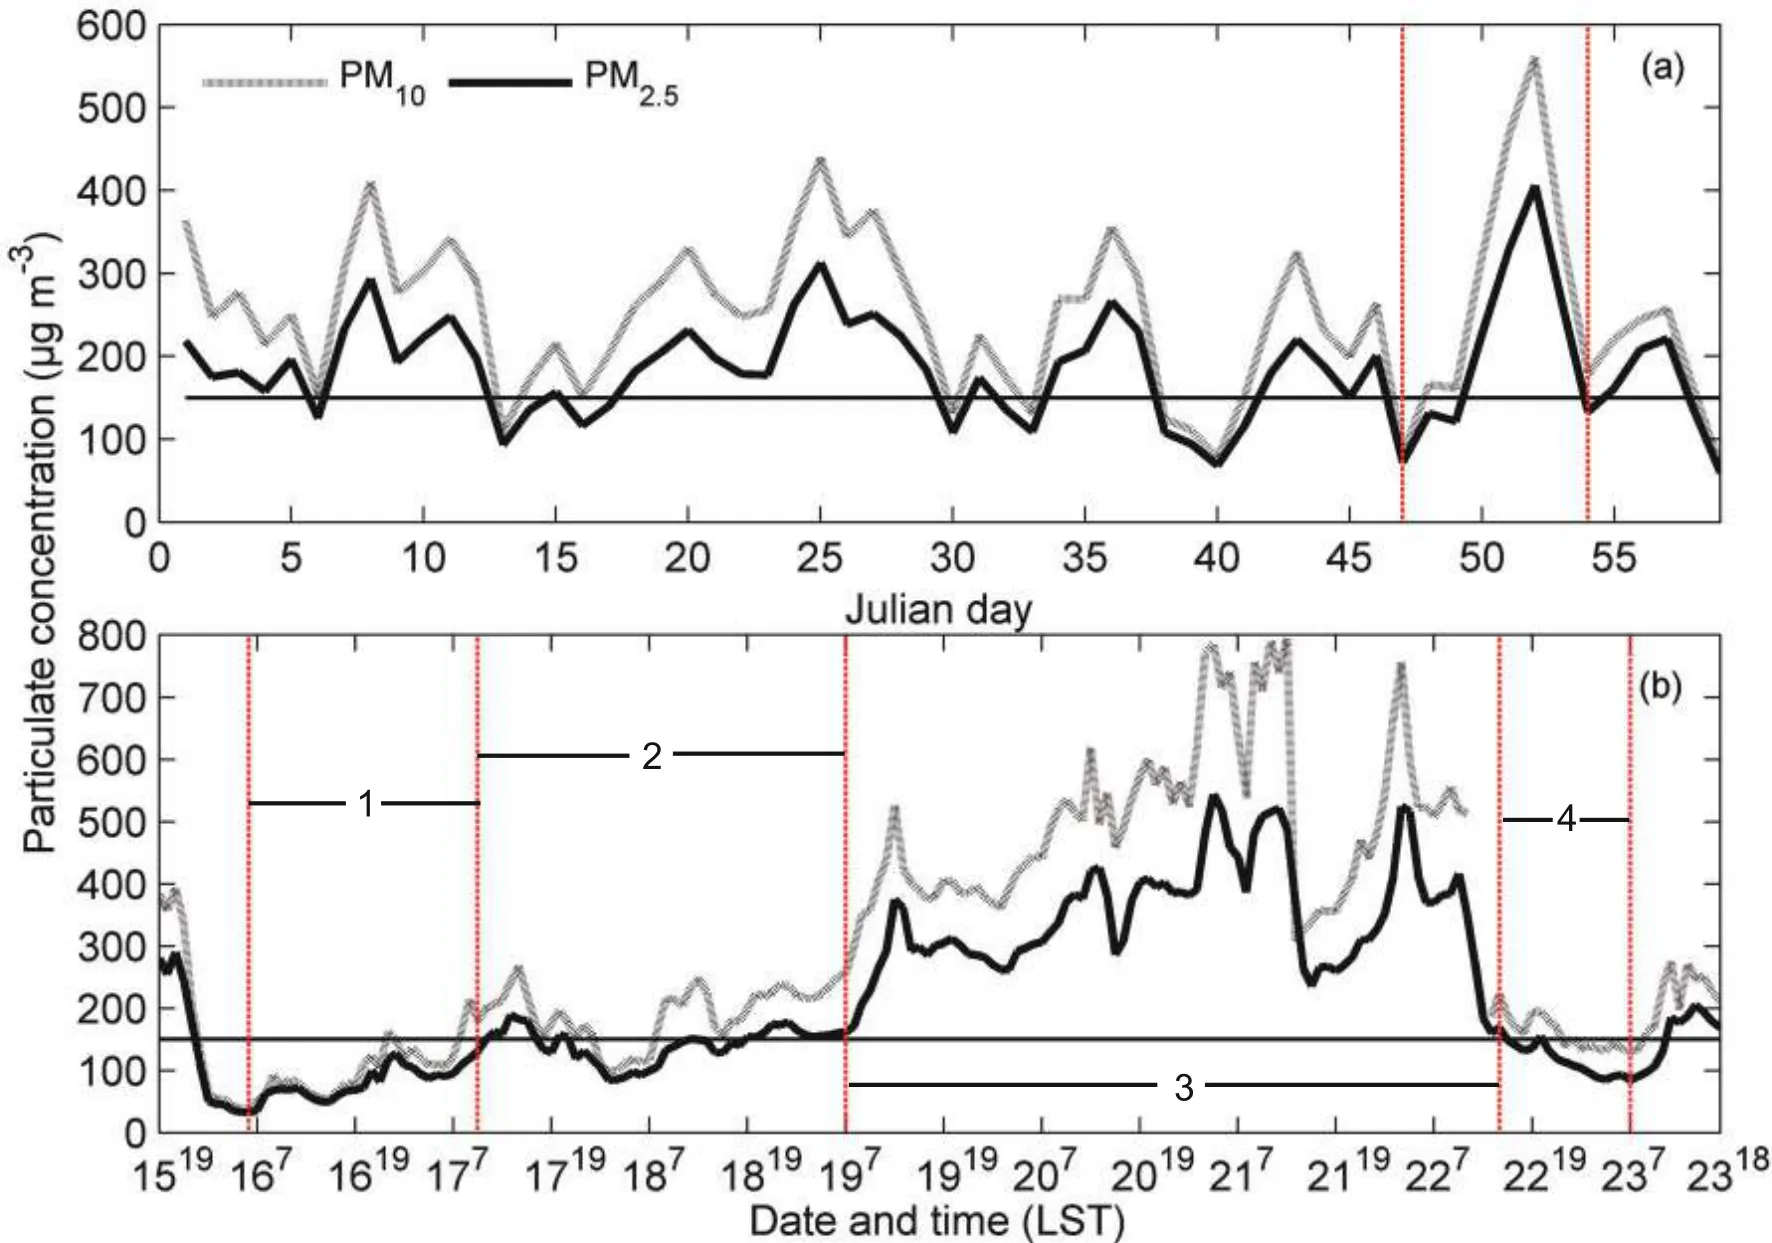
Fig.2.Variation in daily average concentrations of PM10 and PM2.5 in Urumqi from January to February 2013 (a)and changes in hourly concentrations of PM10 and PM2.5 for the period of 16-23 February 2013 (b).The red lines in(a) represent the beginning and ending times of the heavy pollution event within 16-23 February.The red lines in (b)denote the four phases of this heavy pollution event.The abscissa number represents the date, and the superscript represents the hour, hereafter.
5.Meteorological condition evolution under the influence of shallow foehn
5.1.Boundary layer structure evolution under the influence of shallow foehn
Figure 4 shows temperature, humidity, and wind evolution between 1900 LST on 15 February and 1800 LST on 23 February observed from the wind profiler and the microwave radiometer in Urumqi.At the beginning of the period, on 15 February, relatively strong northwesterly winds with a peak speed of 14 m s-1prevailed below 1800 m AGL following the passage of a trough across Xinjiang(Figs.4c and 4d).The strong wind led to the removal of the inversion layer (Fig.4a), lowering PM concentrations to a minimum of less than 100 μg m-3during the midday on 16 February.The maximum vertical wind speed rose to 0.9 m s-1, which only represented the subsidence caused bythe snow (Fig.4d).Over the next two days (16-17 February,during the first phrase), winds gradually decreased to 3-4 m s-1in the bulk of the boundary layer and less than 2 m s-1in the surface layer (Fig.4c), along with weak vertical motion of -0.2 to 0.0 m s-1.The PM concentrations gradually increased to just over 200 μg m-3.
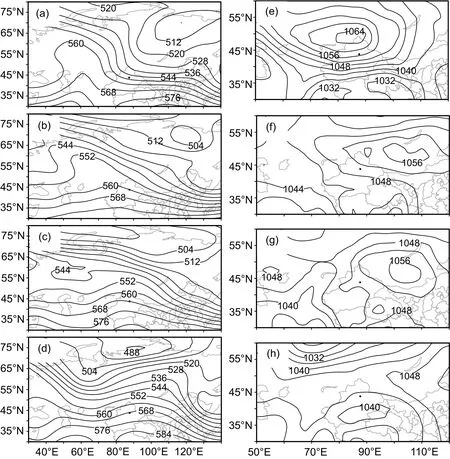
Fig.3.The circulation pattern at 500 hPa (left, units: gpm) and sea level pressure field (right, units: hPa) in February 2013, from top to bottom corresponding to the 16 February (a, e), 19 February (b, f), 21 February (c,g), and 23 February (d, h), respectively.
From the evening of 17 February until the morning of 19 February (the second phase), strong easterly-southeasterly winds up to 18.2 m s-1, representing shallow foehn,occurred between 500-1700 m above Urumqi.This elevated foehn layer was sandwiched from below by weak (< 2 m s-1)northerly winds and above by moderate (4-5 m s-1) northwesterly winds.The warm foehn resulted in the development of an elevated temperature inversion layer of 0.4°C temperature difference across a 400-m-deep layer located just above the surface-based radiation inversion layer of 400-600 m deep during the nights of 17 and 18 February (Fig.4a).This inversion was accompanied by a significant drop of 20% in relative humidity at 1000 m AGL (Fig.4b).The strength of the southeasterly foehn wind decreased gradually and even disappeared from 18 to 19 February, while the top of the inversion layer descended from 1200 m to 900 m AGL and the temperature differences across the inversion layer increased to 11°C[an inversion intensity of 2.2°C (100 m)-1] as a result of the combination of reduced mechanical mixing at lower wind speeds and continuous warm advection aloft.It is worth noting that subsidence occurred between 300-2200 m AGL with a peak speed of 0.5 m s-1during the active foehn stage,which could have driven pollutants from the upper boundary layer downward to the lower layers.During other stages without foehn, the ascending motion was very weak, with speeds of -0.2-0.0 m s-1below 1500 m AGL (Fig.4d).
Over the next two days (corresponding to the third phase), winds remained weak (less than 2 m s-1) near the surface despite the occurrence of a weak shallow foehn event with a maximum speed of 6 m s-1that lasted from 1300 LST 19 February through 1200 LST 20 February.The inversion continued to strengthen and, together with the development of a strong ground-based nocturnal radiation inversion under weak wind conditions during the night of 19 February,significantly limited mixing and allowed the PM concentration to increase to nearly 600 μg m-3.There was a drop in PM values to below 400 μg m-3following the mixing event that temporarily broke the inversion in the afternoon of 21 February.The next period, from 1800 LST 20 February to 1500 LST 22 February, was marked by another strong foehn event with wind speeds up to 17 m s-1at around 800 m AGL and a maximum descending speed of 0.7 m s-1at the same height (Fig.4d).The strong warm advection further increased the strength of the inversion, raising PM concentration again to its peak of more than 750 μg m-3.The height of the maximum foehn wind speed rose from below 1000 m to 1200-1300 m on 22 February due to the lowlevel cold air advection associated with a shortwave disturbance over Xinjiang.And, the inversion layer also was lift by the cold-air.The rise of the inversion allowed the development of the mixing layer in the afternoon of 22 February,reducing PM concentration.
The final breakup of the inversion occurred on 23 February, when strong winds close to 16 m s-1from the northwest blew cold air into the region, lowering PM concentrations to below 200 μg m-3and marking the end of this heavy pollution episode.Table 3 displays some boundary layer parameter values and maximum pollutant concentration values during the four phases of this heavy pollution event.
5.2.Evolution of near-surface meteorological conditions under the influence of shallow foehn
5.2.1.Temporal variations of near-surface conditions at different elevations
The topography around Urumqi slopes from the southeast down towards the northwest.Once foehn exits in the MTMV, it continues to blow along the valley axis towards lower elevations in the northwest.To capture the changes of near-surface meteorological conditions during the foehn episode, hourly observations from five surface stations (see Fig.1 and Table 4) close to the path of the foehn are analyzed(Fig.5).During the initial phase (0600 LST 16-1000 LST 17 February), as cold air moved into the area, there was a sharp drop of ~4°C in surface temperature at all stations.The temperature differences between stations were dominated by their elevation differences.The differences in wind speed were also dominated by elevation differences, with there being weak winds of 2-3 m s-1at Urumqi and other low-lying stations and stronger winds of 4-6 m s-1at the WLB station located near the northern end of the MTMV.The divergence/convergence field over Urumqi, estimated using wind from ANQ and WLB (Fig.1), showed weak divergence [(5.0-10.5) × 10-5s-1], which was consistent with the low PM concentration during this period in spite of the generally low wind speeds.

Table 3.Boundary layer characteristics during four phases of the heavy pollution process in Urumqi on 15-23 February 2013.

Table 4.Geographic locations and elevations of five representative weather stations around Urumqi.
During the second period (1000 LST 17-0700 LST 19 February), Xinjiang was still under the control of a high pressure system.Surface temperatures at Urumqi and other stations were lower than during the first period, but temperatures at the high-elevation station, SXQ (> 1500 m ASL), rose significantly in the latter part of the period.This increase in temperature at high elevation was a result of midlevel warming by free-atmosphere foehn and the formation of the inversion(Fig.4a).Near the surface, winds remained weak throughout this period and weak divergence [(5.0-10.5) × 10-5s-1]remained over Urumqi.
During the next phase (0700 LST 19-1500 LST 22 February), there was a steady rise in temperature at all stations, and the warming rate was at 2°C each day at Urumqi station, increasing with elevation.Near-surface winds remained low (~2 m s-1) at all stations except at WLB,where strong southerly foehn winds developed, and surface wind speed increased rapidly to 14.8 m s-1around 2100 LST on 21 February.Surface temperature at WLB also increased.It went from a low of -23.8°C at 0700 LST 19 February to a maximum of 2.9°C around 1300 LST 21 February, anincrease of 27°C in just two days.Meanwhile, the rise in temperature at Urumqi station was only 10°C.The differences in the wind speeds between the upstream station (WLB) and the downstream station (ANQ) relative to Urumqi suggested a strong convergence of the flow field in the area, with a maximum value of -21.0 × 10⁻⁵s-1.The converging flow,in combination with a strong inversion as suggested by the increase in surface temperature with elevation, explained the rapid increase in the PM2.5and PM10concentrations to 522 μg m-3and 794 μg m-3, respectively, by the end of this period.
The final phase (1500 LST 22 - 0700 LST 23 February)was marked by a weakening of the pressure gradient across the Tianshan Mountain Range.The breakup of the temperature inversion was indicated by the merging of surface temperature time series from stations of different elevations.The flow field in Urumqi changed from convergence to weak divergence.Despite the collapse of the inversion, surface wind speeds were still low, causing pollutants to meander around the region.
5.2.2.Surface wind patterns under the influence of foehn
Located near the northern exit of the MTMV, Urumqi is influenced by mountain-valley winds during 67% of the days in a year.In winter, northerly valley winds usually occur between 1100 LST and 1700 LST, while southerly mountain winds typically appear between 2100 LST to 0800 LST (Lv et al., 2016).This diurnal wind oscillation interacts with the shallow foehn, making wind patterns in the region highly complex during foehn episodes (Figs.6 and 7).During the first phase (0600 LST 16 - 1000 LST 17 February), as cold air moved in from the northwest, surface winds were generally from the north and northwest.At higher-elevation (> 1400 m ASL) stations, northerly valley winds during the day (Fig.7a) changed to southerly mountain winds at night (Fig.6a).Weak northerly wind (< 2 m s-1) was blocked by surrounding terrain, allowing pollutants to accumulate.
During the second phase of the pollution episode(1000 LST 17 February - 0700 LST 19 February) (Figs.6b and 7b), mountain-valley winds prevailed and the surface layer was decoupled from layers aloft by the formation of the inversion.The northerly valley winds started to develop around 0900 LST 17 February, reaching peak speed (3 m s-1)around 1300 LST at Urumqi station.The mountain (or downslope) winds started to develop around 1900 LST at higher elevations, and these southerly mountain winds were opposing the northerly valley winds at lower elevations, leading to convergence, which was particularly evident in areas north of the SXQ station.Another convergence area near GXQ station was enhanced by the urban heat island effect.A shallow foehn, which was first identified above 500 m (AGL) by the wind profiler around 1900 LST 17 February, penetrated down to the surface seven hours later around 0200 LST 18 February.The foehn wind speed was about 6 m s-1at the CWP station, and it continued until about 1400 LST 18 February.Northerly valley wind to the north of WLB met with southerly foehn winds to the south of the station, producing a convergence zone between WLB station and CWP station that lasted until the mountain winds overwhelmed the foehn winds.Convergence reappeared after 2000 LST over the urban areas and persisted for 12 hours.The convergence resulting from the weak mountain winds (< 1 m s-1) and relatively strong foehn winds (6 m s-1), the weak inversion, and the urban heat island effect were all in favor of further accumulation of pollutants.
During the third phase of this episode (0900 LST 19-1500 LST 22 February) (Figs.6c and 7c), as theincrease of foehn winds further strengthened the inversion,surface winds in Urumqi decreased substantially to nearcalm conditions at the five urban stations around 0200 LST 21 February.The weakening of winds was accompanied by an increase in convergence in the urban area.The shallow foehn re-appeared later in the day with the foehn front reaching the WLB station.Both the temperature (-4°C to -11°C) and wind (2-4 m s-1) in areas south of WLB were higher than the temperature (-16°C to -25°C) and wind(< 1.2 m s-1) in the urban area.Strong convergence appeared around 1400 LST resulting from the opposing valley wind and foehn wind.As the northerly valley wind sped up,the foehn front retreated to areas south of WLB.The south of the urban area continued to warm as the foehn strengthened during the night of 21 February, enhancing the convergence in the south of the urban area and around the WLB stationuntil around 1200 LST 23 February.The strong convergence and weaker winds drove pollutants to meander and accumulate.
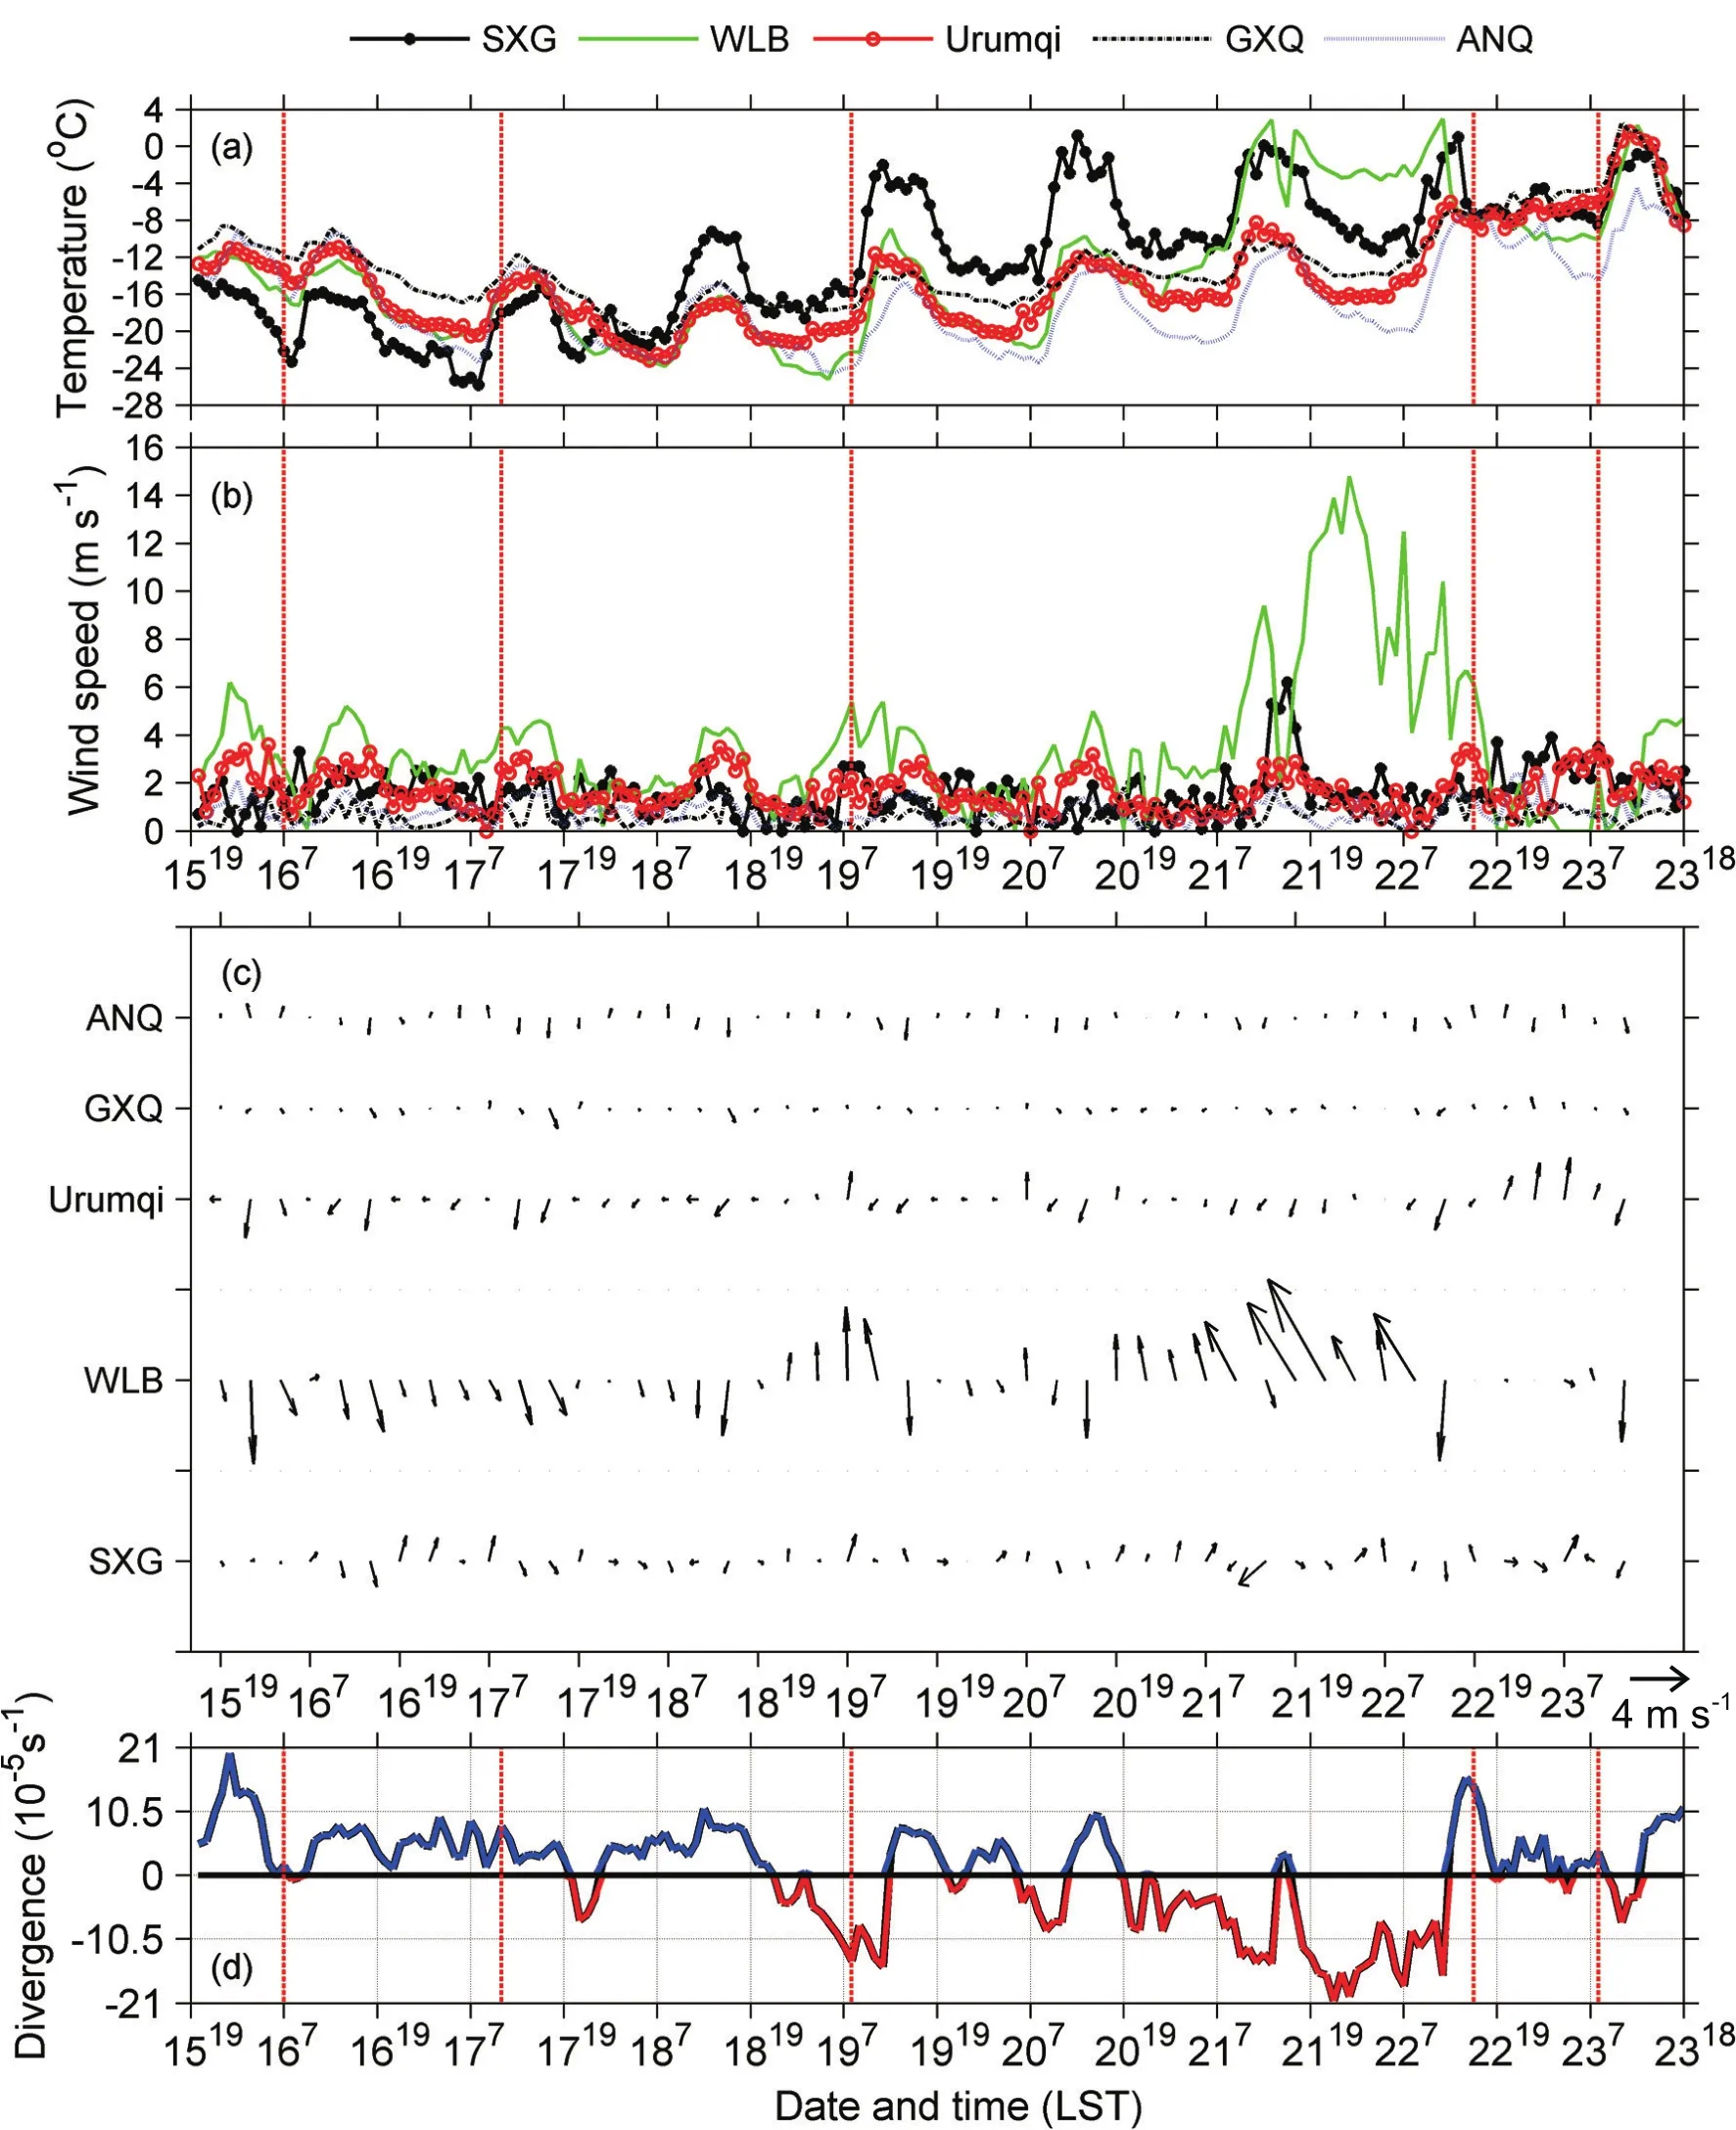
Fig.5.Evolutions of surface meteorological parameters around Urumqi for the period 1900 LST 15-1800 LST 23 February 2013.(a) temperature, (b) wind speed, (c) wind vector, (d) divergence of wind speed components from WLB to ANQ (the blue lines denote positive value and red lines are negative value).The red dashed lines are similar to Fig.2b.
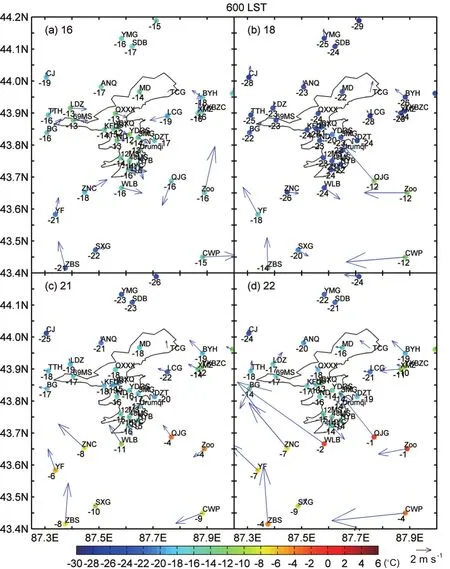
Fig.6.The surface wind and temperature (colored dots) fields around Urumqi at 0600 LST on 16 February(a), 18 February (b), 21 February (c), and 22 February (d) 2013.
The surface wind field during the final phase of the episode (1500 LST 22-0700 LST 23 February) (Figs.6d and 7d) was marked by northwesterly surface winds that began at the northern stations around 1400 LST 22 February and gradually extended southward.The foehn winds completely disappeared around 1800 LST 22 February.The removal of the inversion caused surface temperatures in the urban area to rise during the day, with the afternoon temperatures being higher than those during the previous days.The northwesterly surface winds transported pollutants downwind, leading to greatly improved air quality in Urumqi.
The following summarizes the surface wind patterns during this heavy air pollution episode.The initial phase featured cold air advection.Northerly winds occurred across most of the low-elevation areas, and diurnal mountain-valley winds appeared only at higher elevations.The second phase was marked by the initial appearance of a shallow foehn and development of an inversion.The foehn winds did not penetrate down to the surface in the southern suburbs, and the windfield in the urban area reflected the influence of diurnal mountain-valley winds and weak convergence enhanced by the urban heat island effect.During the third phase, the shallow foehn front propagated further northward and penetrated down to the surface just south of the Urumqi city.The foehn winds and diurnal mountain-valley winds led to persistent convergence, which, combined with the intensification and lowering of the inversion layer, accelerated the accumulation of pollutants and worsened air pollution.The final phase of the heavy pollution episode was characterized by the removal of the inversion as a result of relatively strong northwesterly winds and cold air invasion into the region.
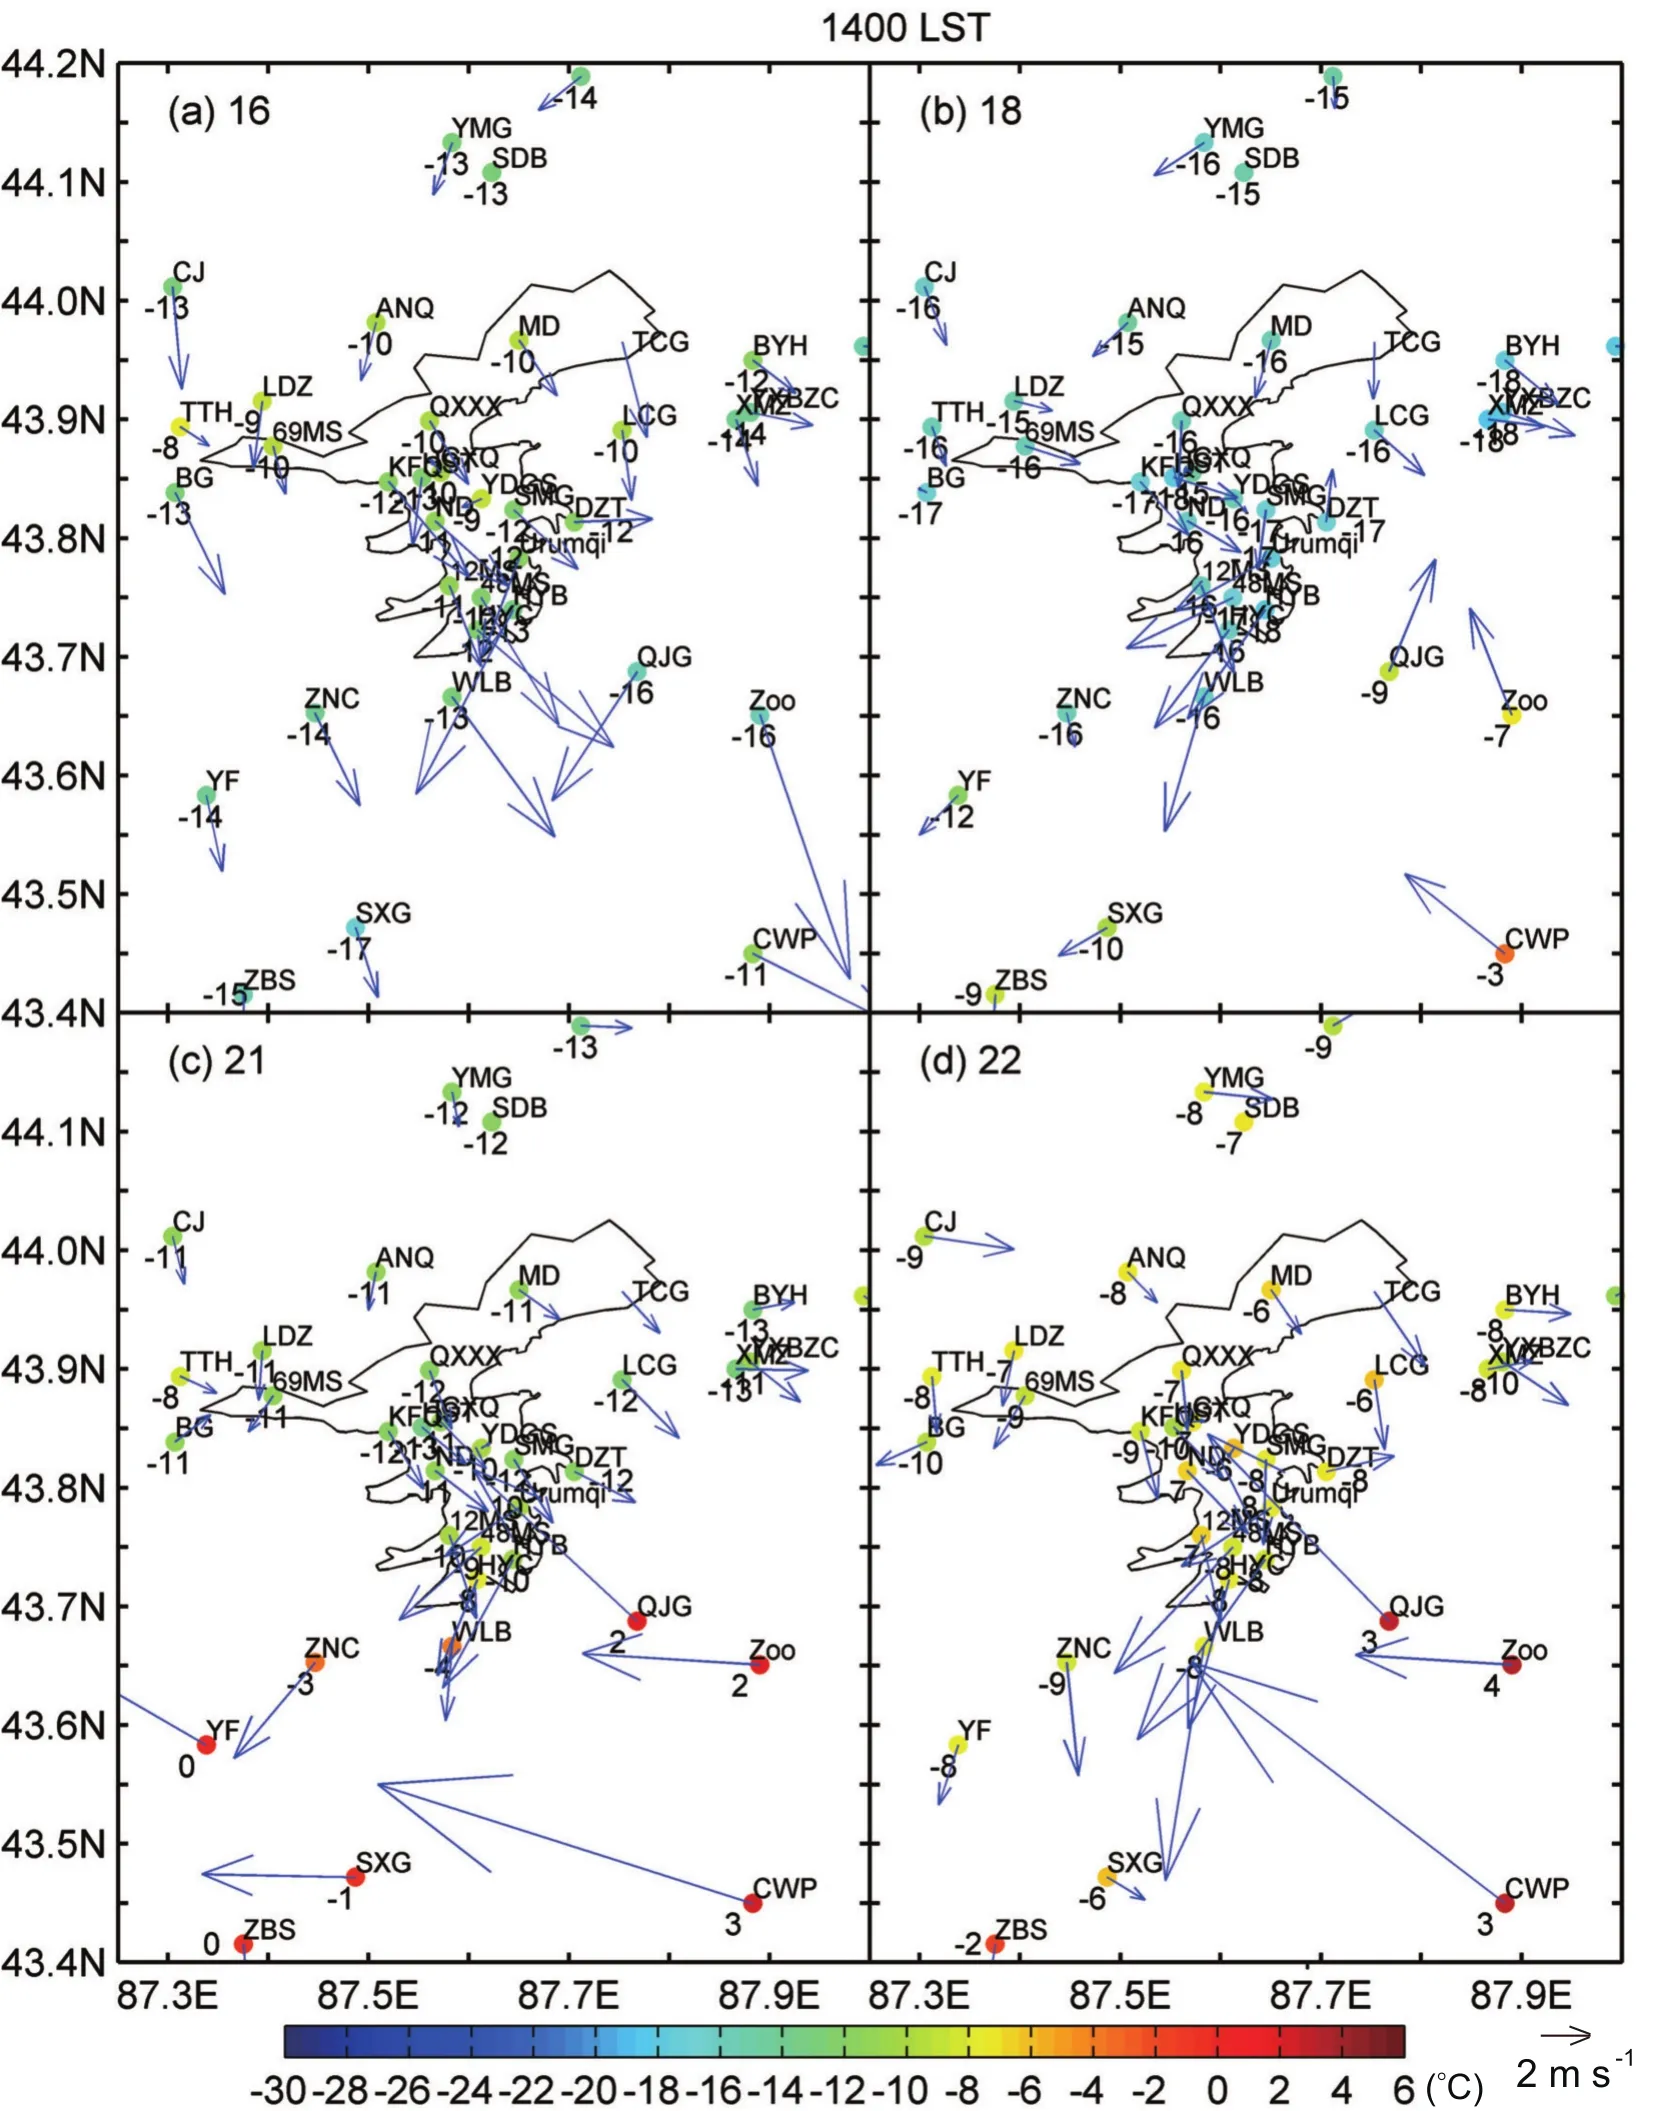
Fig.7.The surface wind and temperature (colored dots) fields around Urumqi at 1400 LST on 16 February(a), 18 February (b), 21 February (c), and 22 February (d) 2013.
6.Forecast indicators
The results above show that temperature inversion and wind field patterns play key roles in the development of heavy pollution episodes in Urumqi during the winter season.Three parameters are used to characterize temperature inversions, namely, temperature at the top of the inversionlayer, temperature difference between the top and bottom of the inversion layer, and the temperature gradient across the inversion layer (the intensity of inversion layer).In addition to an inversion, convergence over the urban area caused by opposing wind directions between the diurnal mountain-valley winds and the foehn winds also helps to accumulate pollutants.The convergence can be estimated by the north-south wind vectors between the WLB and ANQ stations.Both the inversion strength and the surface convergence are closely related to the evolution of the north-south pressure difference across the Tianshan Mountains (Zhang et al., 1986; Li et al.,2012, 2020), which can be estimated using sea level pressure observations from the WLB station and the DK station in the Turpan Basin on the south side of the Tianshan Mountains(Fig.1).
The PM2.5concentration at Urumqi during this episode had a strong relationship with the three inversion parameters, with correlation coefficients of 0.61, 0.55, and 0.60 for inversion top temperature, temperature difference across the inversion layer, and temperature gradient, respectively.The PM2.5concentration is negatively correlated to the convergence/divergence indicator (-0.50), the regional pressure difference (-0.56), and the mixed layer height (-0.42).Table 5 presents the correlation coefficients between the above parameters.

Table 5.Correlation coefficients between temperature inversion, north-south divergence, and air pressure difference and PM2.5 concentration in Urumqi on 16-23 February 2013.
Similarly, the AQI values also exhibit strong relationships with these indicators.Among them, the temperature at the top of the inversion layer along with the surface pressure difference (Fig.8) appear to be the best indicators.A careful examination of the scatter plots reveals three zones that match with the three grades of air pollution.For instance,when AQIs are lower than Grade IV, the corresponding north-south surface pressure difference varies between 10 hPa and 15 hPa, while the temperature at the top of the inversion layer is between -20°C and -16°C.For AQIs in Grade IV, the pressure difference is 4-10 hPa and the temperature at the top of the inversion layer is -14°C to -10°C.High AQIs above Grade V correspond to pressure differences between -7.5 hPa and 10 hPa and inversion top temperature between -10°C and 0°C.More wintertime data are necessary to confirm these relationships and develop better indicators for predicting heavy pollution events.
7.Conclusions
The air pollution in Urumqi is very serious in winter,owning to its high emissions both from anthropogenic sources and natural sources, as well as its geographic location surrounded by mountain on three sides.In particular, the influence of terrain-induced shallow foehn, known locally as elevated southeasterly gale (ESEG), is very remarkable.The analyses of multiyear air quality and meteorological data have shown that Urumqi has 50 d yr-1of heavy pollution on average, with 41 days being in winter and 71.4% of heavy pol-lution processes being accompanied by an ESEG or shallow foehn.
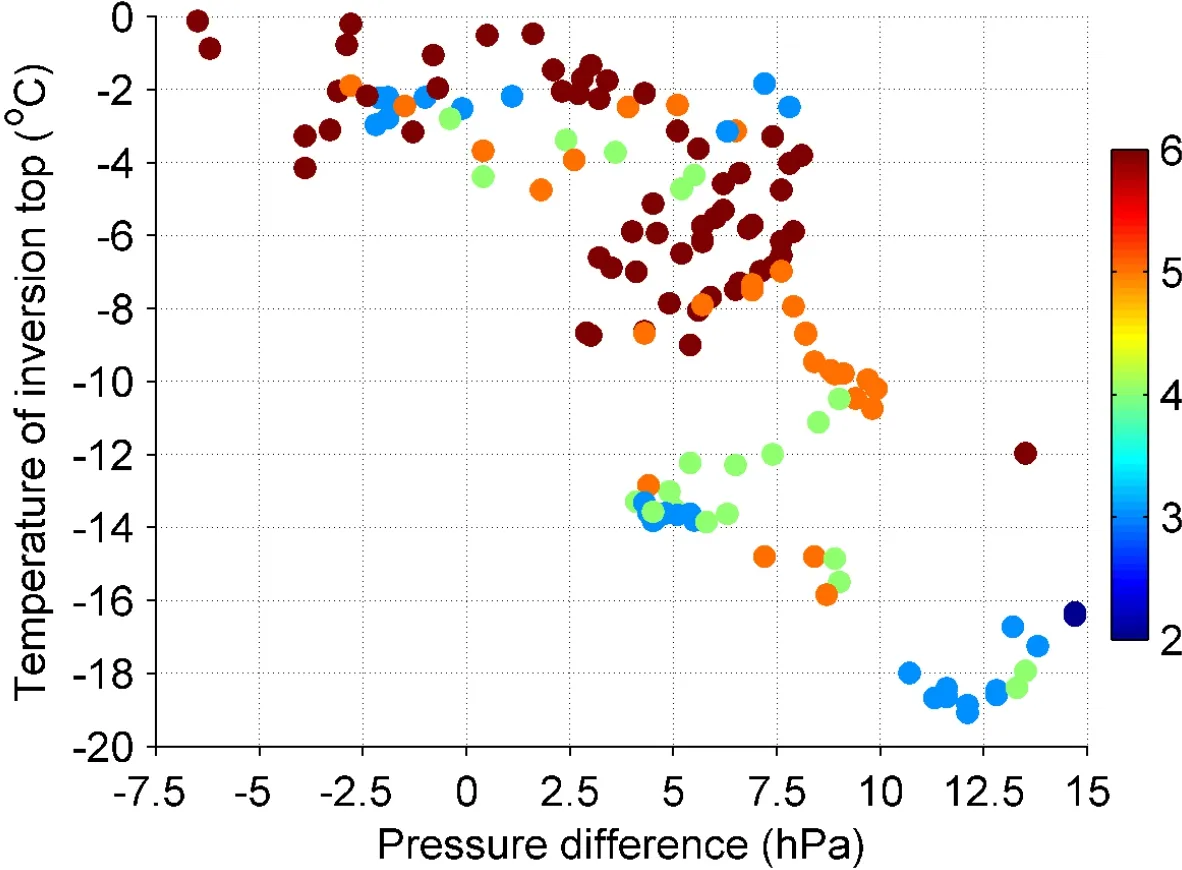
Fig.8.The scatter diagram of air quality index under the combination between temperature at the inversion layer top and pressure difference across the Tianshan Mountains from 15 to 23 February 2013.
Using a suite of boundary layer and surface observations, the surface and boundary layer evolutions during one of the worst pollution episodes in Urumqi (16-23 February 2013) were examined in great detail.The week-long episode contained three occurrences of shallow foehn with different strengths.These three foehn events coincided with the establishment, strengthening, and collapsing of the temperature inversions.The varying heights of the foehn jet corresponded to the ascent and descent of the top of the inversion layer, which affects the inversion strengths.
During this heavy pollution process, there were four phases of wind field patterns.The initial phase was characterized by weak northerly winds across most of the low-elevation areas and no inversion.The diurnal mountain-valley winds prevailed from low to high elevations along with weak inversion intensity (< 11.2°C) during the second phase.Although the shallow foehn appeared, it only influenced the region south of WLB station.During the third phase, the shallow foehn front propagated further northward and to the surface just south of the Urumqi city.The strong convergence caused by foehn and diurnal mountain-valley winds persisted during most of this stage, while the temperature inversion also reached its peak intensity with a temperature difference of 19°C across the inversion layer.The final phase was characterized by the removal of the inversion and strong northwesterly winds.
The statistical results illustrate the significant positive correlations between hourly PM2.5concentrations and inversion parameters, i.e., the temperature on the top of the inversion layer, the temperature difference between the top and bottom of the inversion layer, and the temperature gradient across the inversion layer.A significant negative correlation is also found between the hourly PM2.5concentrations and the divergence/convergence index estimated using wind vectors from surface stations.The best predictors for an air quality index appear to be the temperature at the top of the inversion layer and the surface pressure difference across the Tianshan Mountains.
Acknowledgements.This study is supported by Central Scientific Research and Operational Project (IDM2020001), National Natural Science Foundation of China (Grant No.41575011), and China Desert Funds (Sqj2017013, Sqj2019004).The authors would like to acknowledge Prof.Hua LIU, CMATC, for her advice and English language polishing.
杂志排行
Advances in Atmospheric Sciences的其它文章
- Detection of Anthropogenic CO2 Emission Signatures with TanSat CO2 and with Copernicus Sentinel-5 Precursor (S5P) NO2 Measurements: First Results
- Will the Historic Southeasterly Wind over the Equatorial Pacific in March 2022 Trigger a Third-year La Niña Event?
- Unprecedented Heatwave in Western North America during Late June of 2021: Roles of Atmospheric Circulation and Global Warming
- Assimilation of Ocean Surface Wind Data by the HY-2B Satellite in GRAPES: Impacts on Analyses and Forecasts
- The Coordinated Influence of Indian Ocean Sea Surface Temperature and Arctic Sea Ice on Anomalous Northeast China Cold Vortex Activities with Different Paths during Late Summer
- Kinetic Energy Budgets during the Rapid Intensification of Typhoon Rammasun (2014)
