Study on Loss Quantitative Analysis Methodology for Highly-loaded Transonic Fan*
2023-01-29LiangyeLiuWeilinYi
Liang-ye Liu Wei-lin Yi
(Beijing Institute of Technology)
Abstract:Turbofan engine is very important for civil aviation.The fan as a crucial component,its internal flow mechanisms is more complex and the loss mechanisms analysis is more difficult with the demand for greener,more efficient aircraft engines.In this paper,taking Rotor67,a high-load fan rotor,as the research object.Using the physical characteristics of the fluid in the computational fluid dynamics (CFD) results,the losses are divided into five loss regions: shock loss,boundary layer loss,tip clearance leakage loss,corner separation loss and wake loss.Each region is defined by the flow physics in the CFD results combined with geometrical locations.Three operating conditions of design point,near stall point and choke point are taken into account,and the loss of each loss zone is quantified by using the entropy rate analysis theory,which provides a basis for the loss analysis of transonic fan and blade optimization.
Keywords:High Load Fan;Loss Generation;Entropy Production;Computational Fluid Dynamics(CFD)
1 Introduction
As an important component of turbofan engine,the internal inverse gradient of pressure flow in fan is more difficult than the favorable pressure gradient flow in turbine.Researchers have been analyzing its internal flow pattern and loss mechanism to optimize the design and improve efficiency all the time.The goal of Green Aviation puts forward higher requirements for fan design.Higher design thermal efficiency requires a higher pressure ratio of fan[1].The lightweight target requires the use of the shorter inlet,which intensifies the fan inlet distortion [2].Advanced aviation technology,such as BLI technology,causes strong inlet distortion of fan [3].These make the internal flow of the fan more complex and the design more difficult.Therefore,a complete and universal loss analysis method is helpful to the optimal design of fan blades.
The traditional internal loss analysis of turbomachinery uses the semi empirical formulas most[4],the reason is that it is easy to calculate it from cascade test data.A more useful loss coefficient for design purposes is the energy or enthalpy loss coefficient[5].In recent years,a method based on entropy production analysis has been gradually developed for the quantitative calculation of turbomachinery losses.Kock and herdig [6] carried out Reynolds averaging on the entropy transport equation and proposed an entropy production loss model that can be used for CFD calculation,which provides a theoretical basis for the application of entropy production calculation in turbomachinery.On this basis,Zhang Lei et al.[7] used the entropy production method to calculate the losses of centrifugal fans under design conditions,stall starting conditions,stall development conditions and two stall conditions with different throttling coefficients,and explore the loss changes at different positions during the stall process of centrifugal fans.Mahmood et al.[8] taking the axial compressor as the research object,calculated the entropy production at different geometric positions in the rotor fluid domain.Optimize leaf geometry with the goal of reducing entropy production.Scholars from the school of Mechanical Engineering of Xiangtan University[9]used the entropy production analysis method to explore the losses in the radial flow turbine of the Organic Rankine Cycle,analyze the main loss areas of the rotor and stator,and explore the loss changes under the tip clearance and different mixing ratios of organic working medium.Zhang Yuanhao et al.[10] used entropy production analysis theory to calculate the loss of fixed geometric position of vertical mixed-flow pump under different flow angle conditions.An Yu et al.[11-12] explored the details of losses in Francis turbine with the entropy production analysis theory,and compared with the experiment data to verify the accuracy of the entropy production analysis method.Chengshuo Wu et al.[13] used the entropy production contour to characterize the loss source of the centrifugal pump,and calculated the entropy production.Taking reducing the entropy production of the secondary flow as the optimization goal,the design efficiency has improved.
In addition to divide the geometric positions of different losses according to experience,the loss area is judged by flow visualization method makes the quantification of loss more accurate.GrüBel,Marius et al.[14]used the flow characteristics of fluid to divide the loss of low-pressure steam turbines into boundary layer loss,shock wave loss,wake mixing loss and phase change loss,calculated the change of entropy flow through each single grid region,and quantitatively characterized the loss with entropy production coefficient.Li,Hui et al.[15]defined tip clearance flow withQcriterion,analyzed tip clearance leakage loss of high pressure turbine rotor with visualization method,analyzed and compared the capture effect of URANS and DDES turbulence models on tip clearance leakage loss with entropy production analysis.Saito et al.[16],taking the two-stage transonic axial compressor as the research object,used the full-annulus and full stage grid method,divided different loss types with the flow visualization post-processing,and calculated the loss in combination with the entropy production analysis method.
In the above work,most of the loss division methods divide the loss area according to the geometric position of the loss.This method divided all areas inside the turbomachinery into a certain loss type.However,the geometry of different loss areas is not regular,and the loss areas are also changing with the increase of flow complexity.Therefore,on this basis,Zhang,Luying et al.[17] proposed the method of describing the characteristics of flow phenomenon to delineate the loss area.According to the physical characteristics of different flow patterns,the losses in centrifugal compressors are divided into skin friction,secondary flow,tip clearance vortex and shock wave.The entropy production of each loss area is calculated,and the design optimization is carried out with this as the goal.As long as the flow characteristics of different losses are known,this method can be described in CFD post with programming language,and the specific geometric area can be defined,which makes the method more general approach and applicable to different machine types.
In this paper,taking NASA rotor67 as the research object,also uses the physical characteristics of fluid flow to delimit the loss area,and divides the loss inside the fan into boundary layer loss,shock wave loss,corner separation loss,tip clearance loss and wake loss.The entropy production under near stall condition,peak efficiency condition and choking condition is calculated and analyzed.It provides basis for flow loss analysis and optimization design of high load ratio fan.It is found that the proportion of shock wave loss is less than 2%in the three working conditions.As the working condition changes from near stall point to choking point,the shock wave loss gradually decreases,and various loss areas move to the trailing edge,resulting in an increase in the proportion of wake loss.In the wake loss,tip leakage flow and corner separation flow have the greatest impact,accounting for 70%of the wake loss.At the near stall point and the peak efficiency point,the effect of corner separation flow on the wake loss is greater than that of tip leakage,accounting for 50.35% and 40.01% of the wake loss,respectively.At the plugging point,the effect of tip leakage is greater than that of corner separation flow,accounting for 50.73%of the wake loss.
2 Materials and Methods
2.1 Entropy Production Methods
According to the second law of thermodynamics:
The last two terms on the right of the equation represent the entropy production rate per volume due to irreversible loss[18]:
Whereρrepresents density,εrepresents the turbulent dissipation rate,μtis turbulent viscosity,cpis the specific heat capacity,Prtis the turbulent Prandtl number.According to formulas (4),(5),(6) and (7),the calculation of entropy production rate can be realized in CFX-post.The total entropy production rate can be calculated by volume integration over the loss region.The integral formula is as follows:
WhereViis the designated loss area,is entropy production,unit is W/K.
2.2 Grid Independent Verification
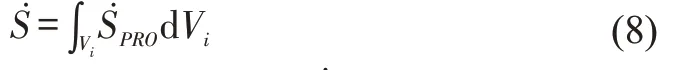
Rotor67 is the first stage rotor of two-stage axial transonic fan designed by NASA,and its basic parameters are shown in Table 1[19]:
Tab.1 Design Parameters of NASA Rotor 67
Use AutoGrid5 for single passage mesh,select O4H mesh topology structure,appropriately change the number of nodes to get different mesh numbers,and ensure the quality of each set of mesh,with the minimum orthogonality greater than 30 and the extension ratio less than 5.The grids with total node numbers of 490000,700000,870000,1000000 and 1170000 were generated.
Use commercial software CFX to solve the Reynolds averaged N-S equation,and the SST Turbulence model was selected.Heat transfer model selects total energy.The inlet conditions are set as the total pressure of 101325 Pa,the total temperature of 288.15 K,the inlet flow direction is normal to the inlet plane,and the turbulence is 5%.The radial equilibrium was chosen as the outlet static pressure average method,and the midspan was set as the radial reference position.The shroud was set as counter rotating and no slip wall.By changing the outlet static pressure,the calculation under different working conditions can be realized.
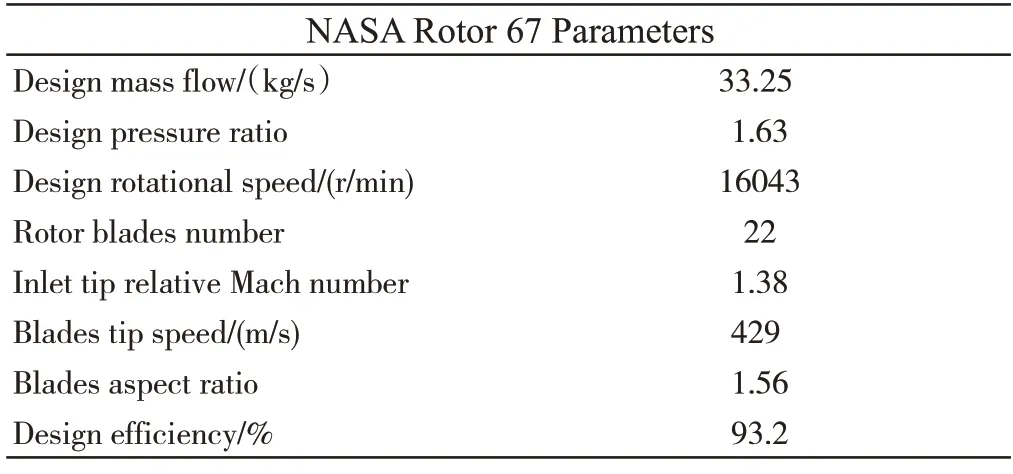
The performance of rotor67 fan is calculated with 870000 nodes and compared with the experimental data.The results are shown in the following Figure 1.
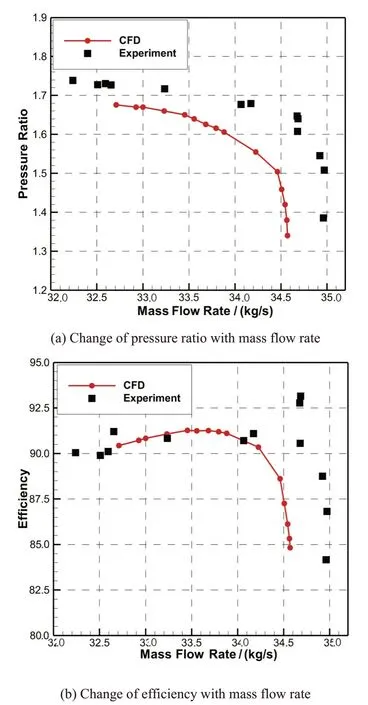
Fig.1 CFD results compared with the experimental data
The calculated results of near stall condition,peak efficiency condition and choking condition are shown in Table 2.

Tab.2 Calculation results of different conditions of NASARotor 67
Compare the changes of Mach number with axial chord length in 30% and 50% spanwise (shroud to hub) see Figure 2,50% longitudinal position of runner in the experimental report.The value of axial chord length 0 is the position of blade leading edge and 100 is the position of blade trailing edge.
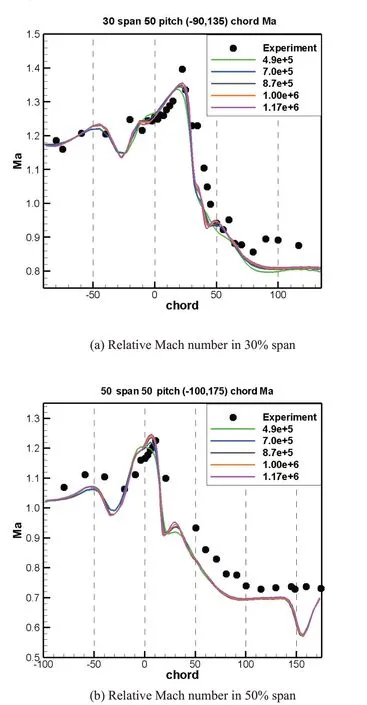
Fig.2 CFD results compared with the experimental data
Considering the accuracy and time cost,the grid with 870000 nodes was chosen for next calculation.
Using 870000 nodes grid,under the above peak efficiency conditions and near stall conditions,comparisons of the Mach number contour in the 70%spanwise channel in the experimental report was showed in Figure 3.
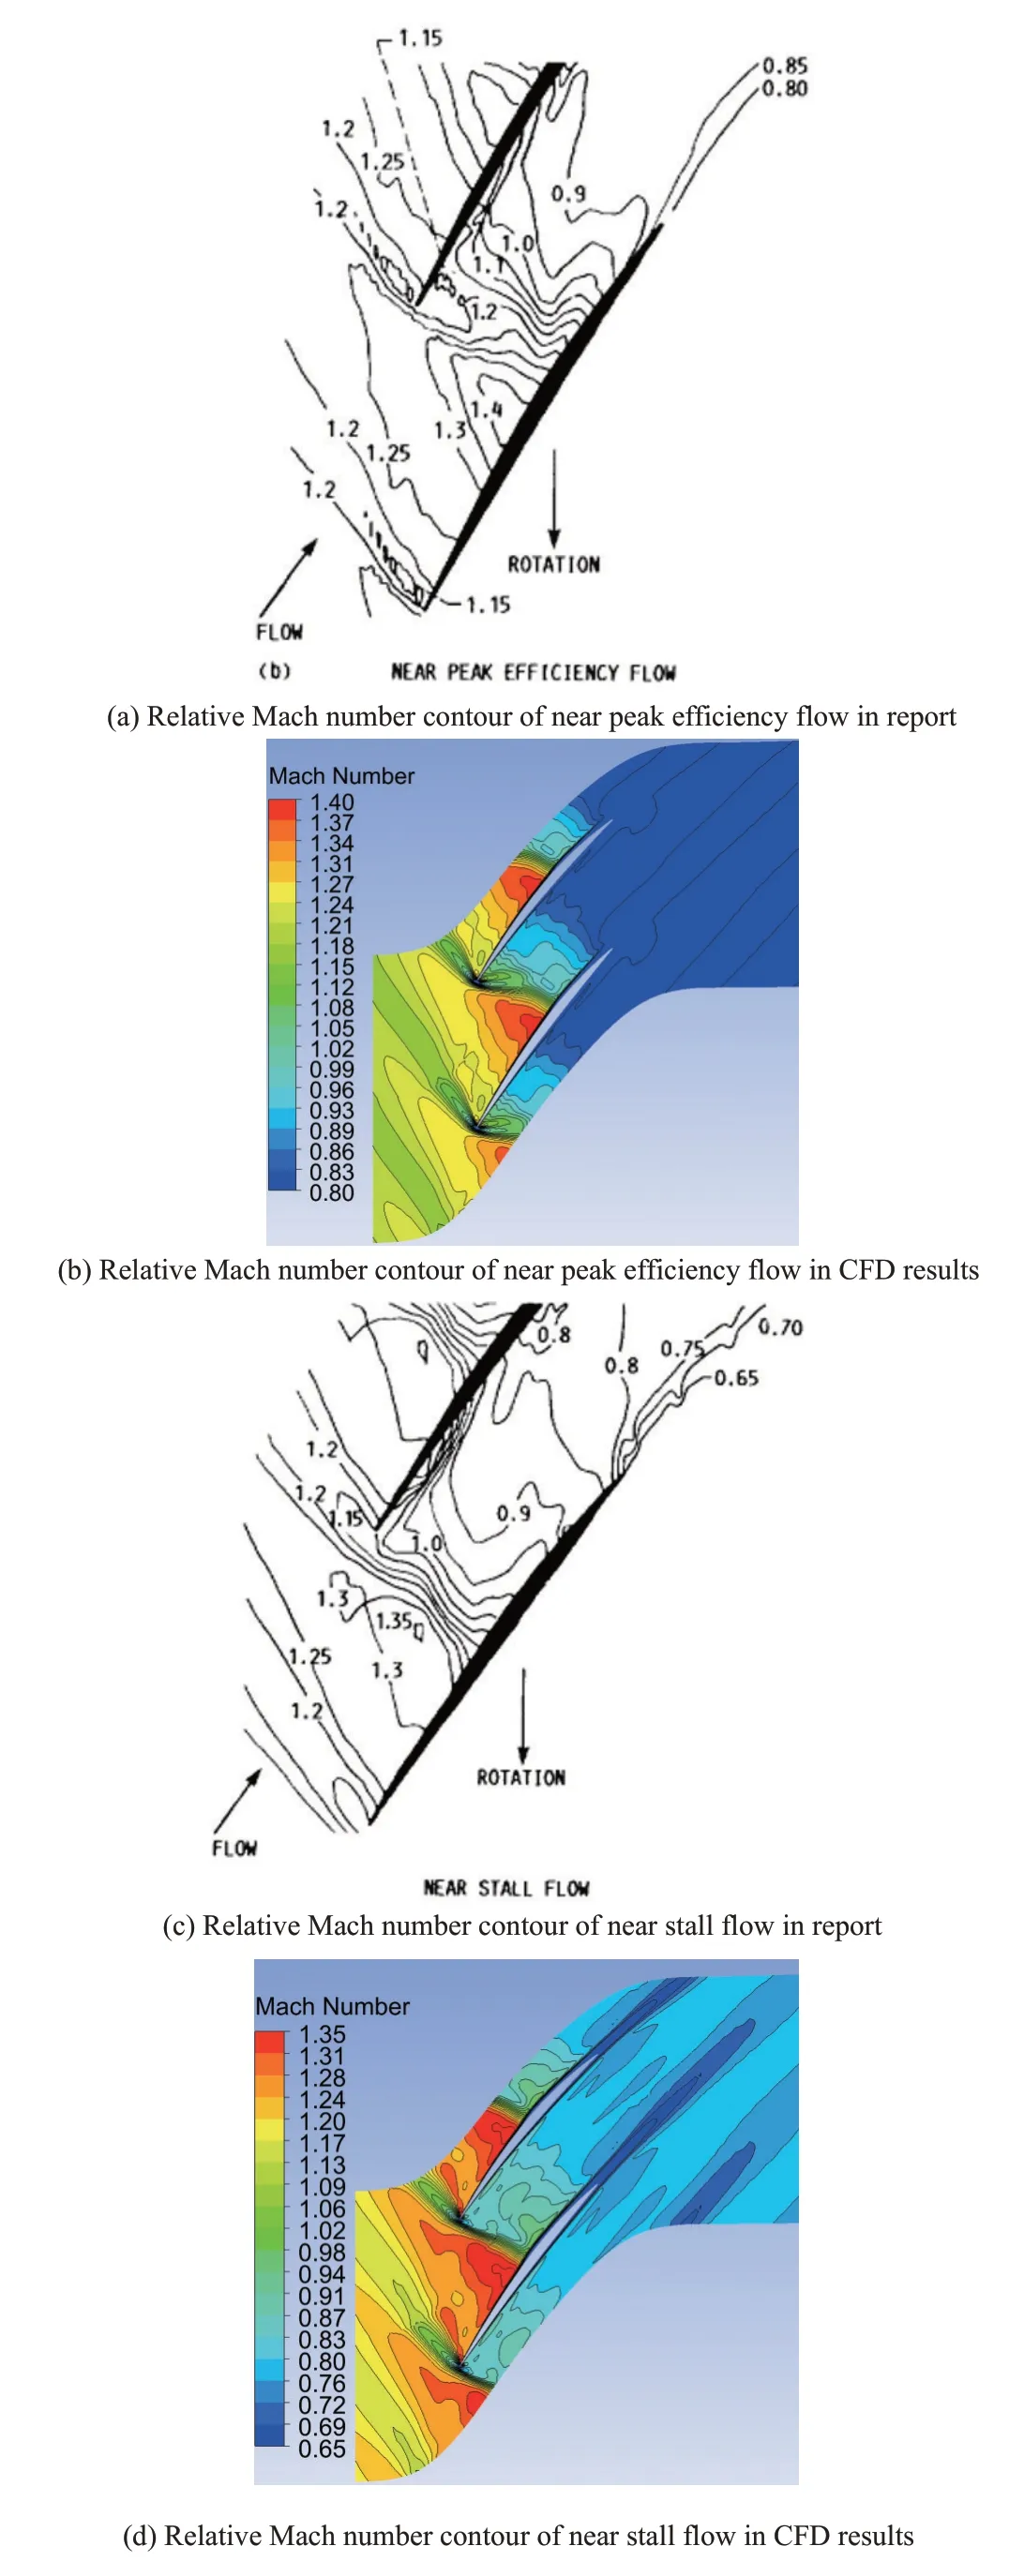
Fig.3 Comparisons of the Mach number contour in the 70% spanwise
It can be seen that the calculated results of 870000 grids are in good agreement with the experimental results,which can describe the internal flow field characteristics of rotor 67.
2.3 Loss Description Method
The losses inside the transonic fan can be subdivided into boundary layer losses,shock wave losses,tip clearance losses,corner separation losses and wake losses.
2.3.1 Shock losses
The transonic flow will produce shock waves,which will lead to sharp changes in the density of the fluid.In reference [16],Saito,Seishiro and other scholars from Kyushu University used the contours of density gradient to observe the shape of shock wave,which achieved good results.In reference [17],the density gradient on the normalized velocity vector,,determines the zones of the shock wave.ε>0 means compression,ε<0 means expansion.And identify the area ofε>30kg/m4is the shock generation area of centrifugal compressor.The research object of this paper is the fan,and the pressure ratio is much smaller than that of the centrifugal compressor.Therefore,combined with the spanwise Mach number contour and density gradient contour,it is identified the area before the trailing edge whereε>5kg/m4were the shock wave losses area.
2.3.2 Tip clearance losses
The tip clearance is inevitable in rotor blades.The fluid will produce leakage flow from the pressure surface to the suction surface at the tip clearance,and the leaked fluid will mix with each other to form vortex.Qcriterion can characterize the vortex characteristics generated in turbomachinery.The definition formula ofQcriterion is:whereΩijis the antisymmetric tensor decomposed by the velocity gradient tensor,also known as the vortex tensor;Sijis a symmetric tensor decomposed by the velocity gradient tensor,also known as the phasing rate tensor.Combined with the streamline diagram in the fan,the tip clearance leakage zone can be determined with geometric constraints.
2.3.3 Corner separation losses
With the development of the boundary layer on the blade surface,the boundary layer separation will occur near the trailing edge of the fan blade.Coupled with the reverse pressure flow in the fan channel,low-energy fluid accumulates at the trailing edge near the hub of the suction surface,generating vortices and causing losses [5].The low-energy fluid is in the form of vortex,theQcriterion and geometric constraints can also be used to determine the low-energy fluid losses zone at the blade end wall.
2.3.4 Boundary layer losses
Due to the viscous effect,it will form a boundary layer of low velocity fluid near the wall surface that is much smaller than the mainstream velocity.The losses caused by the boundary layer can be characterized by the high turbulence eddy dissipation near the wall surface [17].Therefore,the boundary layer losses area defined in this paper,combined with the turbulent vortex dissipation rate contour,delineates the area below 2mm near the wall as the boundary layer losses zone.
2.3.5 Wake losses
In the fan internal flow,the area behind the trailing edge of the blade is defined as the wake losses area.It is mainly caused by the boundary layer separation flow on the blade surface,the corner separation flow,the tip clearance leakage flow and the mixing of shock waves.
3 Results
3.1 Rotor67 Internal Flow Analysis and Losses Area Characterization
3.1.1 Boundary layer losses
According to the above definition,taking the 50%spanwise section of the blade as an example,the contour of turbulence eddy dissipation as shown in Figure 4.The painted area with wall surface<2mm contains the boundary layer losses area Figure 4(b),which is covered by the red three-dimensional volume.The area with high turbulence eddy dissipation at the trailing edge outside the 2mm area is classified as the wake mixing losses area.The contour of logarithmic entropy production rate is shown in Figure 4 (c),and the value is large on the blade surface and wake area.The region with large entropy production rate at the leading edge of the blade is the location of shock wave generation.
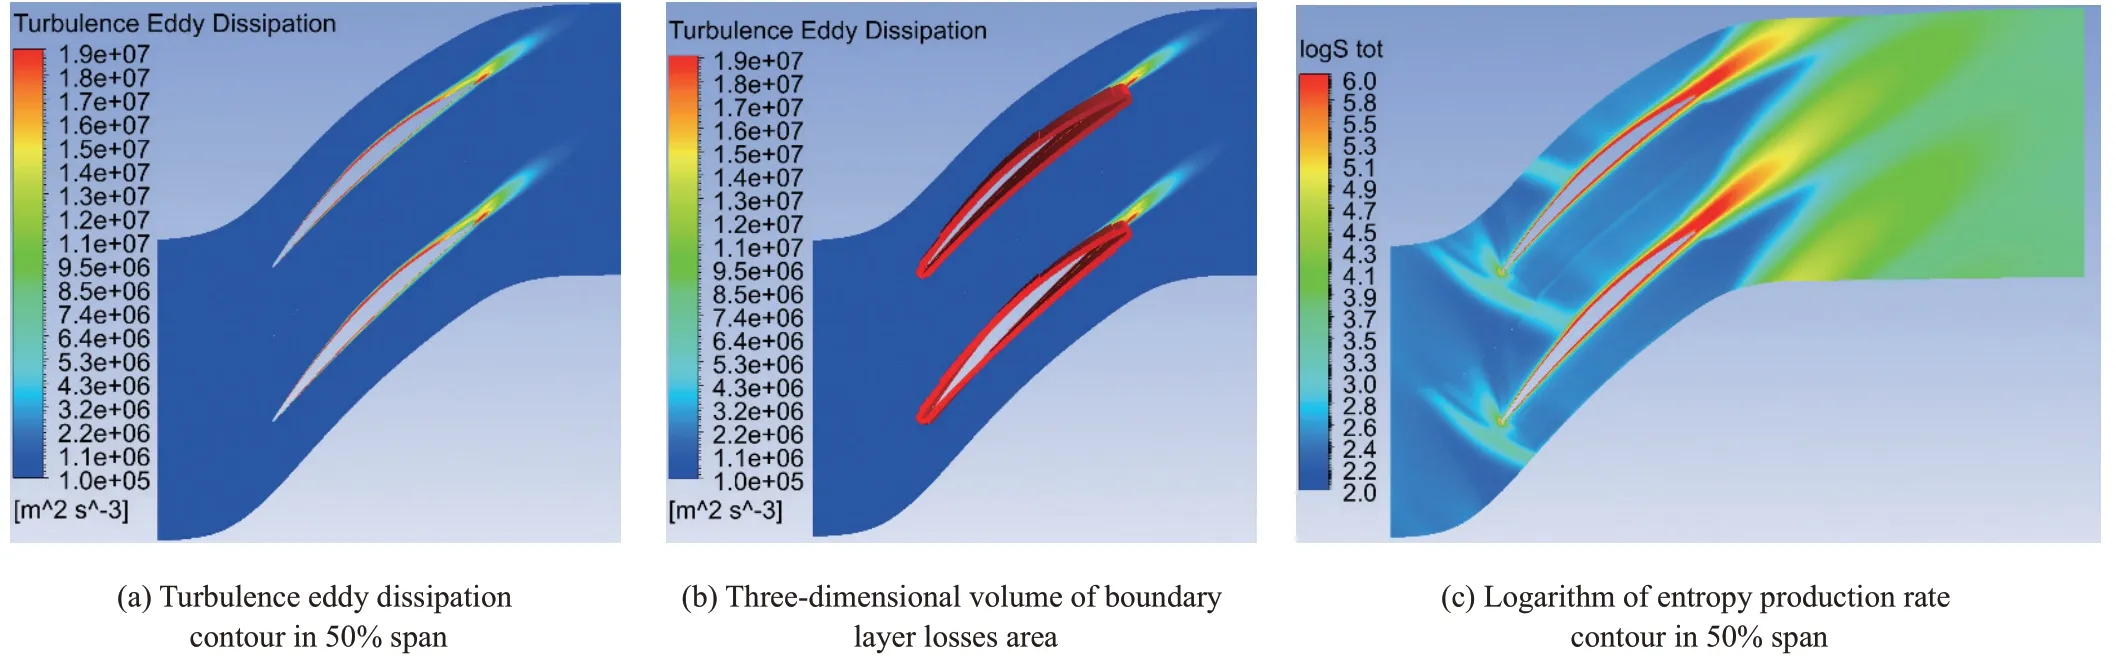
Fig.4 Visualization of boundary layer losses
3.1.2 Shock losses
Combining the spanwise Mach number contour shown in Figure 5 (a) and density gradient contour,it is identified the area before the trailing edge where were the shock wave losses area.The green three-dimensional volume part,shown in Figure 5(b),well covers the location of the corresponding shock wave.The contour of logarithmic entropy production rate,shown in Figure 5 (c),also well characterizes the shock losses.
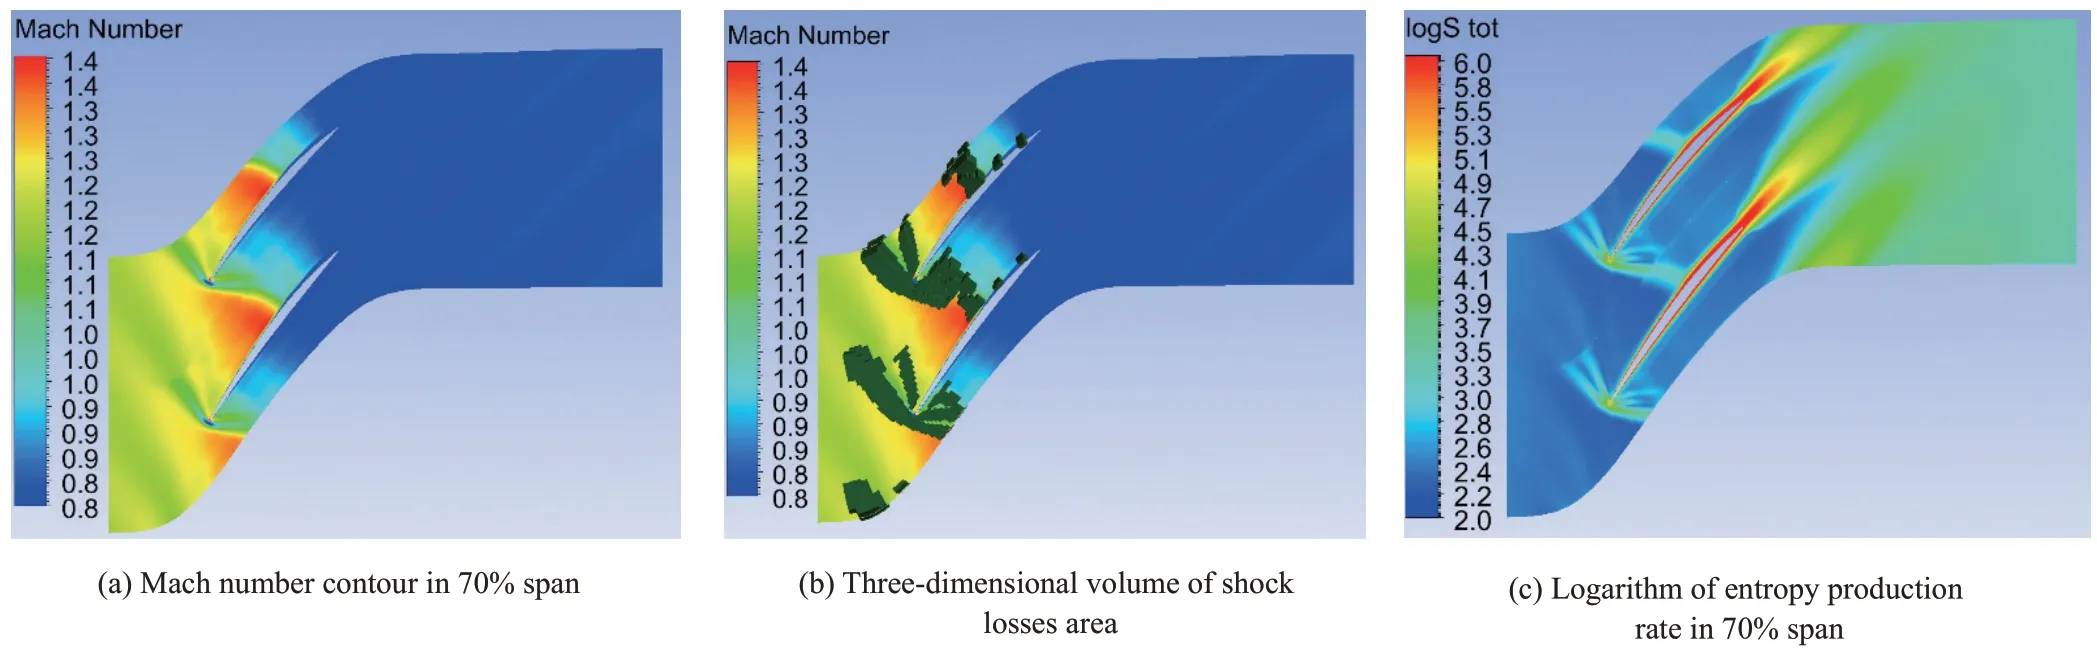
Fig.5 Visualization of shock losses
3.1.3 Tip Clearance Losses
According to the three-dimensional streamline in the tip clearance shown in Figure 6 (a),the tip leakage is in the form of secondary flow.The vortex in the flow channel can be defined by theQcriterion,and the tip clearance losses area can be defined by the limita-tion of the three-dimensional streamline position covered by volume in orange shown in Figure 6 (b).It can be seen from the three-dimensional streamline that the fluid,leaking from the pressure surface to the suction surface,will mix with each other and form a vortex near the tip of the blade pressure surface.According to the entropy production contour shown in Figure 6 (c),the losses caused by tip leakage is larger,and its impact on the wake is also larger.
3.1.4 Corner separation losses
Due to the separation effect of the boundary layer,a low-pressure zone will be formed near the trailing edge at the hub of the blade suction surface,resulting in the accumulation of low-energy fluids.The three-dimensional streamline diagram represents the separation and accumulation of low-energy fluid in the corner of the blade suction surface.In this paper,the area before the trailing edge is divided into the corner separation losses,the blue coverage area in Figure 7(b),and the area behind the trailing edge is divided into the wake losses.Although the more accurate corner separation losses should include behind the trailing edge,the losses division of this part is difficult to determine due to the change of losses location under different flow conditions.Therefore,for the convenience of calculation,the trailing edge is used as the dividing line to divide the corner separation and wake losses,and the wake losses below 20% is mainly attributed to the influence of corner separation fluid.The Mach number contour and entropy production logarithmic contour corresponding to the spanwise section also well characterize the losses of the corner separation region and its influence on the wake.
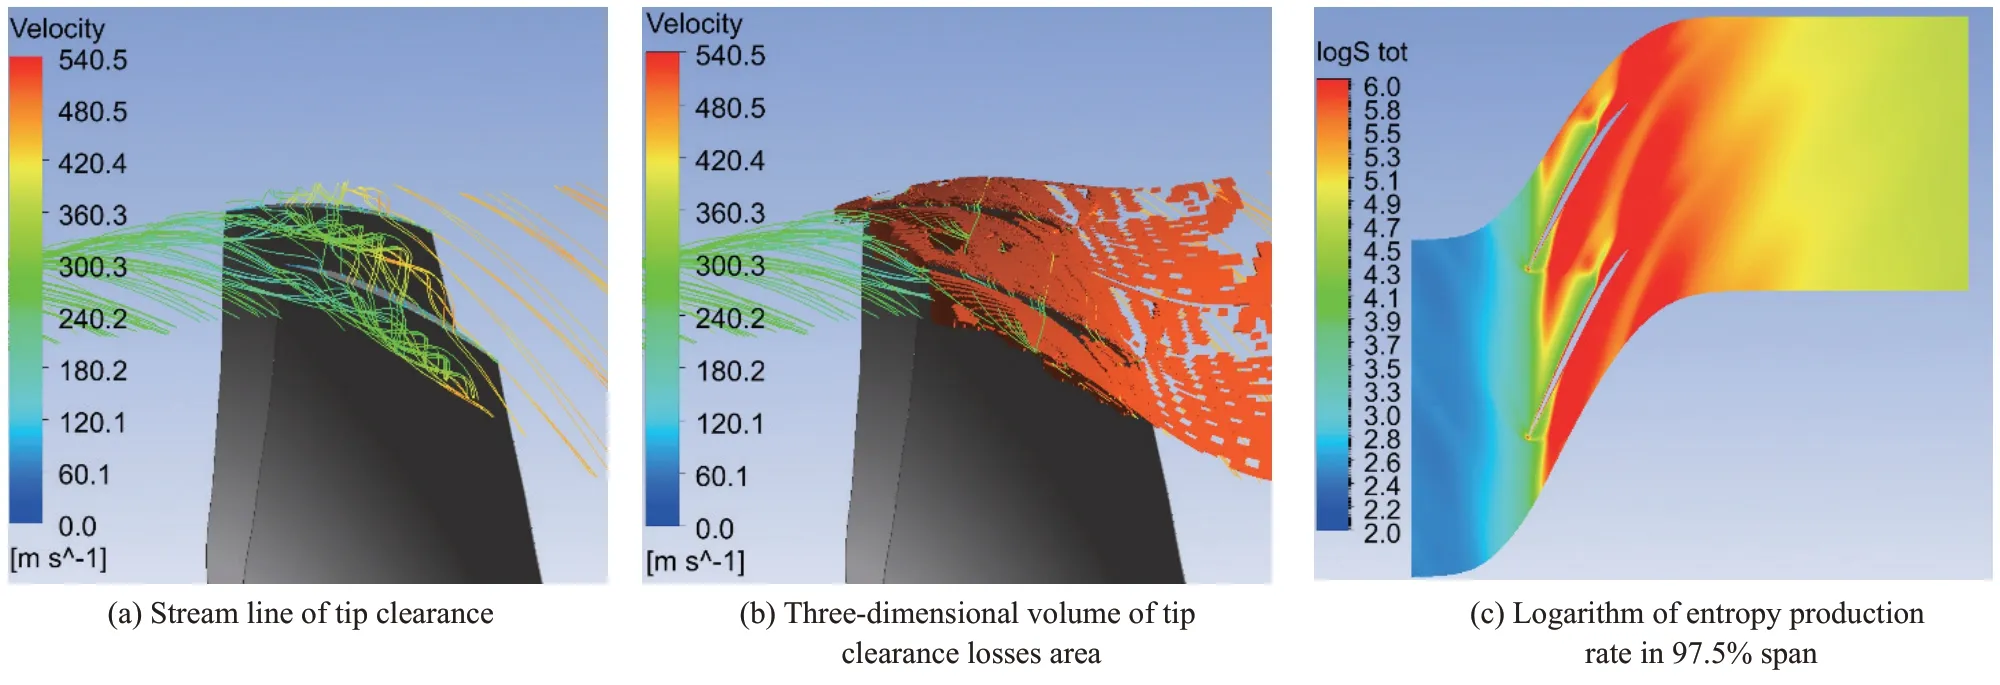
Fig.6 Visualization of tip clearance losses

Fig.7 Visualization of corner separation losses
3.1.5 Wake losses
All areas behind the trailing edge are divided into wake losses areas,as shown in the purple area below.Along the spanwise direction,it is divided into five areas: below 20%spanwise,20% to 40% spanwise,40% to 60% spanwise,60% to 80% spanwise and above 80% spanwise.It can be considered that the wake losses near the tip area is mainly affected by the tip leakage flow,and near the hub area is mainly affected by the corner separation flow.The overall losses area division of near stall condition,peak efficiency condition and choking condition point is shown in Figure 8.The green area is the shock losses area,the red area on the blade surface is the boundary layer losses area,the orange losses area on the tip is the leakage losses area,and the purple area on the trailing edge is the wake losses area.
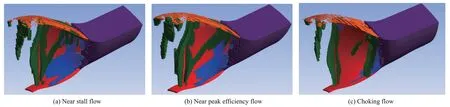
Fig.8 Three-dimensional volume of losses area
It can be seen from the change of losses geometric position as the operating point from near stall condition to peak efficiency condition and then to choking condition,the positions of shock wave losses,corner separation losses and tip leakage losses all move to the trailing edge of the blade.
3.2 Losses Analysis Based on Entropy Production
According to the region divided by the above losses,the entropy production is volume integrated.The calculation results of entropy production in each losses area under three flow conditions are shown in Table 2.
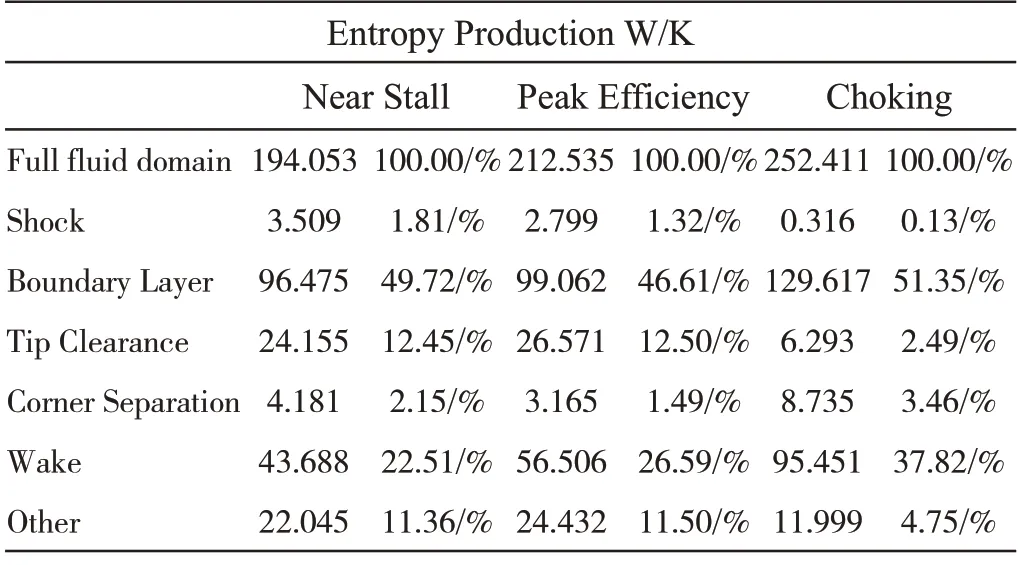
Tab.2 Calculation results of entropy production in different flow conditions
It can be found that the entropy production at the flow condition of peak efficiency is not the smallest.Because isentropic efficiency is not only related to the entropy production but also enthalpy increase[20]:
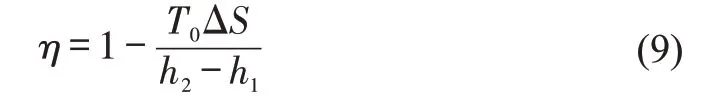
Therefore,entropy production can only characterize the relative size of each loss.The proportion of different losses at each flow condition is shown in Figure 9:
It can be seen that the shock losses accounts for less than 2% on each condition.With the increase of mass flow rate,the losses area gradually moves backward,and the proportion of wake mixing losses gradually increases.The increase of mass flow rate will eventually lead to more serious mixing losses in the wake area.The entropy production in different spanwise of the wake under the three flow conditions is shown in Table 3.
It can be seen from the Figure 10 that the wake losses are mainly concentrated in the spanwise areas of over 80%and less than 20%,which can be considered to be mainly affected by tip leakage flow and corner separation flow.Therefore,from the above calculation results,it can be concluded that as the flow condition changes from near stall to choking,the losses gradually move to the trailing edge of the blade,and the impact caused by tip leakage gradually increases,which should be taken into account in design.
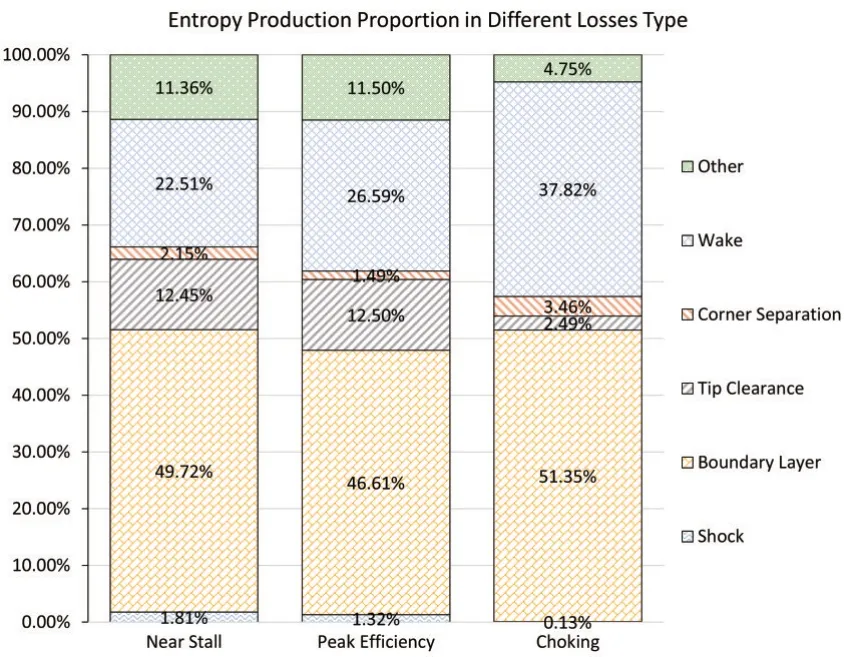
Fig.9 Entropy production proportion in different losses type
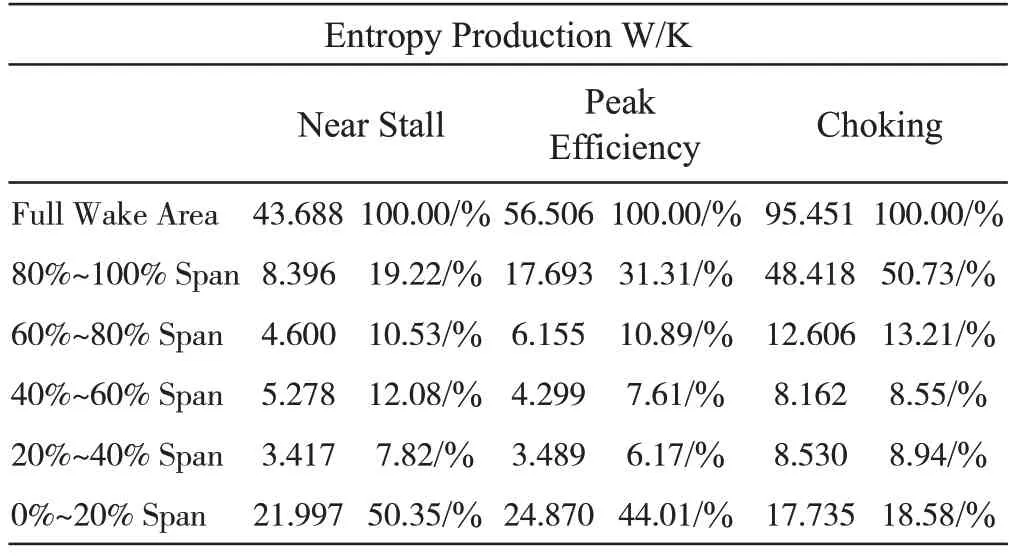
Tab.3 Calculation results of wake entropy production in different flow conditions
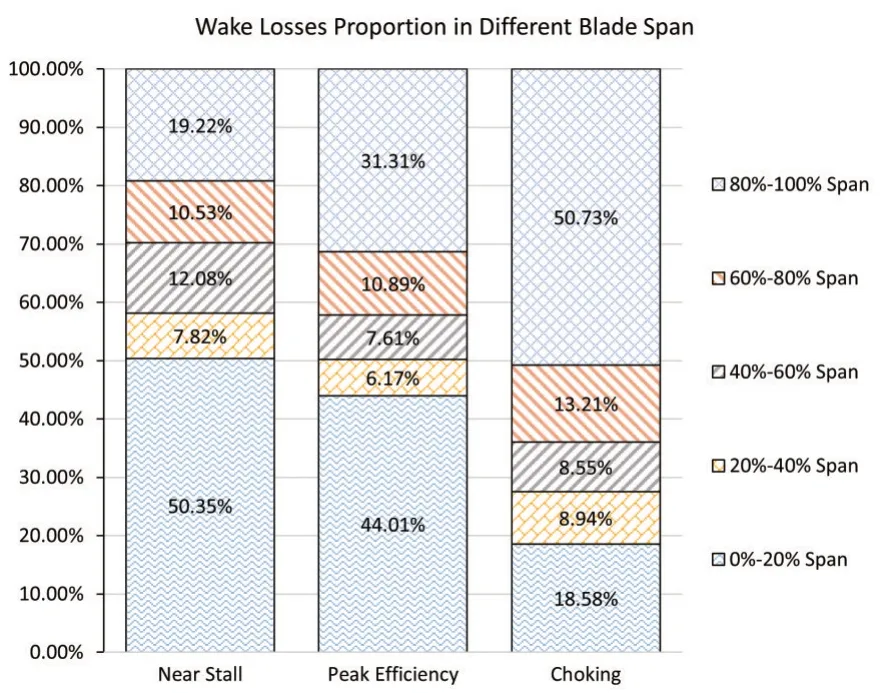
Fig.10 Wake losses proportion in different blades span
4 Discussion
In this paper,the entropy production analysis method is used to define the losses source with the physical characteristics of flow,and the internal losses of NASA rotor67,a high load fan,is quantitatively calculated.The losses changes of the fan under near stall condition,peak efficiency condition and choking condition are analyzed,which provides a reference for understanding the internal flow and optimal design of the high load transonic fan.But there are still many deficiencies in this paper.In this paper,only RANS method is used to calculate the steady state of the fan,and the precision of SST Turbulence Model for wake and tip leakage flow needs to be verified.This paper only calculates the entropy production value in different losses,which can only represent the proportion between different losses,and cannot be directly used as the basis for guiding blade design;Whether the entropy production depends on the fineness of the grid remains to be discussed.Therefore,the following ideas should be considered in future work:
·Compare the precision of different turbulence models on the loss description and the influence on the quantification of entropy production.
·An entropy production coefficient corresponding to efficiency should be proposed,which is used as the optimization objective for turbomachinery design.
·Verify the influence of mesh fineness on entropy production quantification.
This paper discusses the method of physical description of fluid losses characteristics,so that it can be used to divide the losses area in other turbomachineries.
杂志排行

风机技术的其它文章
- 机匣处理在无喷嘴径流涡轮叶片抑振中的应用*
- Influence of Change Law of Blade Leading-Edge Ellipse Ratio on Inception Cavitation Performance of Centrifugal Pump*
- 带诱导轮的离心式航空燃油泵空化特性分析*
- Optimization Design of Air Conditioning Outdoor Unit Top Plate Based on Orthogonal Test
- 重燃透平叶片真实内部冷却通道的传热特性研究*
- Numerical Study of Film/Shock Interaction on Suction Surface of Transonic Turbine Cascade*