Numerical simulation of drop weight impact sensitivity evaluation criteria for pressed PBXs
2023-01-18HongzhengDuanYanqingWuKunYangFengleiHuang
Hong-zheng Duan,Yan-qing Wu,Kun Yang,Feng-lei Huang
State Key Laboratory of Explosion Science and Technology,Beijing Institute of Technology,Beijing,100081,PR China
Keywords:Polymer-bonded explosives (PBXs)Drop weight impact Numerical simulation Sensitivity evaluation criterion Hotspot mechanism
ABSTRACT A thorough understanding of drop-weight impacted responses for polymer-bonded explosives (PBXs) is significant to evaluate their impact sensitivity.The characteristics of the drop-weight impacted pressed PBXs including deforming,fracturing,forming a local high-temperature region and igniting,were simulated using a coupled mechanical-thermo-chemical model integrating micro-defects evolution.A novel evaluation method for impact sensitivity is established using the relation between the input kinetic energy and the output energy due to deformation,crushing energy,local hot spot energy and ignition.The effects of impact velocity on sensitivity were analyzed and the critical local ignition impact velocity is determined as 4.0-4.5 m/s.The simulated results show that shear-crack friction heating is the dominant ignition mechanism.The region along the boundary of PBXs sample is the most hazardous regions where ignition first occur.The propagation of stress wave in PBXs causes shear-crack hotspot and bulk temperature exhibiting an approximate 45° direction evolution path,which is the main reason that dominated damage-ignition region transits from the boundary to the central of sample.
1.Introduction
1.1.PBXs safety and drop weight experiment
Polymer-bonded explosives(PBXs)are widely used in the main charge of conventional weapon warheads because of their good mechanical properties and high-energy,low-sensitivity performance.The safety performance of energetic materials is the key to ensure the stable and effective operation of the whole weapon system [1].Over the past decade,there has been growing concern about the safety from accidental stimulation[2,3].As PBXs is more sensitive to external mechanical stimuli,it could cause a variety of accidents,including accidental ignition,violent deflagration or explosion[4,5].Hence,it is important to pay much more attention to the safety of explosives.
The drop weight test is an important tool and widely used method for evaluating impact sensitivity of explosives.Researchers have improved test methods in drop weight test to characterize the response of explosives under different impact modes and impact intensities.For example,Field [6,7] designed a transparent tempered glass anvil and hammer head to record images with a high-speed camera.The experimental images showed that highspeed radial flow and friction were responsible for the ignition of explosive.Coffey [8] studied specimens using temperature development techniques.The test results showed that large strain radial flow led to temperature rise and surface ignition,suggesting that local temperature rise due to mechanical deformation and shear was the main ignition mechanism.Wu et al.[9-11] modified the conventional drop weight device and combining with a high-speed camera to observe the HMX and RDX particle undergoing plastic deformation,melting,ignition,combustion and extinction processes.
As stated above,the drop weight test just can obtain images and average pressure data during the whole impact process.The results can be used to qualitatively analyze the ignition phenomena but it is not yet possible to quantitatively characterize each safety evaluation element and sensitivity.Therefore,numerical simulation should be performed to(i) quantitatively characterize the physical quantities at each stage,including the pressure,hot spots,bulk temperature and the chemical reaction (ii) establish quantitative evaluation sensitivity indexes,(iii) provide useful information for the safe storage,transportation and use of explosives.
1.2.Numerical simulation of drop weight experiment
The numerical simulation of the drop weight test can quantitatively analyze(i)the pressure on the upper and lower surfaces of explosive,(ii) the regions with higher hotspot temperature region and (iii) the time-to-ignition and ignition sites.The numerical results provide ideas for the evaluation of the sensitivity and the damage-ignition mechanism.W.So et al.[12] analyzed the shear stress in the PBAN on the upper and lower surfaces of the sample.Bennett et al.[13] improved the anisotropic statistical crack mechanics (SCRAM) model [14] to account for viscoelastic effects of the material.The simulated results demonstrated that the hot spot is mainly caused by shear-formed fracture surface friction.Menikoff et al.[15] simulated the response of PBX9501 under drop weight impact test.The results show that the collapse of the voids is the main ignition mechanism.Wu et al.[16]investigated the effects of plasticity of particles,frictional heat,melting and chemical reactions generated by particles on impact sensitivity using theoretical models.
The current numerical model of drop weight impact paid more attentions to the mechanical response process,while few of them could obtain the critical conditions of damage-ignition response and their underlying mechanisms.In addition,there is little research on the quantitative evaluation index of the impact safety and sensibility.It is necessary to establish the quantitative evaluation index of sensitivity to solve the intrinsic relationship between the mechanical response of explosives and hotspot-ignition such as deformation and fragmentation damage under the drop weight impact.
1.3.Mesoscopic numerical model development
Both explicit mesoscopic modeling and implicit macroscale modeling are commonly used numerical methods for PBX explosive damage-ignition mesoscopic mechanism studies [17-24].Explicit mesoscopic method could account for each component of PBXs phase,interface,defects and other microscale structures.For example,Baura et al.[18-20] used the cohesive finite element method (CFEM) to quantify the contribution of various energy dissipation mechanisms such as viscoelastic deformation of the binder,particle-binder debonding,particle fragmentation,and crack friction to hot spot formation within PBX.The mesoscopic calculation can explicitly consider the mesoscopic response process,while the method cannot be extended to describe the mechanical-ignition response of explosives under complex loading like drop weight.
The implicit macroscopic model is based on the homogenization theory,constructing the thermodynamic evolution model of representative mesoscopic elements and the feedback law between mesoscopic localization behavior and macroscopic response.It has significant advantages in the evaluation of explosives safety at the engineering scale.For instance,Dienes et al.[21] developed the anisotropic statistical crack mechanics(SCRAM)model which takes into account the physical behavior of microcrack initiation,growth,and coalescence,frictional heating of the shear crack surface,melting,ignition,and rapid combustion.Liu and Chen et al.[25]used the Visco-SCRAM model to predict the ignition response of explosives in the Steven safety test and analyzed the effect of column size variation on the ignition response.Yang et al.[26-28]developed a damage-viscoplastic model to predict the overall mechanical behavior and possible damage modes of PBXs under complex dynamic loading and analyzed the main differences between PBX in terms of defect hot spot formation,ignition threshold,sensitization or desensitization during the ignition phase of highintensity impact and low-intensity impact initiation.
In summary,there are few studies on the numerical simulation of drop weight impact damage-ignition.No standard index for sensitivity evaluation has been established.It is urgent to develop a model which could describe the more micro-defects related hotspots,i.e.,microcracks and microvoids under complicates loading condition.The process of how the ignition is induced in each reaction stage during the drop weight impact has not been investigated.We need to establish quantitative indicators for sensitivity evaluation.
1.4.Explosives mesoscopic damage-hot spot-ignition
The internal micro-defects in the explosive crystal is a key factor affecting the performance of explosives.In its synthesis,preparation,molding and mechanical processing,explosive crystals and binder could form the initial void,modeling powder binder coating incomplete,crushed explosive crystal fragmentation and crushed micro-cracking and other different forms of initial damage.These damages will lead to deterioration of the mechanical properties of PBXs.A region of energy aggregation may be evolved by cavity collapse,friction,shear,slip band and other mechanisms to become a “hot-spot”,affecting the strength,sensitivity and safety performance of PBX [29,30].Various hot spot mechanisms have been proposed,including local plastic work,friction,shear,cavity collapse,strain rate effects,cracking,dislocation mechanisms[31-34].Bowden et al.[35]summarized the mechanistic aspects of explosive hotspot formation under drop weight impact.They concluded that the possible causes of hotspot formation are (i)adiabatic compression of the solid explosive gap or adiabatic compression of the air bubbles present,(ii) friction between the explosive particle surfaces or within the crystals.Some researches proposed a shear band ignition mechanism,such as Afanasev et al.[36],Balzer [43] et al.Chaudhri [37] suggested that friction and viscoplastic collapse are the main ignition mechanisms.In addition,Massoni et al.[38] developed a model of viscoplastic small-hole collapse ignition and found that under impact loading conditions,a viscoplastic cavity collapse mechanism can generate more energy than friction for a compacted explosive HMX.Finally,Field and Walley et al.summarized various sources of hot spots [39-42],including collapse in gas space(generated by jet impact shock or by adiabatic compression heating),local adiabatic shear bands,friction and viscous heating.Mateille et al.[44] used X-ray microtomography to better observe the damage induced ignition process,but no quantitative description and mechanistic explanation of damage induced hot spot-ignition has been provided.
Although many scholars have studied the specific possible hotspot mechanism of explosives[45-48],there are fewer studies on the mechanism and sensitivity evaluation methods under drop weight impact.It is particularly important to quantitative evaluation criteria of the sensitivity and the damage-ignition mechanism of explosives under mechanical stimuli.
1.5.Current work
In this paper,a mesoscopic model of the coupled mechanicalthermo-chemical in PBXs is developed.The effects of the evolution of two types micro-defects on the damage and hotspot formation of PBX explosives are considered.The coupled mechanicalthermo-chemical responses of PBXs under drop weight impact are simulated.Additionally,the index of sensitivity of PBXs is quantitatively evaluated.The specific research contents of each part are as follows:
(1) A finite element model was developed for PBXs under dropweight impact.
(2) Deformation,damage and fracture responses,and the damage-related hotspot mechanisms of PBXs were analyzed.
(3) The effect of different impact velocities on the sensitivity of PBX explosives was investigated.
2.Coupled mechanical-thermal model of microcrack and microvoid
Five micro crack evolution modes are considered,including tensile opening,shear opening,pure shear,shear friction and friction self-locking.And two evolution modes of void collapse and distortion deformation.Shear crack hot spot and void collapse hotspot model were included,which has the self-judgment ability of complex stress state and the self-starting ability of two microdefects hot spots.In the microcrack-microvoid thermochemical coupling meso model,the overall stress and strain are decomposed into deviatoric and volumetric part respectively,so as to establish the microcrack related deviatoric constitutive relationship and microvoid related volume constitutive relationship.The two parts are coupled through Gurson yield criterion.The relevant variables are updated through the microcrack and microvoid evolution equation.The sub point model of friction hotspot of shear crack and void collapse is established.The details of the model and the implementation of the algorithm are shown in the literature[26,27].
2.1.Deviatoric constitutive relationship
The total deviatoric strain(e) is decomposed into viscoelastic strain(eve),plastic strain(ep) and microcrack strain(ecr) caused by microcrack propagation.The viscoelastic deformation,plastic deformation and the influence of microcrack evolution on the mechanical behavior of the binder matrix material in PBX explosive are described respectively.The viscoelastic deformation of PBX explosive is described by the generalized Maxwell model,the crack strain caused by microcrack opening and shear propagation is described by the SCRAM model[19],and the deviatoric constitutive relationship of the material can be expressed as
where,s is the stress deviation,Pa;G is shear modulus,Pa;A,B and C are expressed as


where,p is the pressure,Pa;N0is the initial crack density,m-3;v is Poisson's ratio.
2.2.Volumetric constitutive relationship
In order to describe the effect of irreversible damage caused by the evolution of micro pores on the volume deformation of PBX explosive,the porosity related equation of state is adopted [52].

where,f is the porosity;ρ is the density of void material,g/cm3;e is the specific internal energy,J/g;Corresponding to dense material ρs=ρ/(1-f),es=e,ηs=1-ρs0/ρs=-εv;Γsis Grüneisen coefficient,c0is the wave speed,m/s;s is material parameter.
2.3.Gurson yield criterion
The plastic deformation of porous PBX material is described by the classical Gurson model[53],in which the material yield surface and von Mises equivalent stress σeis related to pressure p

Considering the material hardening effect and strain rate effect under dynamic loading,the yield strength YMof dense material(f=0) can be expressed as

where σ0is the corresponding initial yield stress under=10 s-1loading,is the equivalent plastic strain,is the equivalent strain rate,h is the hardening modulus,and n and C are the material parameters.
2.4.Main crack growth law
Based on the Griffith energy release rate crack propagation criterion,the microcrack evolution equation can be expressed as[22].
Due to the randomness of the direction distribution of microcracks in the material,there is a critical microcrack direction corresponding to the maximum energy release rate.The microcrack in this direction first propagates unsteadily under the minimum applied stress,so it is defined as the main crack.The determination of the dominant crack direction is related to the current stress state(σ1-σ3plane).For the determination of the main crack direction and the corresponding energy release rate,see literature [22,23].The overall damage degree of the material corresponding to microcrack propagation is defined as dcr=/(a3+).
2.5.Porosity growth law
Considering the two deformation mechanisms of porosity reduction () caused by void collapse and porosity increase ()caused by void distortion,the porosity evolution equation can be expressed as [54].


where J3is the third invariant of the stress tensor,MPa3.
2.6.Microcrack hot spot temperature rise
One dimensional heat conduction equation is used to describe the thermodynamic processes of friction heat generation,melting,ignition and heat transfer on the surface and surrounding area of shear crack [55]:

where,x is the coordinate axis along the normal direction of the microcrack,and the three terms at the right end of the equation represent the heat conduction term,the energy released by the chemical reaction,and the heat generated by the liquid-phase viscous flow in the melting region (Ths≥Tm).Thsis the crack hot spot temperature,K.cvis the specific heat capacity,J/(kg·K).k is the thermal conductivity,J·(m·s·K).Qris the heat release of chemical reaction per unit mass,J/kg.Z and Taare the parameters of Arrhenius reaction rate equation,s-1,K.fm(0≤fm≤1) is the fraction of melting.μvis the viscosity coefficient of melting zone.˙ε=f vc/l is the shear strain rate in the melting region,s-1.vcis the sliding velocity of microcrack,m/s.l is the width of melting area,m.
2.7.Microvoid hot spot temperature rise
The material temperature (Tvo) distribution around the microvoid is described by one-dimensional spherical heat conduction equation [56].

where,the generation rate of viscoplastic work per unit volume around the void can be expressed as

In the equation,the right two terms represent the power generated by the plastic effect and viscous effect of the matrix material respectively.b0is the initial outer diameter of the micropore,μm.η is the viscosity coefficient related to the matrix material around the micropore.Pa·s.
2.8.Bulk temperature rise
The overall temperature rise(Tbulk)rate of PBXs is calculated by external work[57].

In order to further study the response of pressed PBXs in the whole process of drop weight impact,firstly,the simulation parameters are calibrated according to the compressive stress-strain test curve of PBXs.The mechanical-thermal-chemical coupled mesoscopic model of microcrack-micropore mechanism was adopted to obtain stress-strain curves under different strain rates and test results curves are shown in Fig.1.The material parameters of pressed PBXs obtained by calibration are shown in Table 1,and the parameters of microcrack micropore hot spot model are shown in Table 2.
3.Results and discussion
3.1.Finite element model
Fig.2 shows the schematic diagram of the PBX(95%HMX and 5%binder pressed and loaded)explosive under drop weight with low speed impact.The wave velocity,elastic modular and density of explosive tablets are 2774 m/s,14.6 Gpa and 1860 kg/m3respectively.The upper and lower striking pillar,guiding sleeve and base are made of steel.The size of the striking pillar is φ 20×5 mm2,the size of the guiding sleeve is φ 40 mm outer diameter,φ 20 mm inner diameter and 16 mm high,the size of the base is φ 50 mm outer diameter,φ 40 mm inner diameter and 25 mm high.φ 20 × 5 mm2explosive tablet is placed in the middle of the upper and lower striking pillars in the guide sleeve.In the test,the drop weight impacts the specimen with different initial velocities,and the specimen undergoes deformation,crushing,formation of localized high temperature,ignition and even burning process in the relatively confined space.
Fig.1.The stress-strain curves at different strain rates obtained by calculation and experiment of pressed PBXs.
The explosive tablet is meshed with 0.13 mm triangular element.The upper and lower striking columns and guide sleeve are meshed with 1.0 mm quadrilateral elements.The automatic contact algorithm between the striking column and the tablet is used to impose a two-dimensional axisymmetric boundary condition at the centerline position of the model.The initial velocity is 4.5 m/s (equivalent to 100 cm drop height).The time step is Δt=5×10⁻⁹s.In order to analyze the damage-ignition mechanism and set up the sensitivity evaluation criterion,positions A,B and C were selected at equal intervals on the centerline (L1) of the specimen at the initial moment.The distances of each position from the top of the tablet were 0 mm,2.5 mm and 5 mm,respectively.The straight lines L2 and L3 determined by the positions of E,F,G and A,D,E were continued to be selected to further analyze the distribution and evolution of state variables such as pressure,microcrack-microvoid damage,microcrack hotspot temperature,bulk temperature and chemical reaction fraction along L2 and L3.
Table 1 Material parameters for PBXs [13,21,50,51].

Table 2 Parameters for microcrack-microvoid hotspot sub-model [26-28,49].
Fig.2.Schematic diagram of finite element model for PBX drop weight test.
3.2.Ignition mechanism and sensitivity evaluation
3.2.1.Deformation and wave propagation evolution
The incident wave generated by the impact of a 5 kg hammer head propagates within the pressed PBX tablet.The tablet firstly exhibits deformation response under complex stress loading.Fig.3(a)and Fig.3(b)show the pressure and Von-Mises equivalent stress variation curves along L1 and L2,respectively.From the enlarged region of Fig.3(a),when the PBX tablet is loaded by the hammer head impact,the compression wave is transmitted into the interior of the explosive.The incident compression wave (S1~9.2 MPa) reaches the position C along the center of L1 at 3.0 μs.Then the wave reflected at the lower boundary of the PBX table and superimposes with the incident wave to form the reflected compression wave (R1~15.0 MPa).The R1 wave reaches the upper surface of the PBX tablet after forming a secondary reflected wave(S2).Comparing with the amplified region in Fig.3(b),the incident compressional wave (S3~16.5 MPa) arrives at the position G along the L2 boundary at 3.6 μs.Superposition of the reflection and incident wave at the lower boundary formed a reflected compressional wave (R2~23.1 MPa).The R1 wave arrives at the upper surface of the PBX tablet and reflects to form a secondary reflection wave(S4).Comparing Fig.3(a)and(b),the strengths of the incident and reflected compression waves along the L2 boundary are larger than the compression wave along the L1 center during the drop weight impact.The continuous impact causes the PBX tablet damage to enter the large deformation fragmentation stage.
Fig.3.Pressure and Von-Mises equivalent stress at different positions: (a) L1;(b) L2.
From Fig.3(a) and Fig.3(b),the pressure along the center of L1(position point C) reaches a maximum value of 305 MPa at 70 μs.The Von-Mises equivalent stress reaches a maximum value of 140 MPa at 54 μs.The L2 region (position point C) reaches a maximum pressure value of 465 MPa at 107 μs.The Von-Mises equivalent force reaches a maximum value of 133 MPa at 101 μs.The secondary increase in pressure and Von-Mises equivalent stress along the center of L1 in Fig.3(a)after 107 μs.It is because the effect of adiabatic gases in the relatively confined space of the PBX tablet.The reaction energy couldn't discharge in time and the stress waves propagate in the complex stress state.The stress triaxiality analysis has the ratio of Von-Mises equivalent stress along the center of L1 to the peak pressure of about 0.46.The ratio of Von-Mises equivalent stress along the boundary of L2 to the peak pressure of about 0.29.It shows that the pressure dominates along the L2 boundary,and the region along the center of L1 and along the L2 boundary are two locations with typical pressure state characteristics.
The pressure and Von-Mises equivalent stress evolution contours at different times are shown in Fig.4 and Fig.5,respectively.The evolution of the pressure and Von-Mises equivalent stress during the impact loading shows a near 45°direction propagation due to the combined effects of normal compression and lateral compression.Fig.4 shows that at 30 μs,the specimen is subjected to the extrusion of hammer head and the side boundary.The loading of the stress wave leads to a rapid increase in pressure in the region along the L2 boundary,showing an oblique downward propagation in the direction of nearly 45°.At 50 μs,the specimen is subjected to the downward striking column and the stress wave is reflected to propagate obliquely in the direction of nearly 45°.At 70 μs,the continuous impact leads to an increase in the overall pressure inside the specimen and the trend of overall propagation from L2 boundary along the line to L1.The pressure maximum is reached at 90-150 μs.As shown in Fig.5,the Von-Mises equivalent stress evolution also shows a propagation trend from the boundary to the central region in the near 45°direction.
The results show that the specimen is restrained by the guide sleeve and hammer head impact.The pressure value along the L2 boundary is the largest which may induce damage fragmentation,hot spot and local ignition response.Therefore,the area along the center of L1 and the area along the boundary of L2 are two locations with typical pressure state characteristics in the subsequent study.They are very important for evaluating the safety of explosives under low-velocity impact and establishing sensitivity evaluation indexes.In addition,it is useful to guide the drop weight experiment.Along L1 and L2 should be paid more attentions in the drop weight test.
3.2.2.Damage evolution
Fig.4.Pressure evolution contours at different times.
From the dominant crack expansion criterion,the microcrack growth mode depends on the far-field stress state of the material,which can be divided into five growth modes according to the σ1-σ3stress state,including (I) pure tension;(II) tension shear;(III)simple shear;(IV) shear friction;and (V) friction self-locking.As shown in Fig.6(a)the variation of the average crack size along the upper surface L3 of the PBX specimen.The mode of microcrack growth along L3 is(IV)shear friction,where the shear driving force on the microcrack surface is able to overcome the maximum static friction required for microcrack growth.This is because the hammer head is large enough to destabilize the microcrack and induce rapid growth of the microcrack size.The average microcrack size at the boundary reaches 0.09 cm in 30-90 μs,while the average crack size at the central position is 0.02 cm.The average microcrack size at the boundary and central position increases to 0.27 cm and 0.14 cm in 90-150 μs.The average microcrack size in 30-150 μs shows a trend of nearly 45°growth along the X-axis evolution.The average microcrack size at the L2 boundary grows to the maximum value within 90-150 μs and reaches the maximum damage.
Fig.5.Von-Mises equivalent stress evolution contours at different times.
Fig.6.(a) Average crack size;(b) Microcrack damage at different times;(c) Microcrack damage at different locations;(d) Void fraction at different locations.
The evolution of microcrack damage is shown in Fig.6(b).The damage level of PBX specimen can be divided into four levels according to the percentage of damage (D),Level 1: 0.3 ≤D <0.5;Level 2: 0.5 ≤ D <0.75;Level 3: 0.75 ≤ D <0.9;Level 4:0.9 ≤D ≤1.0.The four damage levels correspond to minor damage,moderate damage,severe damage and complete fragmentation.The microcrack damage time along the L2 boundary (solid line) is faster than that along the L1 center (dashed line).In addition,the value of damage along the L2 boundary is higher.The first moderate damage occurred at 34 μs.The damage value of location point G quickly reached 0.68 while the minimum value of damage at location point E was 0.57.Location point C along the center of L1(dashed line)was the first to reach moderate damage at 50 μs with a value of 0.31.Location A and B had rapid complete fragmentation after 119 μs with damage values as high as 0.91.The reason for the first damage at location C is that the stress wave propagates near 45°and reflects.The reason for the sudden change in the damage value at locations A and B is the duration of the drop weight impact causing the overall fragmentation.
Fig.6(c) and (d) show the microcrack damage and microvoid damage curves at different locations on the X-axis,respectively.From Fig.6(c),the overall damage path of the specimen in the Xaxis propagated a path with nearly 45°direction.Reflection wave propagates to the position C along the center of the specimen.Microcrack damage within 30-110 μs with increasing time damage level reaches a maximum of 0.9 at the boundary,resulting in complete fragmentation.Microcrack damage value of 1 for the entire area of the explosive at 130-150 μs with complete fragmentation.From Fig.6(d),the maximum value of porosity damage is 0.6% relative to the degree of microcrack damage (~1).The damage value caused by porosity at 30 μs was only 0.5% at the location along the center of microviod L1 and along the L2 boundary.The void damage effect was not obvious during the whole process.That is mainly because the pressed PBX tablet was compacted during the impact process,resulting in no obvious changes.
Fig.7 shows the distribution and evolution of microcracks inside the specimen.At 30 μs,secondary moderate damage occurs first at position G along L2.At 30-90 μs,the degree of damage along L2 increases to tertiary damage.Due to the effect of stress wave propagation in the near 45°direction and reflection causes secondary moderate damage to occur at position C along L1.Serious damage along the L2 boundary in 90-110 μs and continue to propagate to the L1 center line.The overall microcrack damage of the explosive reached the maximum at 110-150 μs,indicating the occurrence of complete fragmentation phenomenon.
The results show that the microcrack damage presents a near 45°direction propagation and reflection causing the complete fragmentation of the whole specimen.The damage is most obvious along the L2 boundary and is most likely to form a local high temperature zone and induce ignition.The microcrack damage of pressed PBXs is the dominant damage mechanism duo to the effects of complex stress.
Fig.8.Microcrack hotspots temperature curves at different locations.
3.2.3.Hotspot formation and ignition mechanism
Fig.8 shows the microcrack surface hot spot temperature in PBX tablet.The shear crack is rapidly destabilized and growth at 32 μs due to the confinement of the hammer head and guide sleeve along the L2 boundary (solid line).The frictional heating of the microcrack surface causes temperature sudden change in along the L2 boundary,resulting in a rapid increase in the value of the surface hot spot temperature(Tcr).At 44 μs,the peak point disappears and the melting platform appears.When the complete melting occurs,the rapid viscous flow of the liquid-phase explosive generates heat that causes a secondary increase in temperature.The superposition of the incident and reflected compressive waves leads to the first formation of microcrack hot spot formation time (tcr) and the critical hot spot temperature (Tc) at the location F along the L2 boundary.When the location points E and G are at the peak point,heat conduction plays a dominant role in the formation of the microcrack hot spot formation time(tcr) as well as the critical hot spot temperature(Tc) until the critical hot spot temperature(Tc) is reached at 100 μs.Due to the growth and reflection of the stress wave in the approximate 45°direction,microcrack surface hot spot temperature(Tcr)at location C in the L1 region is the first to change abruptly but does not reach the critical hot spot temperature (Tc).Subsequently,heat conduction plays a dominant role in the temperature until 121 μs later.when the critical hot spot temperature (Tc) is reached along L1 due to the growth of the microcrack surface hot spot temperature(Tcr).The final result is a local ignition phenomenon due to thermal instability.
Fig.7.Microcrack damage evolution contours at different times.
Fig.9.Hot spot temperature at different times: (a) Microcrack;(b) Void collapse.
As shown in Fig.9(a) and Fig.9(b),the microcrack surface hotspot temperature and void collapse hotspot temperature of the PBX tablet at different times along the X-axis are shown,respectively.The microcrack surface hotspot temperature along the X-axis direction of the specimen (Fig.9(a)) shows an approximate 45°growth.The hotspot temperature value of the crack surface along the L2 boundary is higher than the region along the L1 center.At 30-50 μs,the temperature value of the hot spot on the microcrack surface along the L2 boundary reaches 549 K.After 50-130 μs,the temperature value reaches 800 K.Within 100-150 μs,the temperature value of the hot spot on the microcrack surface along the L1 center reaches 675 K due to the growth of the stress wave.At 150 μs,the specimen undergoes local ignition.In Fig.9(b),at 30 μs,the void collapse damage caused a temperature change with a value of 305 K.It is proved again that the change of hot spot temperature on the surface of microcrack is the main reason for the local ignition of PBXs.
Fig.10 shows the distribution and evolution of the hot spot temperature of the microcrack surface within the tablet.In 30-50 μs,the tablet along L2 is subjected to rapid heat generation and stress waves by the extrusion of upper and lower surfaces and lateral direction.The tablet shows a rapid temperature rise in the approximate 45°direction.Local ignition occurs along the center of L1 and the growth path in 110-130 μs.
In summary,the microcrack hot spot temperature shows an approximate 45°direction growth and reflection,causing local ignition at each point along the growth path.The region along the L2 boundary is the first to reach the microcrack hot spot formation time (tcr) and the critical hot spot temperature (Tc) during the whole impact process and induces the local ignition region.Namely the region near to the L2 boundary is the ignition danger region.
3.2.4.Bulk temperature and chemical reaction
Fig.11(a)shows the bulk temperature and time curve along the L1 center and L2 boundary of PBX tablet.The bulk temperature change along the L2 boundary(solid line)is earlier than that along the L1 center (dashed line).The superposition of the incident and reflected compressive waves leads to the first abrupt temperature change of 526 K at the location F along the L2 boundary at 73 μs.Then,the temperature of location E and G change abrupt at 116 μs.The wave loading effect led to a sudden change in temperature at location C along the L1.Then,the temperature of L1 center line change abrupt.The bulk temperature inside the PBX explosive reached a maximum of 526 K which did not reach the thermalignition temperature of the explosive.
Fig.10.Microcrack hotspots temperature distribution and evolution contours at different times.
Fig.11.Bulk temperature variation curve: (a) With time;(b) Along the X-axis.
Fig.12.Bulk temperature distribution and evolution contours at different times.
Fig.11(b)shows the bulk temperature variation along the X-axis within the PBX tablet at different times.The bulk temperature change in the black dashed line shows an approximate 45°directional path growth where the magnitude of temperature change is the most pronounced.In 70 μs,L2 boundary along the first temperature rise.Until 150 μs,the bulk temperature of the explosive maximum value is 550 K that not reached the explosive thermal-ignition temperature.
Fig.12 shows the bulk temperature rise distribution and evolution contours in PBX tablet at different times.At 70 μs,the position point E along L2 starts to change because the lateral extrusion of the upper and lower surfaces of the hammer head and the guide sleeve.During 70-110 μs,the bulk temperature along L2 is obvious growth in an approximate 45°direction from the L2 boundary to the L1 center.Finally,the bulk temperature inside the explosive increases within 110-180 μs.
Fig.13(a) shows the bulk reaction fraction (λ) after ignition at different positions of PBX tablet.At 70 μs,the position f along the L2 boundary takes the lead in reaction.The position F reaches the formation time of microcrack hot spot and the critical hot spot temperature.The bulk reaction fraction is 4.2%.With the progress of the chemical reaction,the chemical reaction begins at points E and G along the L2 boundary.At 136 μs,position C reacted first.The overall response law shows that the fraction along the L2 boundary is higher than that along the L1 center.The reaction time along the L2 is faster,because the accumulation of chemical reaction heat in the impact process increases the bulk temperature and increases the reaction fraction.The growth of the reflection wave makes the reaction at position F and subsequent position C take the lead.Then,other positions begin to increase the reaction fraction.Fig.13(b)shows the bulk reaction fraction(λ)of PBX tablets at different times along the X-axis after ignition.Along the whole X-axis,the bulk reaction fraction along the L2 boundary is 4.2%that higher than the L1 center.With the progress of chemical reaction,the growth path of the bulk reaction fraction presents a trend of nearly 45°and evolution from the boundary to the center.In addition,the response of bulk reaction fraction continues to increase with continuous loading.At 150 μs,the maximum bulk reaction fraction is 4.6%.
Fig.14 shows the bulk reaction fraction contours at different times after ignition occurs in the PBX tablet.At 70 μs,position F is in the ignition slow reaction stage.At this time,the region with higher bulk reaction fraction is mainly concentrated at the boundary of the tablet.As the chemical reaction progresses,the region with higher reaction fraction gradually spreads from the boundary to the center position.It is the first to growth to position C in the direction of nearly 45°.The bulk reaction fraction reaches the maximum within 150-180 μs.
3.2.5.Sensitivity evaluation
The above results were analyzed by means of numerical simulations of the process of how each reaction stage induces ignition during the drop weight tests.The results show that the PBX tablet mainly undergoes deformation,fragmentation,local hotspot,ignition and other during the whole loading duration,as shown in Fig.15.
During the drop weight impact process,the initial kinetic energy of the drop weight will be transformed into tablet deformation energy (ED),crushing energy (EC),local hot spot energy(ELhs),local ignition energy(ELi)and other energy(EO)as shown in Eq.(13).The initial energy is given by the kinetic energy theorem EK=1/2Mv2=50.625 J(where the impact velocity is 4.5 m/s)and the deformation energy (ED) is the energy required for the deformation of the tablet.Crushing energy(EC)is the energy required for complete crushing of the four damage levels to occur;local hot spot energy (ELhs) and local ignition energy (ELi) is the energy required for the tablet to reach the critical hot spot temperature (Tc);other energy (EO)is the energy required for the overall temperature rise of the tablet within the peanut chemical reaction,etc.In addition,comparing the average loading pressure and temperature values collected during the experiment,the pressure values at fixed points in the hazardous area can be tested,and sudden changes in pressure values indicate local ignition of the explosive.By analyzing the hot spot temperature on the microcrack surface,when the critical hot spot temperature (Tc) is reached,a local hot spot is formed followed by ignition.Based on the phenomenon of local ignition when the initial energy value of the pressurized PBX reaches 50.625 J or the pressure value changes abruptly or reaches the critical ignition temperature,a sensitivity evaluation criterion including the initial stimulation energy(EK),pressure value(P),and critical hot spot temperature (Tc) is established in this paper.Changed the explosives sensitivity is not “0''that is “1''evaluation method,to guide the transport,storage,use of explosives to provide a new method,further improve the sensitivity of explosives evaluation guidelines.
Fig.13.Bulk reaction fraction: (a) At different locations;(b) Along the X-axis at different times.
Fig.14.Bulk reaction fraction contours within the tablet at different times.

3.3.The effects of impact velocity on damage-ignition response
The impact velocity of drop weight will affect the energy localization and hot spot formation process.Therefore,the study of the critical velocity inducing the ignition of PBX explosive is of great significance to predict and evaluate the impact sensitivity of explosive.Through the analysis of the whole process response of PBX explosive loaded under the initial condition of 4.5 m/s,it is clear that the two most obvious regions are along the L1 center and L2 boundary.The microcrack at point F along L2 takes the lead in instability growth and the growth mode is (Ⅳ) shear friction.Because the friction heat generation rate of micro-defects is positively correlated with its growth rate,the L2 line is the most vulnerable region to form micro-crack hot spots and induce ignition response.The micro-crack hotspot is generated due to the wave growth and loading.The micro-crack damage growth path first propagates from the L2 boundary to point C along the L1 center.Therefore,we continue to study the whole process response characteristics of pressure and hot spot temperature on the surface of micro-cracks at position F and position C at different impact speeds (4.0 m/s,4.5 m/s,6.3 m/s,7.7 m/s,8.9 m/s and 11 m/s).
Fig.15.Evolution of the whole impact process of PBX tablet.
Fig.16.Pressure-time curves at position C and position F for different impact velocities.
3.3.1.Stress evolution
Fig.16 shows the pressure-time curves at position C and position F of PBX explosive at different impact velocities.According to Fig.16(a) and Fig.16(b),when the impact velocity is 4.0 m/s,the pressure values at position C and position F have not changed suddenly,indicating that the explosive has not ignited at this time.When the impact velocity is greater than 4.5 m/s,the sudden change of pressure value(at the red circle)occurs at position C and position F at 113 μs and 98 μs respectively,indicating that the explosive ignited.With the increase of impact velocity to 11.0 m/s,the sudden change time of position C and position F is earlier at 80 μs and 54 μs,indicating that the ignition time is earlier and the pressure value is greater with the increase of impact velocity or impact energy.For example,when the impact velocity is 7.7 m/s,the pressure values of position C and position f suddenly change at 104 μs and 97 μs respectively,and the corresponding pressure values are 503 MPa and 542 MPa.
Fig.17 shows the pressure distribution and evolution contours of PBX explosive under different impact velocities at 80 μs.The pressure value along L2 always reaches the maximum first and gradually propagates to the position along the center due to wave growth under different impact velocities.When the impact velocity is 8.9 m/s,the position point F first reaches the microcrack hotspot temperature and then induces the local ignition response;When the impact velocity is 11.0 m/s,both position F and position C reach the microcrack hotspot temperature and induce local ignition response.
Fig.17.Pressure distribution and evolution contours at different impact velocities at 80 μs.
Fig.18.Temperature-time curves of microcrack hotspots (a) position C and (b) position F at different impact velocities.
In summary,the location point F (along L2) is the most dangerous location where the sudden change of pressure value and the ignition response occurs.The impact velocity of 4.0-4.5 m/s is the critical ignition critical impact velocity.
3.3.2.Hot spot-ignition response
Fig.18(a) is the temperature-time curve of micro-crack surface at position F in PBXs under different impact velocities (4.0 m/s,4.5 m/s,6.3 m/s,7.7 m/s,8.9 m/s and 11 m/s).After the PBX tablet is initially impacted,the micro-crack inside the tablet develops rapidly and the friction heat on the micro-crack surface increases surface temperature rapidly.When the impact velocity is 4.0 m/s,the micro-crack surface temperature increases rapidly to the peak value of 449 K in 55 μs and then decreases gradually due to heat conduction.When impact velocity increases to 6.3 m/s,the microcrack surface temperature increases to the melting point to form a platform,corresponding to the local melting process (T1≈519 K).When the micro-crack surface is completely melted,the chemical reaction and the release heat of rapid viscous flow in liquid phase surrounded by the crack induce the temperature increase for the second time.With the continuous increase of temperature,the chemical reaction heat gradually plays a dominant role and the thermal instability characteristics appear in the temperature curve,so as to determine the micro-crack hot spot formation time (tcr).When impact velocity increases to 7.7 m/s,8.9 m/s and 11.0 m/s,shear friction occurs rapidly at position F with the rapid progress of chemical reaction.The micro-crack surface temperature increases to the melting point and then the temperature increases again,showing the characteristics of thermal instability.Finally,the temperature reaches the micro-crack hot spot temperature and then local ignition occurs.For example,at 8.9 m/s,the micro-crack surface hotspot temperature occurs at 44 μs.Then,at 60 μs,the chemical reaction heat promoted the temperature to rapidly increase to the micro-crack hotspot temperature,resulting in local ignition.
From Fig.18(b) that the time of unstable growth of microcrack and rapid rise of microcrack surface temperature at position C is slower than the position F due to wave growth.When the impact velocity is 4.0 m/s,the surface temperature of the explosive increases at 139 μs due to the friction and shear action of the microcrack surface.Until 182 μs,the surface temperature of the microcrack increases to 499 K and then the temperature gradually decreases due to heat conduction which does not reach the explosive melting point temperature.When the impact velocity increases to 6.3 m/s,the surface thermal temperature of microcrack begins to increase at 55 μs.At 101 μs,due to the reflection of loading wave and friction shear,the temperature increases rapidly to the melting point platform for the second time.The local melting process of explosive occurs.When the microcrack surface is completely melted,the heat released by the chemical reaction and the rapid viscous flow of liquid phase inside the microcrack increases the temperature for the third time.With the continuous increase of temperature,the chemical reaction heat gradually occupies the dominant role.The temperature curve appears thermal instability,reaches the microcrack hot spot temperature and local ignition occurs.With the increase of impact velocity and impact energy,the hotspot temperature curve on the surface of microcracks shows the characteristics of thermal instability and the time for the formation of hot spots to reach the ignition state is faster.For example,when the impact velocity is 7.7 m/s,8.9 m/s and 11.0 m/s,the time is 115 μs,82 μs and 68 μs respectively.
According to the location of microcrack hot spot formation time(tcr) and critical hot spot temperature(Tc),a representative time is selected to analyze the contours at 115 μs.Fig.19 shows the distribution and evolution of hotspot temperature on the microcrack surface of PBX explosive at different impact velocities at 115 μs.As shown in the figure,the black dotted arrow shows the hotspot growth path on the microcrack surface due to the incident and reflection of loading wave.The green area represents that the microcrack surface is melting(T1 ≈519 K).At 4.5 m/s,the ignition occurs first in the region of position F (T2 ≈519 K).When the velocity is 7.7 m/s,the local ignition occurs first in the region of position F and propagates along the microcrack growth path to the position C.At 11.0 m/s,the whole explosive basically ignites.At this velocity,the explosive has rapid shear friction expansion and chemical reaction and the heat generated by surface friction and chemical reaction exothermic accumulates rapidly.
In summary,the location point F (along L2) is the first to reach the crack hotspot formation time(tcr)as well as the critical hot spot temperature(Tc)and then induce the dangerous location of ignition response.The velocity of 4.0-4.5 m/s is the critical ignition critical impact velocity.
4.Conclusions
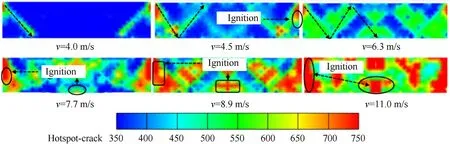
Fig.19.Microcrack surface temperature contours at 115 μs at different impact velocities.
In this study,a coupled microcrack-microvoid mechanicalthermo-chemical model of PBXs was applied to investigate the deformation,fragmentation,hotspot,local ignition,bulk temperature and chemical fraction responses under the drop weight impact.A sensitivity evaluation criteria was established.The damage-ignition mechanism with different velocities was carried out according to the new sensitivity evaluation criteria.The main conclusions were listed as follows.
(1) In the drop weight impact process,L1 center and L2 boundary along the region in pressed PBX tables are two locations with typical pressure state characteristics.The L2 boundary along the line is the first ignition hazard region.
(2) The wave propagates from the L2 boundary to the L1 center in a direction of nearly 45°,resulting in a damage ignition response from the boundary to the central region.
(3) Shear crack friction heating is the dominant ignition mechanism in the drop-weight impact.
(4) A sensitivity evaluation criteria accounting for initial stimulation energy (EK),pressure value (P) and critical hot spot temperature (Tc) was established.
(5) Local ignition occurs when the initial stimulation energy is greater than 50.625 J.The pressure increases abruptly and reached the critical hotspot temperature under the different impact velocities.The critical local ignition impact velocity was 4.0-4.5 m/s.
Declaration of competing interest
The authors declare that they have no known competing financial interests or personal relationships that could have appeared to influence the work reported in this paper.
Acknowledgements
The authors would like to thank China National Nature Science Foundation (Grant No.11872119) and Foundation Strengthening Project (Grant No.2020-JCJQ-GFJQ2126-007) and Pre-research Program of Armament (Grant No.6142A03202002) and China Postdoctoral Science Foundation (Grant No.BX20200046) for supporting this project.
杂志排行

Defence Technology的其它文章
- Experimental and numerical analysis on suitability of S-Glass-Carbon fiber reinforced polymer composites for submarine hull
- Damage response of conventionally reinforced two-way spanning concrete slab under eccentric impacting drop weight loading
- Analysis and design for the comprehensive ballistic and blast resistance of polyurea-coated steel plate
- Positive effects of PVP in MIC: Preparation and characterization of Al-Core heterojunction fibers
- Flight parameter calculation method of multi-projectiles using temporal and spatial information constraint
- Relationships between distribution characteristics of ceramic fragments and anti-penetration performance of ceramic composite bulletproof insert plates