Power Plant Indicator Light Detection System Based on Improved YOLOv5
2023-01-07YunzuoZhangKainaGuo
Yunzuo Zhang, Kaina Guo
Abstract: Electricity plays a vital role in daily life and economic development. The status of the indicator lights of the power plant needs to be checked regularly to ensure the normal supply of electricity. Aiming at the problem of a large amount of data and different sizes of indicator light detection, we propose an improved You Only Look Once vision 5 (YOLOv5) power plant indicator light detection algorithm. The algorithm improves the feature extraction ability based on YOLOv5s. First, our algorithm enhances the ability of the network to perceive small objects by combining attention modules for multi-scale feature extraction. Second, we adjust the loss function to ensure the stability of the object frame during the regression process and improve the convergence accuracy. Finally, transfer learning is used to augment the dataset to improve the robustness of the algorithm. The experimental results show that the average accuracy of the proposed squeezeand-excitation YOLOv5s (SE-YOLOv5s) algorithm is increased by 4.39% to 95.31% compared with the YOLOv5s algorithm. The proposed algorithm can better meet the engineering needs of power plant indicator light detection.
Keywords: You Only Look Once vision 5 (YOLOv5); attention module; loss function; transfer learning; object detection system
1 Introduction
With the development of science and technology,electricity has become indispensable in life and is essential for both economic development and scientific research [1, 2]. The power plant converts raw energy into electricity to power fixed facilities, and the indicator lights of power plant reflect its working status. It not only has an impact on lives and work of residents but also causes serious financial mishaps and losses when the power plant malfunctions. To ensure the regular operation of the power plant, it is necessary for us to regularly test the indicator lights configured in the power plant [3-5].
The traditional indicator light detection methods are mainly purely manual detection methods. The environmental, geographic, and human factors affecting manual detection methods lead to low inspection efficiency, a heavy effort, and a lot of laborers and material resources [6]. These methods may not be able to distinguish the color of the fault light, or it may even misdetect or miss detect, especially in the case of insufficient light. Therefore, a method of intelligent indicator light detection needs to be established to analyze the detection results of power plant indicator lights to ensure the accuracy and efficiency of detection.
Object detection is a method of marking objects with rectangular boxes in an image sequence. It is divided into two subtasks, identifying the type of object in image and determining the coordinates. Traditional object detection faces issue of high complexity, window redundancy, and poor robustness [7].
With the rapid development of artificial intelligence, methods based on deep learning are widely used in object detection. Traditional hand-driven feature extraction has become datadriven [8, 9]. There are two main object detection methods based on deep learning, namely fast-region convolutional neural network(RCNN) [10] and Faster-RCNN [11] based on two-stage algorithms, and single shot multibox detector (SSD) [12] and You Only Look Once(YOLO) [13-18] based on one-stage algorithms.Although the algorithms based on two-stage have high precision, the calculation speed is low. And it is difficult to apply in scenarios with high realtime requirements. Among the algorithms based on one-stage, the YOLO treats the detection task as a regression task, and directly returns the type and coordinates of the object [19]. Therefore, its calculation speed is higher than RCNN and SSD algorithms. You Only Look Once vision 5(YOLOv5) uses Generalized Intersection over Union (GIoU) as the loss function, adding adaptive anchor box calculation and adaptive image scaling. At the same time, YOLOv5 adds a Focus structure and a cross stage partial (CSP) structure to the network structure, providing different network depths and widths for different network modules.
We have the following contributions. 1) We fully use the advantages of the YOLOv5, which is combined with the characteristics of the power plant indicator light detection task, and combine the attention module to enhance the feature extraction ability of the network. 2) The loss function Complete Intersection over Union(CIoU) is to improve the stability of the object frame in the regression process. 3) The dataset is augmented with transfer learning methods to enhance the robustness of the proposed algorithm. Experimental results show that the proposed algorithm can quickly and accurately detect the indicator lights of power plants, which better meet the needs of current industrial applications.
2 Improved YOLOv5 Algorithm
The power plant indicator light has the characteristics of significant size change and different light and dark. The YOLOv5s module cannot adequately meet the detection needs. Therefore,we propose an improved SE-YOLOv5s module,which improves the object detection accuracy by introducing the attention module, transfer learning, and adjusting the loss function strategy.
2.1 SE Attention Module
An image recognition structure, squeeze-and-excitation networks (SENet), which enhances the network feature expression was proposed in [20].SENet models the correlation among feature channels to improve the feature extraction ability of the network. This method strengthens important features and weakens invalid features to improve the feature extraction ability of the network. The implementation process of SENet is divided into two steps: squeeze and excitation.The SENet adopts fully connected layers (FC)and rectified linear unit (ReLU), which is shown in Fig. 1.
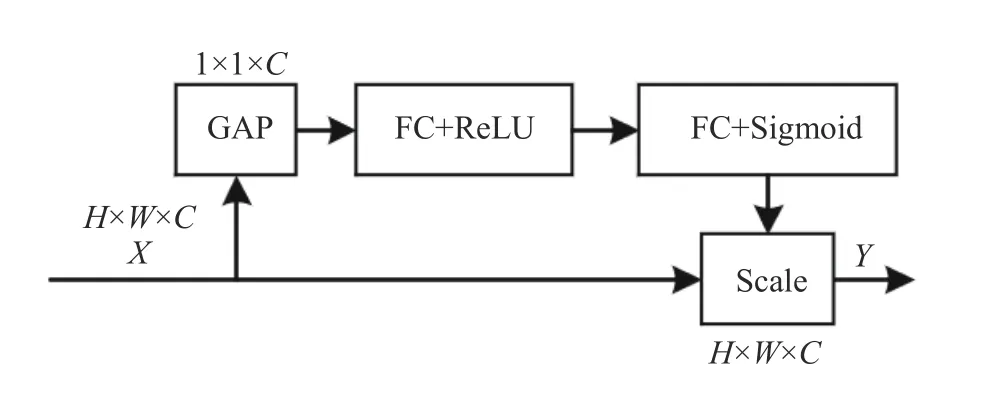
Fig. 1 The structure of SENet
SENet is plug-and-play, which has a small number of new parameters and calculations.SENet pays more attention to the information encoding among channels to improve the multiscale feature extraction ability of the network.We add SENet to the spatial pyramid pooling(SPP) module of the YOLOv5s backbone feature extraction network to form the SE_SPP module to enhance the detection of the network for small objects. The network structure is shown in Fig. 2.
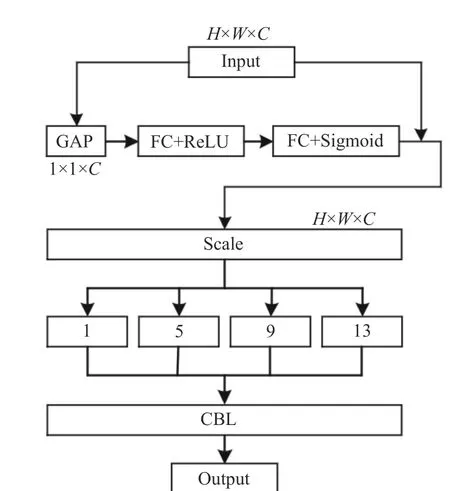
Fig. 2 The structure of SE_SPP

Fig. 3 The network of improved SE-YOLOv5s
The SE_SPP uses global average pooling on the input feature map to make it have a global receptive field. Fully connected layers (FC) are used to model correlations among channels. The required features are extracted by controlling the size of the Scale. Specifically, for the inputxc(i,j),a feature map of size 1 ×1×Cis output by using global average pooling (GAP)

whereXcis the feature map output by the standard convolution operator, theWandHare the width and height of the feature map respectively.Then, two FCs are used to compress the channels to reduce the computational cost and restore the number of channels to use the correlation among channels to train the Scale. Finally, the Scale is limited to the range [0, 1] by sigmoid.Scale is multiplied ontoCchannels ofXcas the input data of the next level. The pooling kernel performs 1×1, 5×5, 9×9 and 13×13 max-pooling operations on the input features respectively, and splices the feature maps to output. The overall network structure of the improved SE-YOLOv5s is shown in Fig. 3, and the method of data normalization is batch normalization (BN).
2.2 Loss Function
Loss function of YOLOv5 is divided into three parts, namely classification lossLcla, localization lossLlocaand confidence lossLcon. The loss function of YOLOv5 is calculated as follows

whereLclais used to calculate the loss between the predicted box and ground truth, andLlocais used to calculate the loss between the predicted box and the calibration box.
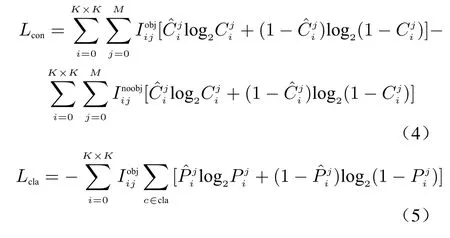
The feature map output by the network is equally divided intoK×Kblocks of size. Confidence loss and classification loss functions [21]are calculated as

As shown in Fig. 4, the red solid line box is the ground truth boxG, and the blue solid line box is the prediction boxP. We denote the smallest convex closed boxCcontainingGandPwith grey dashed lines. In the figure,cis the diagonal length ofC, anddis the length of the line connecting the center point ofGand the center point ofP.
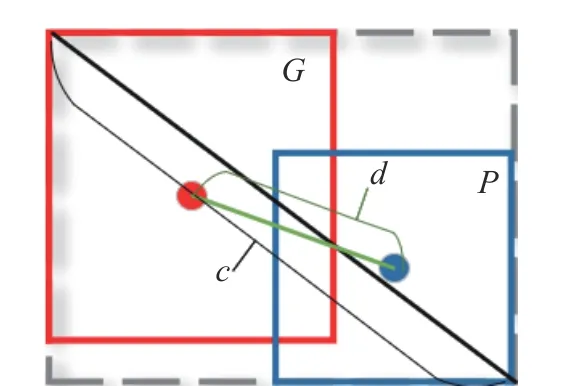
Fig. 4 Predicting box and ground truth box
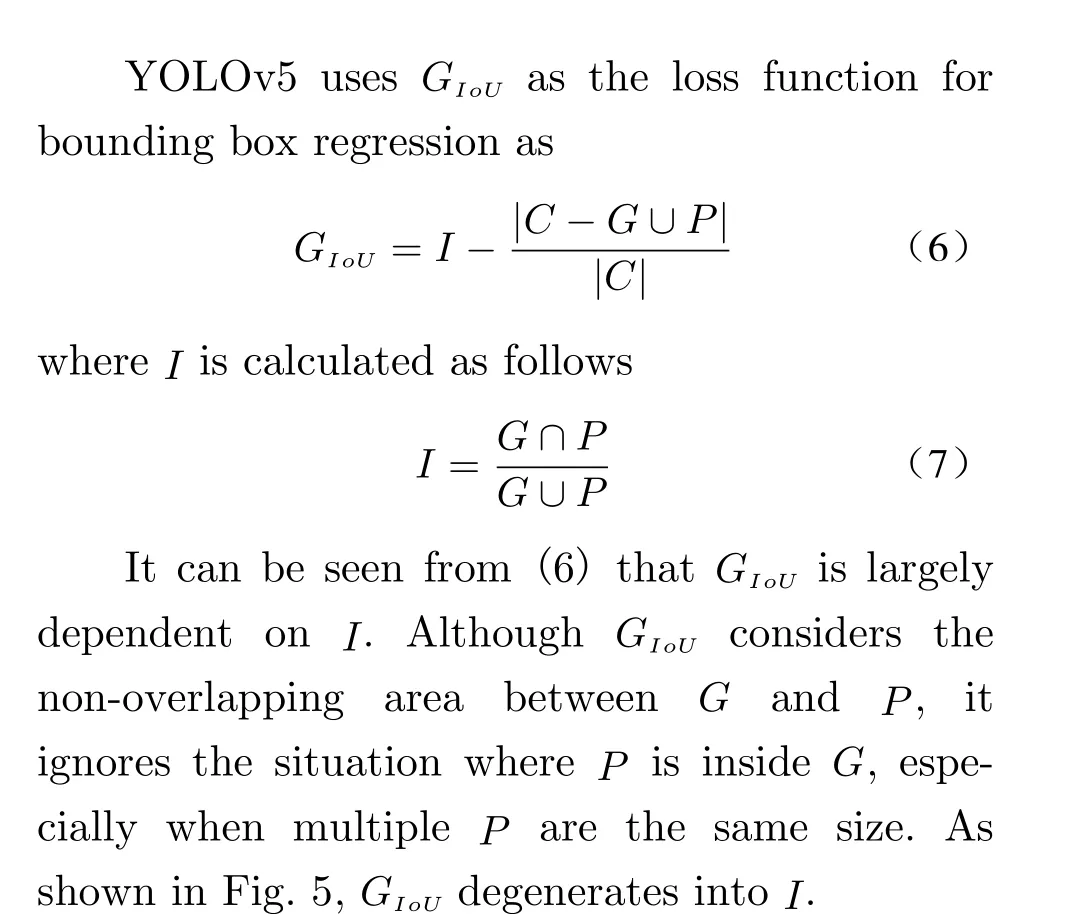
CIoU[22] usesαas a balance parameter andνto measure the consistency of the aspect ratio,which is sensitive to scale. Therefore, this paper choosesCIoUas the regression loss function, and it is calculated as follows
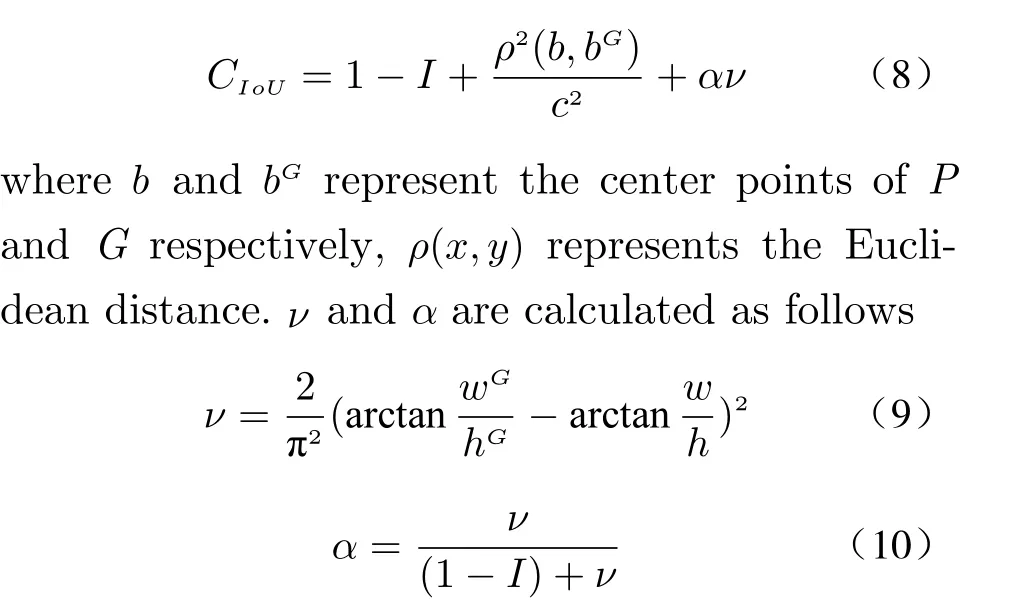
wherewGandhGare the width and height ofGrespectively,wandhare the width and height ofPrespectively. The overlapping area factor has a higher priority usingCIoUduring regression,which produces more stable object frame and higher convergence accuracy in regression process.
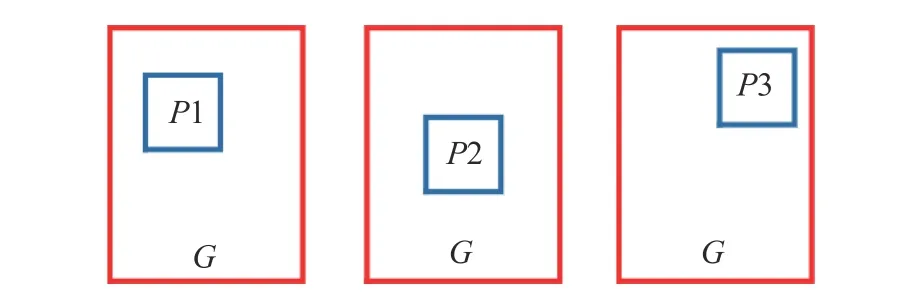
Fig. 5 Schematic diagram of GIoU degradation to I
2.3 Transfer Learning
The dataset in this paper comes from news videos or images in the network, which are relatively rare and difficult to collect. Therefore,transfer learning is adopted to assist the training of traffic lights as positive samples of power plant lights. The dataset is extended to 1 500 images by scaling, rotating, transforming saturation, etc.LabelImg is adopted to label the dataset for network training. Fig. 6 shows the process of expanding the dataset.
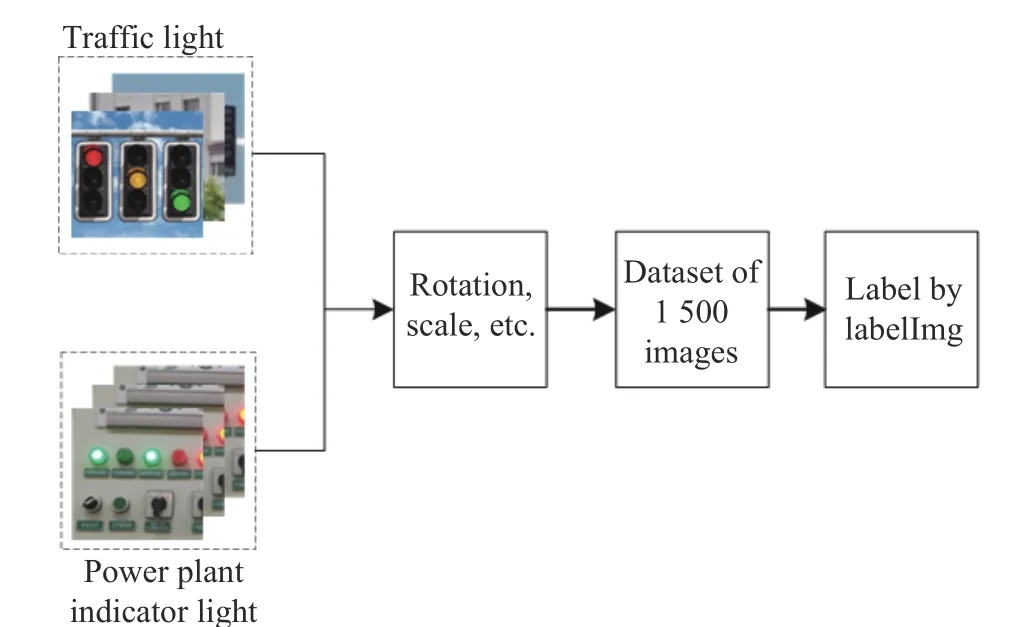
Fig. 6 Flowchart of expansion dataset
3 Experiment Analysis
3.1 Evaluation Metrics
Experiments are conducted on Windows 10,Intel(R) Core(TM) i7-8750HQ, NVIDIA GeForce GTX 1 060, and 16 GB memory. The compute unified device architecture (CUDA)version used in the experiment is 10.1, the NVIDIA CUDA deep neural network library(cuDNN) version is 7.6.5, and the framework is PyTorch. The dataset is converted into voc format training to divide the training set and the test set with division ratio 9:1. After configuring the parameters of the training module, the command to start training is input by the terminal.We set the initial training times to 100 epochs,the batch size to 4, and the input image size to 640×640.
We use mean Average Precision (mAP) and Frame Rate (FR), which are widely used in object detection evaluation, as the evaluation metrics for the experiments. The mAP is calculated from precision and recall. The formulas for calculating the mAP, precision (P), and recall(R) are as follows
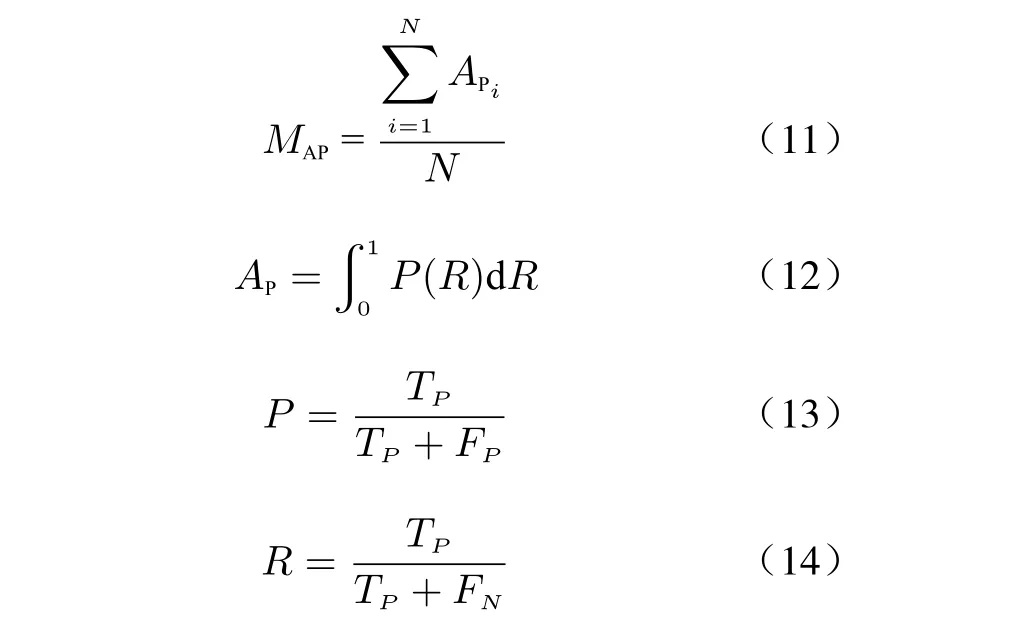
whereMAPrepresents mAP,APiandAPrepresent average precision,Nrepresents the total number of detection categories,TPrepresents the number of detected indicator light,FPrepresents the number of detected objects that do not contain indicator lights, andFNrepresents the number of indicator light objects that have not been detected.
3.2 Experimental Comparison
We compare our modules with some recent stateof-the-art methods including SSD and YOLOv5s.The average accuracy (mAP@0.5) with 0.5 Intersection over Union (IoU), the average mAP of different IoU (mAP@0.5:0.95) and the calculation speed were used as the evaluation indicators of module performance. The results are shown in Tab. 1.

Tab. 1 Experimental results
Tab. 1 shows that proposed module reaches higher mAP 95.31%, which is higher 4.39% than SSD and YOLOv5 with 0.5 IoU. The SEYOLOv5s also has higher mAP than the comparison module and reaches 64.79% when IoU changes from 0.5 to 0.95. The processing speed of the proposed module is slightly reduced since the introduction of the SENet module increases the number of parameters. However, the FR of the proposed module reaches 24.93, which can meet the requirements of real-time performance. The mAP of the SE-YOLOv5s is 4.2% higher than YOLOv5s in the natural environment. The proposed module has achieved a significant improvement in accuracy compared with the comparison methods when the calculation speed is comparable. It is effective in the task of indicator light detection in power plants.
3.3 Experimental Results and Analysis

Fig. 7 The training results of the proposed algorithm module: (a) precision; (b) recall; (c) mAP@0.5; (d) mAP@0.5:0.95
The improved module training results are shown in Fig. 7. Fig. 7(a) and Fig. 7(b) show the curves of the precision and recall of the power plant indicator light detection with SE-YOLOv5s respectively. The horizontal axis represents the number of training rounds, and the vertical axis represents the precision and recall respectively. It can be seen from the figure that with the increase of the number of epochs, the precision and recall gradually increase and remain stable to a higher value, which fully shows that the SE-YOLOv5s has excellent feature extraction ability for power plant lights detection.
Fig. 7(c) shows the mAP for IoU with 0.5.Fig. 7(d) shows the mAP when IoU changes from 0.5 to 0.95. The horizontal axis in the figure represents the number of training rounds,and the vertical axis represents the corresponding mAP. As can be seen from the figures, as the number of training epoch increases, the mAP@0.5 of the module reaches 95.31%, which has outstanding detection performance.
Fig. 8 and Fig. 9 show the detection results of the SE-YOLOv5s on the indicator lights of the power plant. It can be clearly seen from the figures that the proposed module can accurately detect indicators of different sizes. The module has excellent robustness and can successfully recognize the various indicator lights in the power plant even under dim lighting conditions. Experimental results show that the SE-YOLOv5s can well meet the needs of power plant for indicator light detection.
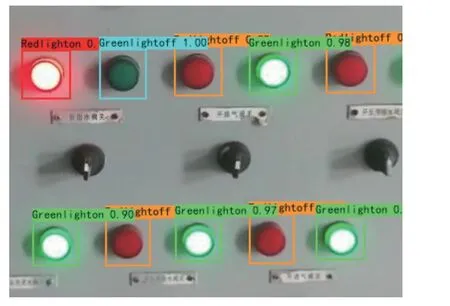
Fig. 8 Indicator light detection result A
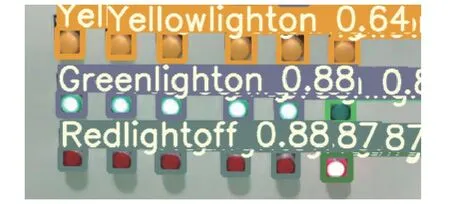
Fig. 9 Indicator light detection result B
4 Conclusion
This paper proposes an improved YOLOv5s algorithm for indicator light detection of the power plant. SENet is added to the backbone network for multi-scale feature extraction to improve the detection accuracy of the network, and generates a series of feature maps with different scales. CIoUis adopted as loss function to improve the convergence accuracy of the object box in the regression process. The robustness of the algorithm is improved by augmenting the dataset with transfer learning. Experimental results show that the mAP of the SE-YOLOv5s on the test set reaches 95.31%, which is higher than the state-of-the-art algorithms and meets the requirements of intelligent detection of power plant lights.
杂志排行
Journal of Beijing Institute of Technology的其它文章
- Distributed Privacy-Preserving Fusion Estimation Using Homomorphic Encryption
- Sub-Regional Infrared-Visible Image Fusion Using Multi-Scale Transformation
- Adaptive Sampling for Near Space Hypersonic Gliding Target Tracking
- Distributed Radar Target Tracking with Low Communication Cost
- Airborne GNSS-Receiver Threat Detection in No-Fading Environments
- Model Predictive Control Based Defensive Guidance Law in Three-Body Engagement
