Geochemistry and crystal shape, size and spatial distribution in arc-related gabbro, Urmia, NW Iran
2022-12-22MonirModjarrad
Monir Modjarrad
Abstract The mafic intrusive Moskin and Parvaneh regions in the northwest and south of Urmia were investigated for their geochemistry and petro-physical properties such as size,shape,and spatial distribution of their crystals.This type of study can be a powerful tool for analyzing the history of magma crystallization, along with geochemistry examinations.The gabbroic calc-alkaline rocks, with the Early Cenozoic is the relative age, consist of coarse plagioclase and amphibole with rare clinopyroxene and olivine in the Sanandaj–Sirjan zone at sedimentary-structural subdivisions of Iran.The depletion of HFSEs and enrichment of LILEs as arc-related rocks, as well as lower crust contamination (Nb/Th and K/Ce) symptoms, show that these gabbros formed at the continental arc setting from an enriched source.Considering the geographical position and relative age of the gabbros, they possibly outcropped during the Neo-Tethys subduction processes after the enrichment by considerably lower crust effects.The amphibole and plagioclase crystals with considerable abundance show linear crystal size distribution (CSD) patterns with a slope of (- 1/Gt) - 3 to - 4 for amphiboles and plagioclase except for Parvaneh plagioclase which shows - 16.The annealing (Ostwald ripening) caused the convex CSD on the small grains part at Parvaneh gabbro.Therefore, the ratio of nucleation to growth rates (J/G)for these minerals is 5–6 times, only for Parvaneh plagioclase is ten times which numerous nuclei were made by a significant degree of overstepping in the rocks.There is no magma mixing evidence because of the linear (one population of crystals)CSD patterns.The shape of amphibole crystals in gabbros is bladed(with S/I = 0.4–0.5 and I/L = 0.1–0.3)and bladed to tabular for plagioclase(S/I = 0.4 and I/L = 0.6–0.7).The spatial distribution patterns (SDPs) are calculated from a big R-value based on the nearest neighbor’s theory for amphibole and plagioclase crystals, confirming clustered SDP for all of them.Also,the dihedral angle measurements(between amphibole and plagioclase grains) display that solid-state equilibrium is prevailing in the rocks.In this study, we tried to establish a relationship between geochemistry and petro-physical results and investigate the evolution of igneous rocks more accurately and all-inclusive.We should not neglect the importance of quantifying the texture of rocks.
Keywords Gabbro ∙Lower crust ∙CSD ∙SDP ∙DA ∙
1 Introduction
The Urmia intrusive suit is located within the NW part of the Sanandaj–Sirjan structural zone of Iran,a NW–SE zone which belongs to the 1500 km long Zagros orogenic system, between the Urmia–Dokhtar magmatic arc and the folded Zagros thrust belt(Alavi 1994)(Fig.1).The Zagros orogenic system, the Iranian part of the Tethys orogenic belt.It was formed by the subduction of Neo-Tethys oceanic crust and the subsequent continental collision between Gondwana and Eurasia from Mesozoic to Tertiary time (Berberian and King 1981; Ricou 1994).The Sanandaj–Sirjan zone is considered metamorphic rocks which are associated with several plutons and widespread Mesozoic volcanism (Mohajjel et al.2003a, b).Intrusions are well developed from northwest (Urmia) to southeast (Golpiehgan) extending beside ca.800 km (Fig.1).
Understanding the formation and transfer of crustal melts is essential for concluding continental crust fractionation methods(McMillan et al.2003).In this study,we focus on the hornblende-gabbros around Urmia to determine its tectonic setting and crystallization processes of it.In many cases, arc cumulate gabbros are physically and chemically related to the gabbro-diorite (basalt-andesite)fractionation process and have evidence of crystal segregation that plays a vital role in their petrogenesis (Beard 1986).Some studies demonstrated that most arc-related calk-alkaline rocks typically formed in places where stress is eliminated during the post-collision phase (Fan et al.2003; Guo et al.2001).
Nonetheless, hornblende-bearing gabbroic rocks (in the form of xenolith or intrusion) are less common in subduction-related magmatic collections and indicate fractional magmatic processes in arc magma (Heliker 1995;Hickey-Vargas et al.1995).The main phase in the subduction regions gabbroic rocks, hornblende, maybe as primary phase crystallized from hydrous mafic magma(Beard and Borgia 1989) or a reaction product of primary minerals such as olivine, pyroxene, and plagioclase with the water-saturated phase in the interaction between the melt/hydrous fluid (Costa et al.2002).
The texture of a rock provides valuable information about the physical processes involved in the rock formation, parameters such as size (Moazzen and Modjarrad 2005; Modjarrad 2015; Modjarrad and Sheykhbaglou 2016), shape, and spatial distribution of crystal patterns(CSD and SDP) and Dihedral angle (DA) measurements considered in this regard need measured.Of course, work on SDP and DA is much more limited,and how to measure or interpret it is still unclear.We must combine such data with geochemical results to draw perfect conclusions about rock generation.This type of study is time-consuming but could be a powerful tool for analyzing the history of magma crystallization along with geochemistry examinations.
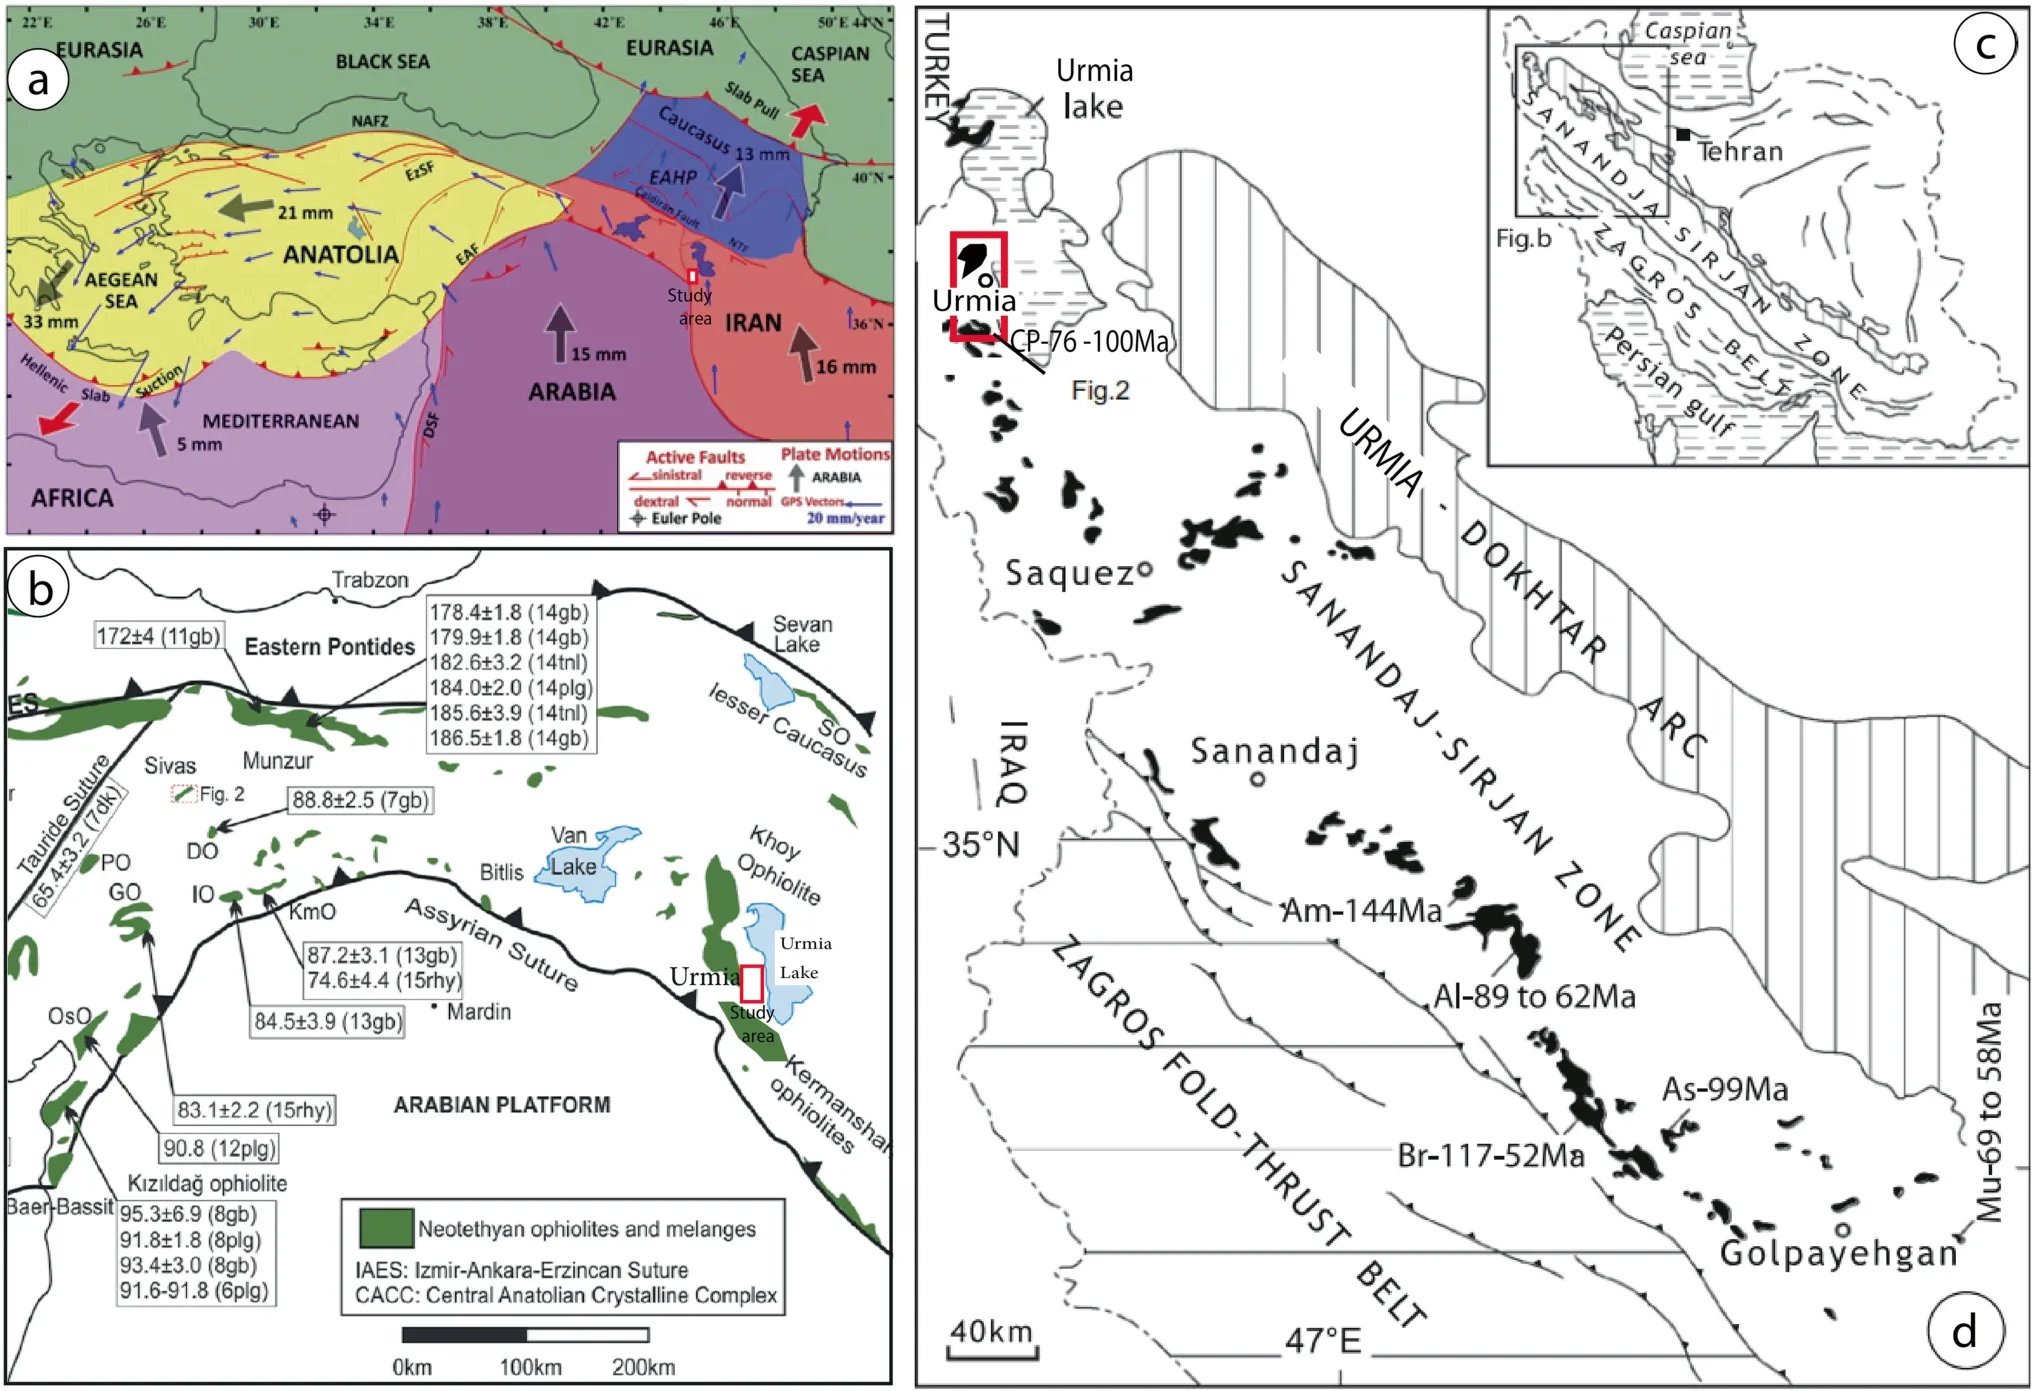
Fig.1 a, b Location of Northwest of Iran (study area) in large scale geodynamic map of the region in relation to the Neo-Tethys subduction between Arabian plate and Central Iran micro-continents.c The Zagros orogenic belt position in Iran (Alavi 1994).d The Urmia–Golpaiehgan Plutonic Belt(in black)in the Sanandaj–Sirjan zone and location of dated samples.The abbreviations CP,Mu,As,Br,Al and Am refer to name of plutons Chir-Mokin (this study), Muteh, Astaneh, Boroujerd, Alvand and Almoqolaq respectively, and numbers gives the results of age determination.The red box (study area) is illustrated in the Fig.2

Fig.2 Simplified geological maps of the study areas using 1:100,000 geological map of Serow (Moskin), north of Urmia (Sabziei et al.2004), and 1:100,000 geological map of the Oshnavieh (Parvaneh),south of Urmia(Naghizadeh 2004)with structural zone determination of Ghasemi and Talbot (2006) at the middle part
2 Geological setting
The intrusive complex of Urmia in the north-west of the Sanandaj–Sirjan zone (with the Mesozoic-tertiary age igneous belt within the metamorphic rocks) and the north and south of the Urmia city (Fig.1) is a part of the Neo-Tethys ocean suture zone (Sengo¨r 1990; Mohajjel 1997;Mohajjel and Fergusson 2000).
The Urmia igneous suite has been replaced among the destructive-carbonate units of the Upper Permian and the Upper Triassic- Lower Jurassic such as Durud, Ruteh, and Naiband formations.Also, the Upper Precambrian and Paleozoic units of Kahar,Soltanieh,Barut,and Lalon have been cut off by the intrusion of this complex(Ghalamghash et al.2009a).In the southwest of the area ultramafic rocks are dependent on the ophiolitic complex with the upper Cretaceous age, has exposed, whose boundaries with the intrusive units are fault zone.
The Urmia intrusive complex has an expansion of about 700 km2and has emerged from 9 to 10 outcrops with stock dimensions that according to age characteristics and wholerock composition can be classified into three rock types’diorite-gabbro, granite, and alkali syenite-granite (Ghalamghash et al.2009a).
According to the field evidence and age measurement by the K/Ar method on separated amphibole, feldspar, and mica, the Urmia intrusive suite occurred in the Late Cretaceous time in two stages (Fig.1).The emplacement of diorite-gabbro and granites occurred simultaneously at 100–92 Ma, and the alkaline rock types in the time of 86–80 Ma (Ghalamghash et al.2009b).It seems that the diorite-gabbro magmatic event (100–92 Ma) occurred during subduction, whereas the second one (at ca.80 Ma)probably arose through the collision between the Arabian margin and the Sanandaj–Sirjan zone (Ghalamghash et al.2009b).
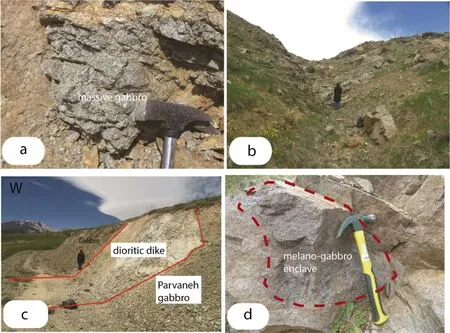
Fig.3 a, b Field photos from the massive gabbros outcrop.c Intrusion of the light colored (plagioclase-rich) dioritic dike into the Parvaneh gabbro.d Some dark colored melano-gabbro enclaves were shown at the gabbros with more hornblende
The studied gabbroic rocks are in the two regions of Moskin, with longitudes of 44°55′16′′to 45°00′and latitudes of 37°45′to 37°46′12′′and the Parvaneh region,with longitudes of 45°05′01′′to 45°12′10′′and latitudes of 37°04′30′′to 37°06′15′′located at the 1:100,000 geological map of Serow (Sabziei et al.2004) and Oshnaveih(Naghizadeh 2004).Moskin and Parvaneh gabbros are located in the sedimentary-structural sub-divisions (Ghasemi and Talbot 2006)in the Sanandaj–Sirjan zone of Iran(Fig.2).
Based on the mentioned maps and field studies, the outcrops in these areas are frequently hornblende-gabbro to gabbro-norite (Fig.3a, b), and metamorphic and sedimentary rocks are also observed around the studied intrusions.
A dioritic dike in the Parvaneh pluton has cut gabbroic rocks (Fig.3c), which is shown in the classification diagrams.The presence of dark-colored enclaves of finegrained melano-gabbro is considerable (Fig.3d).The studied gabbros are massive with coarse amphibole and plagioclase, visible at a mesoscopic scale.Regarding the color grade, these rocks were observed with various medium to dark colors.In addition, the petrographic and petrofabric studies of metamorphic rocks around the Parvaneh region have formed at the lower greenschist facies to the lower amphibolite facies.These rocks are mainly composed of hornblende schists, amphibolites, and granitoid mylonites.The investigation reveals that metamorphic rocks are formed at high temperature-low pressure regimes,and it seems that the low-pressure metamorphism of the region is related to arc tectonic settings (Borzoie and Pourmafi 2001).
3 Methods
The present study focused on two separate areas in the north and south of Urmia using field and laboratory evaluations.Eight fresh samples were selected from each region and were sent to the ALS Minerals Laboratory in Ireland for chemical analysis (Tables 1, 2).The major oxide elements were analyzed by the X-ray fluorescence(XRF) method.Other trace elements were also evaluated by the inductively coupled plasma mass spectrometry(ICP-MS).For measurement of the petro-physical parameters,we use 2D outcrop images of the rocks,draw crystal outline sketches for classification of images, then analyze the result with image processing software, Digitizer for measuring width, length, area, and roundness of crystals.CSD Corrections (after Higgins 2000) was used to calculate the CSD patterns in 3D, slope, and intercept values of the curve.For other cases such as shape,SDP,and DA,we directly measure the factors on the sample or photograph with a ruler and percolator concerning scale and checked the measurements by ASAP software.
4 Petrography
According to microscopic thin sections, petrography plagioclase, and amphibole are abundant minerals and rare pyroxene and olivine observed in the gabbroic rocks of the Moskin and Parvaneh regions (Fig.4).Moreover, minor minerals included titanite, apatite, biotite, and opaque.Chlorite, epidote, and clay minerals also considered alteration product minerals in small amounts.Additionally, the predominant textures observed in gabbroic rocks encompassed intergranular, poikilitic, ophytic, granular, and corona.The olivine is scattered in small crystals in the rock, usually is an-hedral, and has a corona texture due to the reaction rim around olivine crystals (Fig.4a).
The plagioclases were subhedral to anhedral and had albitic twinning visible in thin sections (Fig.4d, f, h).In some cases,plagioclases had chemical zoning,indicating a change in the magma composition during crystal growth or overgrowth on primary cores.The amphiboles are sub- to an-hedral in the studied samples, and most of them have simple twinning.
5 Geochemistry
The silica content of Parvaneh and Moskin specimens is 45–52 wt%except for a diorite dike specimen in Parvaneh rocks (Tables 1, 2).In addition, Al2O3percentage changes from 15 to 19 wt%.These rocks have high MgO and CaO while small amounts of P2O5, TiO2,and K2O.
In the Zr/Ti diagram against Nb/Y, one of the samples(dioritic dike) is in the andesite field, and the remaining samples are basalt (Fig.5a).
We use two magma series determination, and it is clear that the samples of the studied areas have a calc-alkaline affinity (Fig.5b, c).
It revealed that as MgO increases, Na2O, K2O, P2O5,and Al2O3decrease while TiO2,CaO,and Fe2O3display an increase.An increase in MgO, P2O5decreases, indicates that minerals such as apatite and possibly accessory minerals including monazite may have entered the crystal.The ascending trend of CaO demonstrates that it is present in minerals such as pyroxene, calcium plagioclase, and amphibole, which are abundant in the studied rocks.The emplacement of TiO2in the titanite and ilmenite led to its positive trend and shows the nearly high depth of magma generation.The Nb, Th, Zr, V, La, Ce, Ba, Sr, and Rb against MgO, have a negative trend except for vanadium due to the presence of vanadium in the pyroxene, amphibole,and biotite that the studied gabbroic rocks are rich of them.The studied gabbros are non-cumulate arc-related types (Fig.5d).
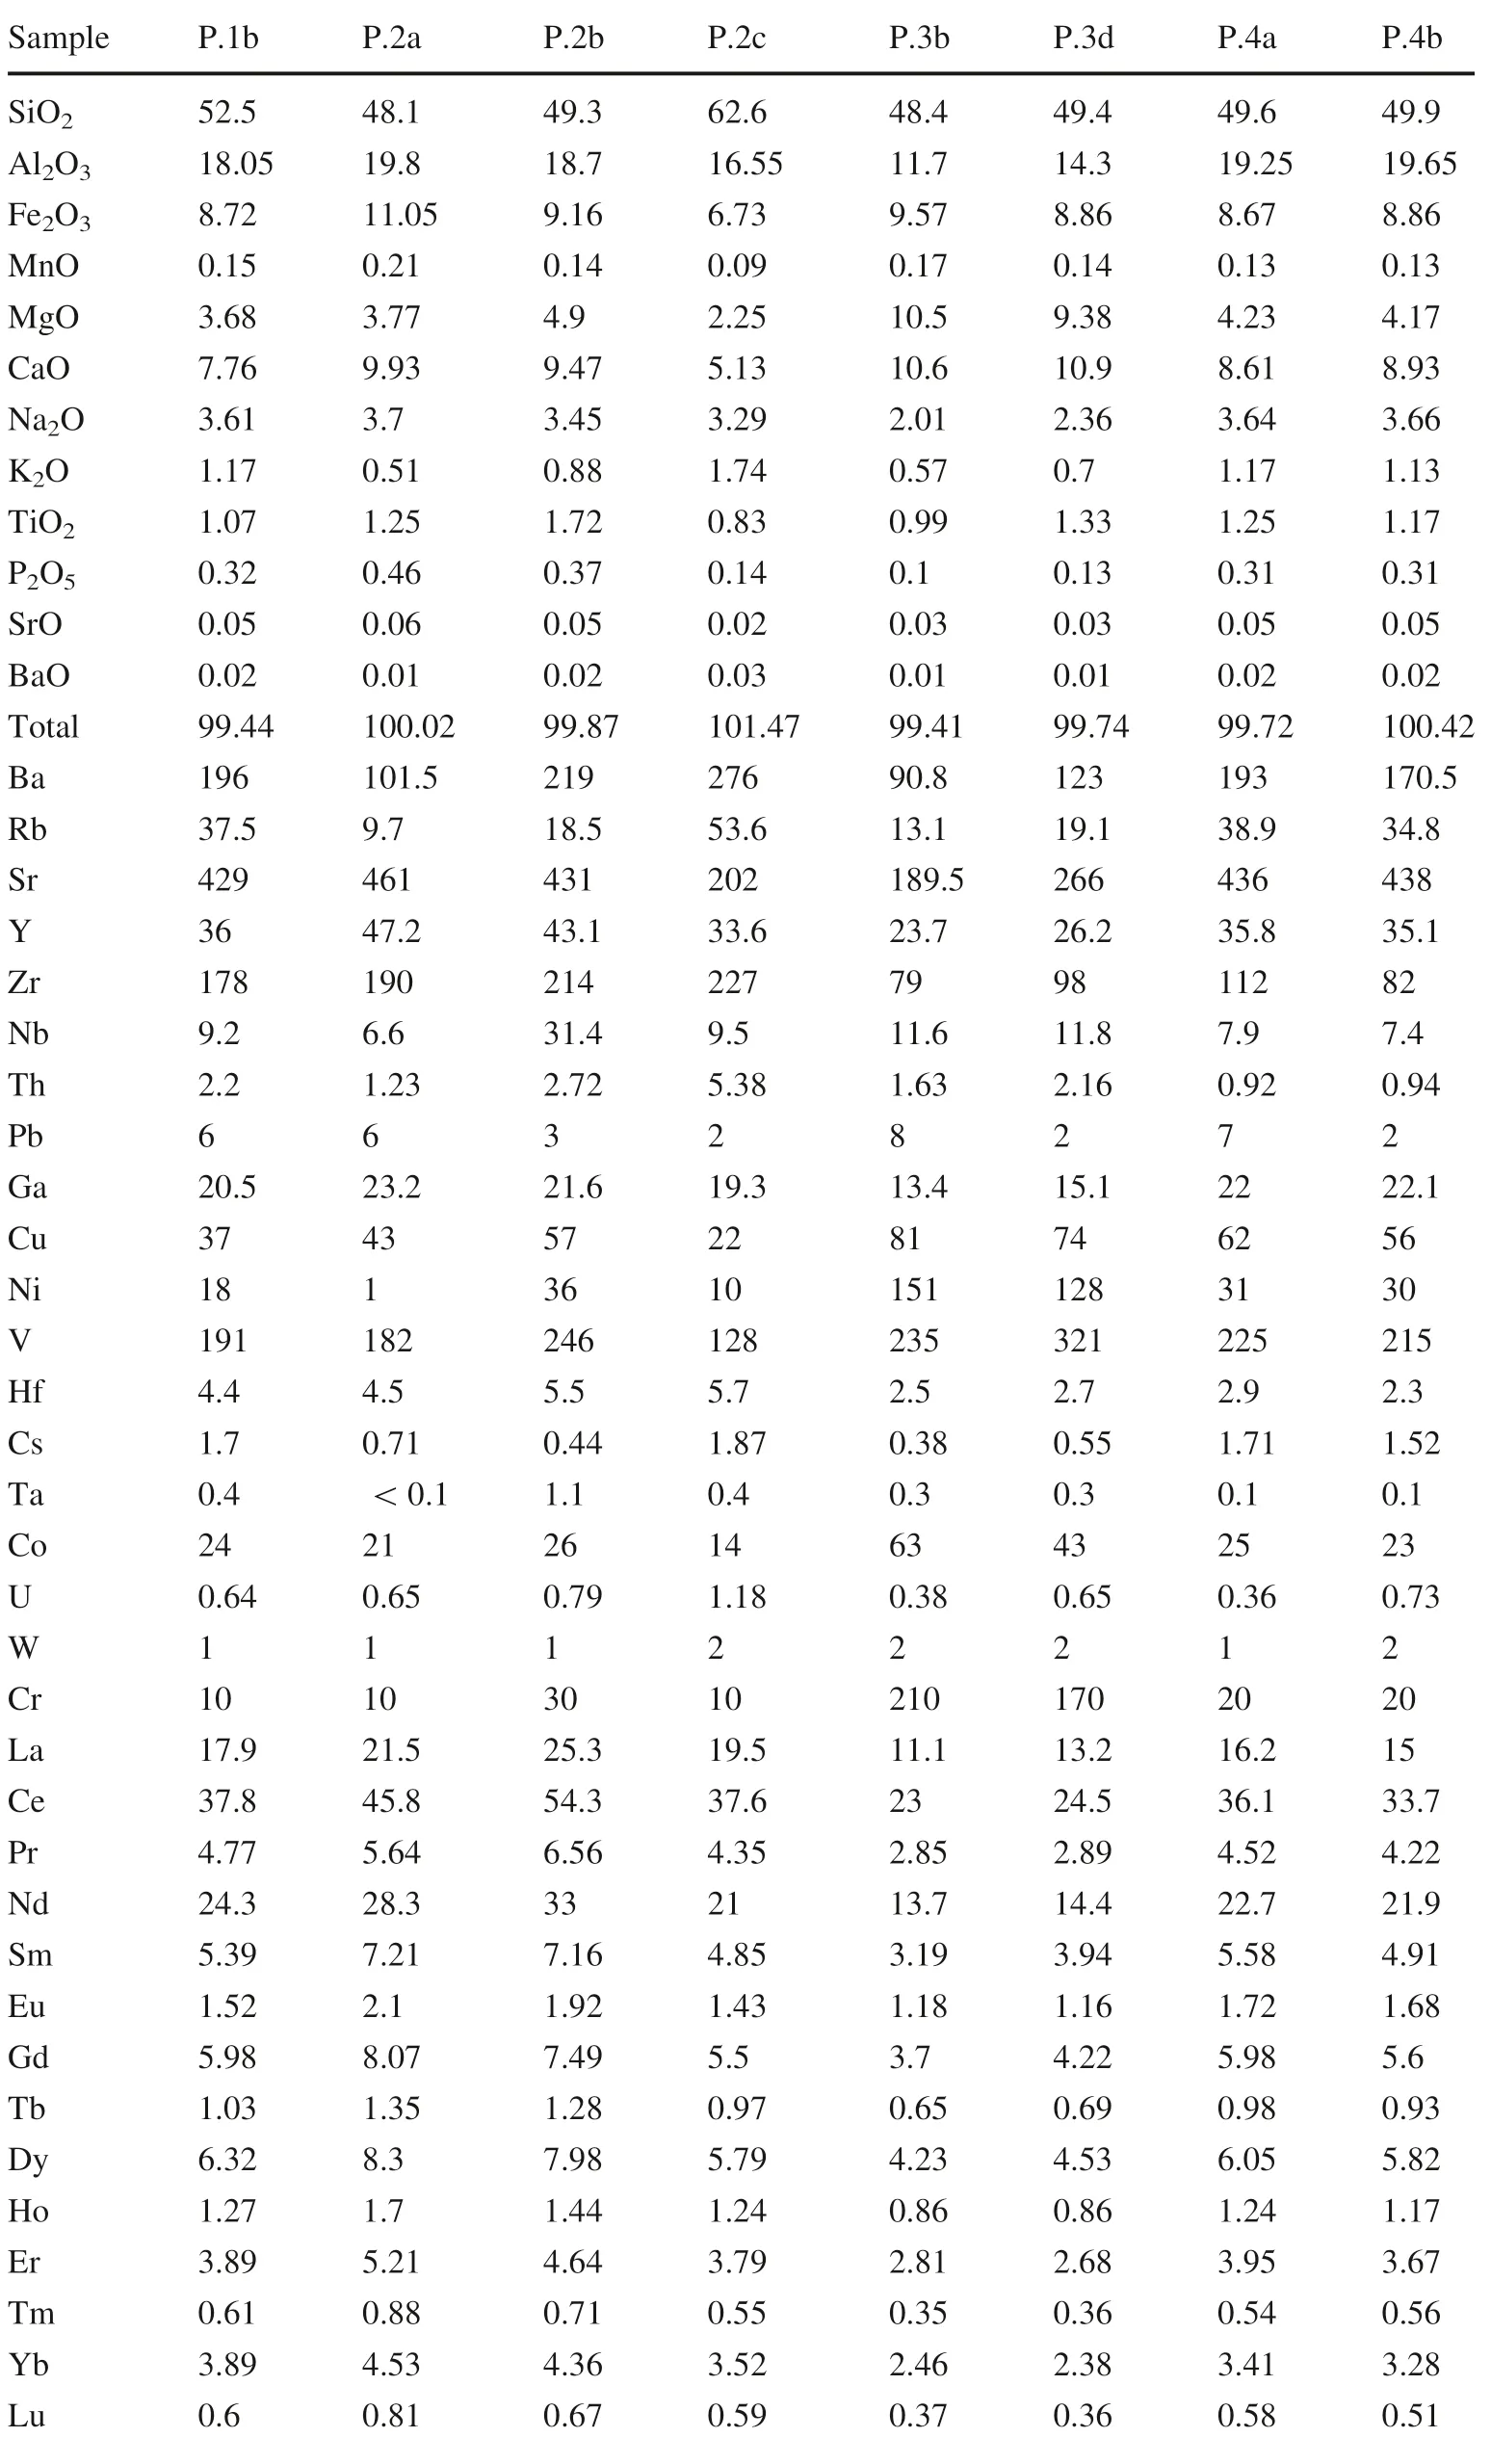
Table 1 Whole rock XRF (for major oxide elements) and ICPMS analysis(for trace elements)results of the Parvaneh region gabbro, south of Urmia
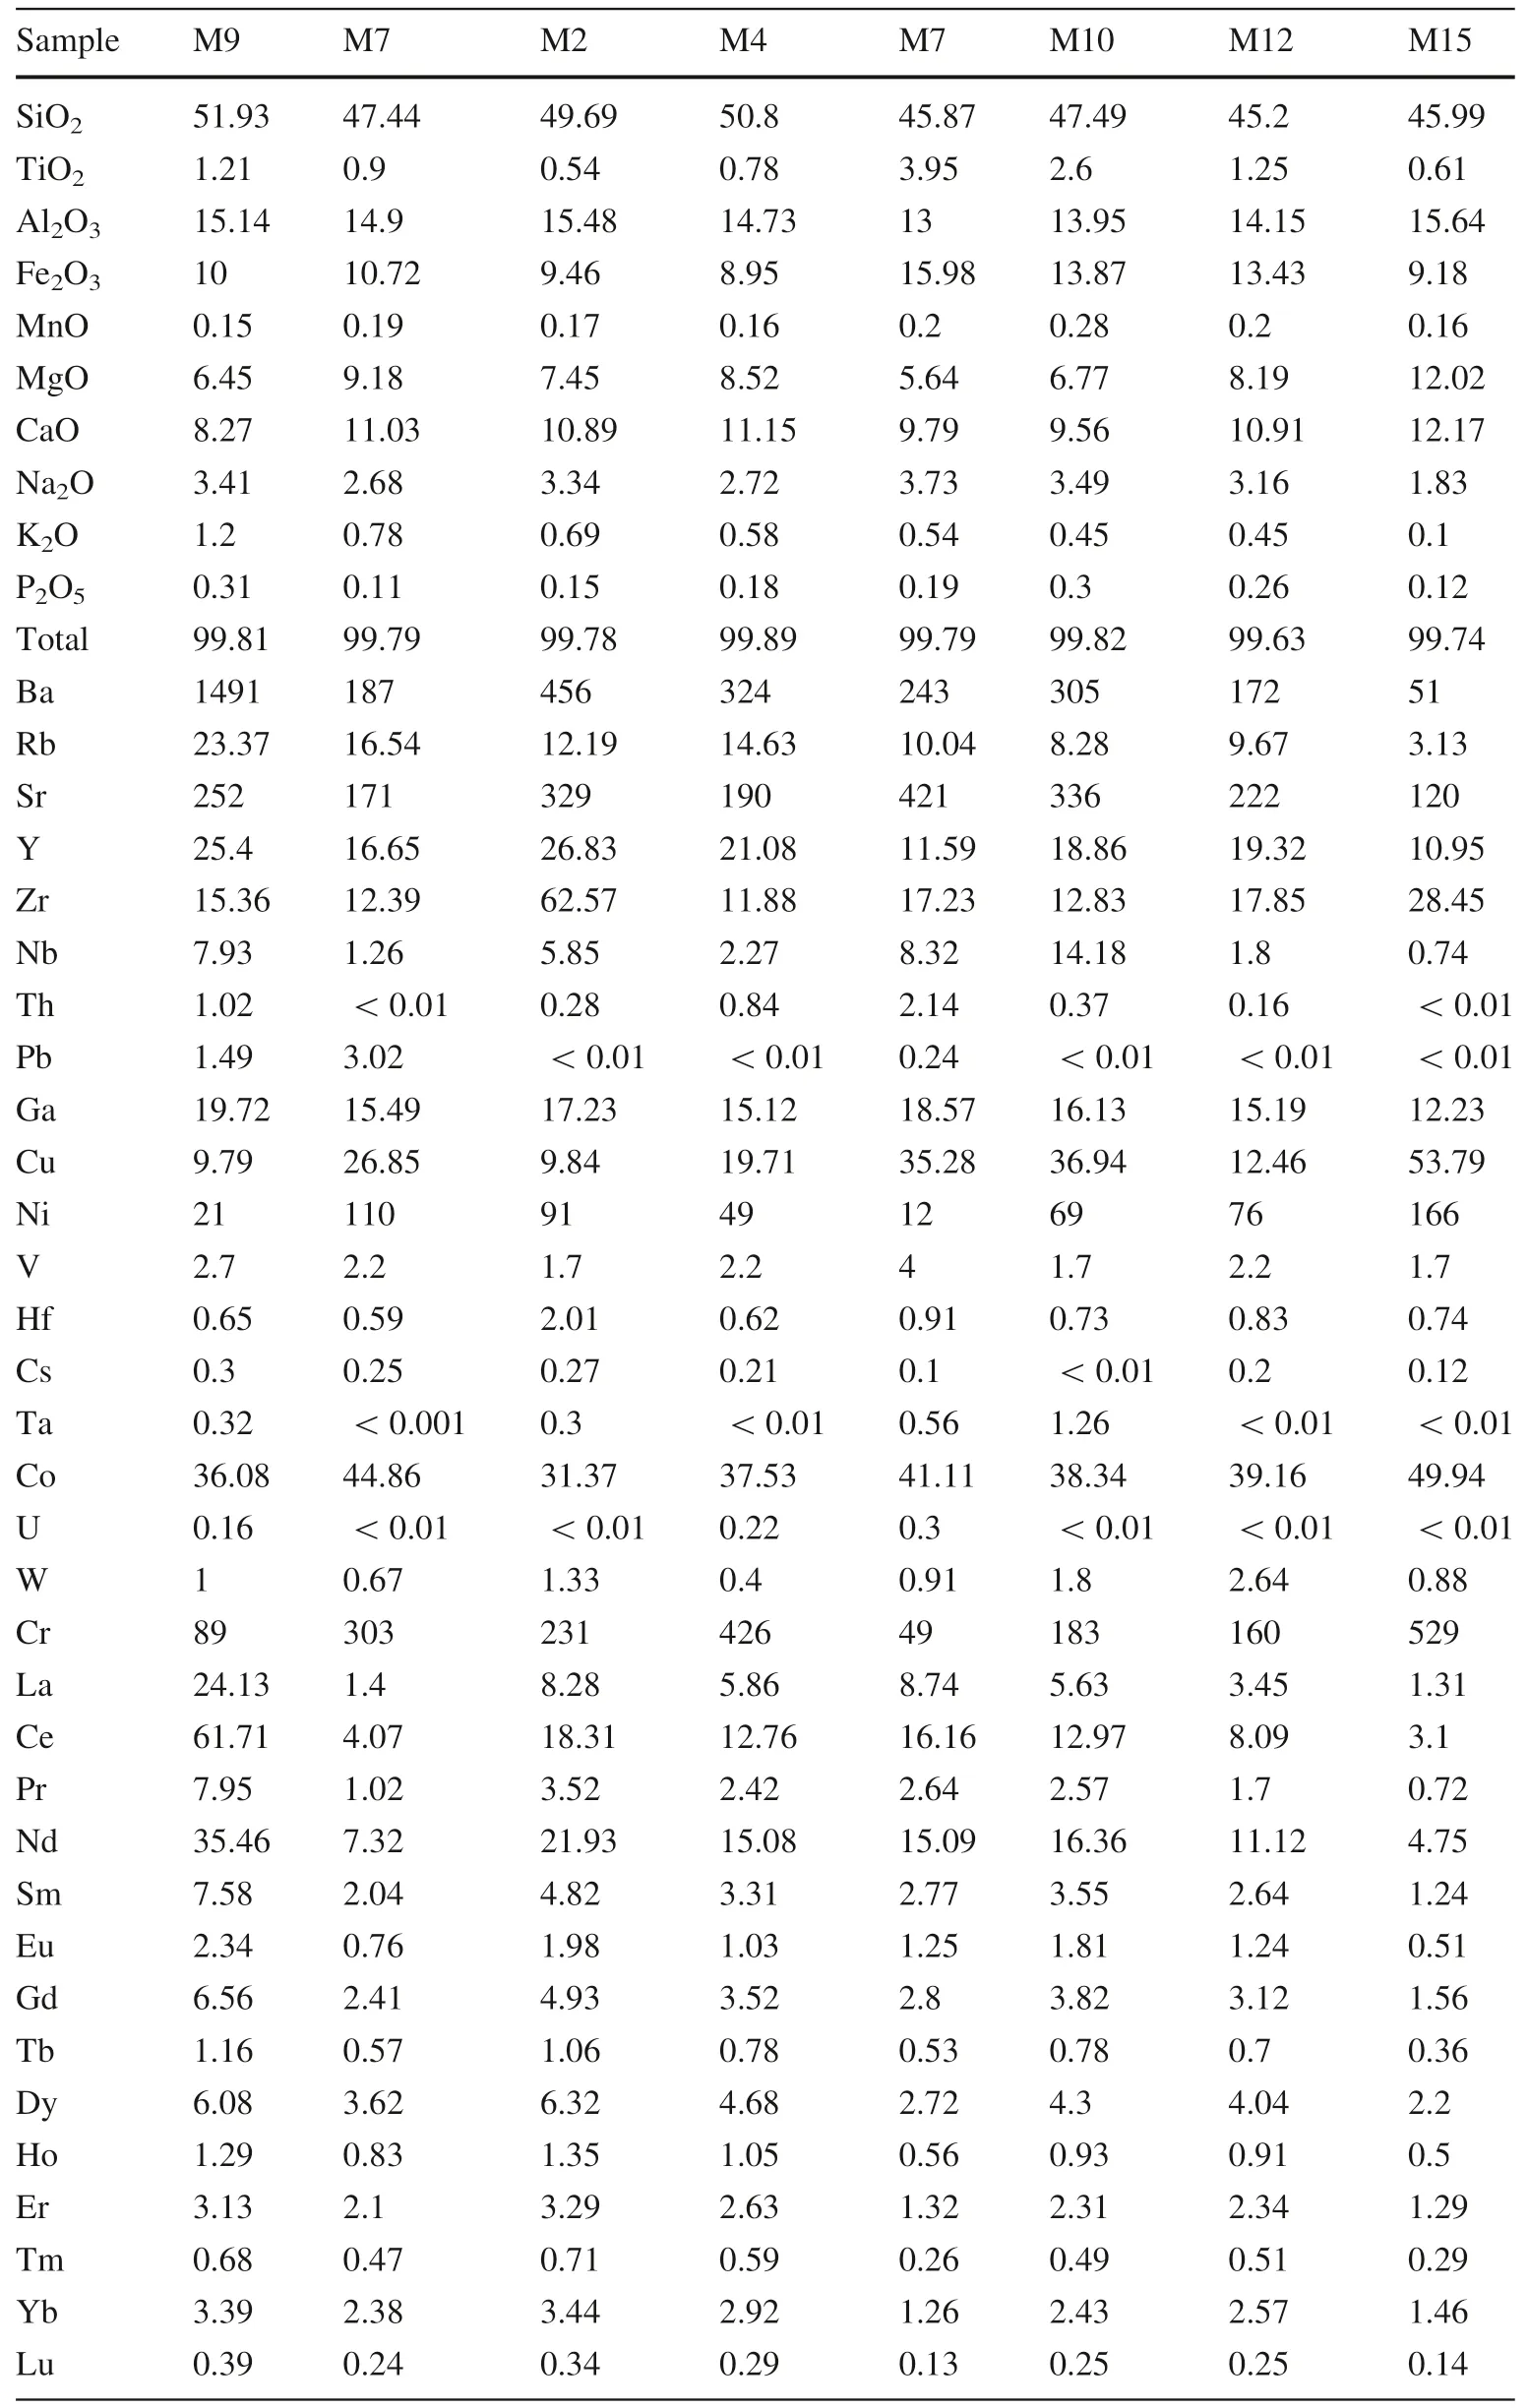
Table 2 Whole rock XRF (for major oxide elements) and ICPMS analysis(for trace elements)results of the Moskin region,northwest of Urmia

Fig.4 Microphotographs of the studied gabbroic rocks.a and b Pyroxene and olivine crystals in the Moskin region, PPL and XPL.c indicates high relief titanite which found in the Moskin rocks.d large plagioclase crystal with albitic twinning and the presence of pyroxene,amphibole and opaque minerals from Parvaneh rocks.e and f coarse plagioclase, PPL and XPL.g large amphibole crystal with Manbach twinning.h plagioclase crystal with intergranular texture
6 Discussion
We illustrate the rare earth elements pattern of 16 samples normalized to chondrite(Fig.5e).As shown,the fractional pattern (enrichment from LREE to HREE) is much more noticeable in the case of Parvaneh gabbro, while the samples of the Moskin region represent a flat and occasionally even convex pattern in the middle part.In addition to partial melting, LREE enrichment can also result from the influence of crustal matters.
Generally, rare earth elements show a nearly flat trend from La to Lu for Moskin gabbro rocks.Moreover, the values of Lan/Smn, Lan/Ybn, and Smn/Ybnratios demonstrate that LREEs have a higher amount compared to MREE and HREE.Additionally, observing the positive anomaly in the Eu (Fig.5e) indicates the dominant phase of plagioclase in the rocks.Similarly, positive anomalies for MREEs in Moskin gabbro can be attributed to the presence of the hornblende because this mineral is a good preservative for MREEs (Rollinson 1995).In addition,small amounts of HREEs in Moskin gabbro can be due to the presence of the garnet in the residual source and nonparticipation of this mineral in the molten production process.
The spidergram for gabbros in both regions shows the high values of HFSEs and LILEs in these rocks (Fig.5f),which are the characteristics of arc-related rocks (Orsoev et al.2015), respectively.The concentration of LILEs elements is a function of the fluid phase or crustal contamination (Borisova et al.2001; Harris et al.1986;Kamber et al.2002).If the concentration of HFSEs is controlled by the composition of the source rock and crystalline/molten processes that occur during rock formation (Stolper and Newman 1994).The HFSEs are relatively immobile in hydrous fluids (Tatsumi 1989;Keppler 1996).Therefore, the enrichment of these elements in mantle wedges is a sign of the mixing of the molten oceanic crust with the original magma (Plank and Langmuir 1992).These elements are low in the Moskin gabbro but have a slightly high content in the Parvaneh gabbro.
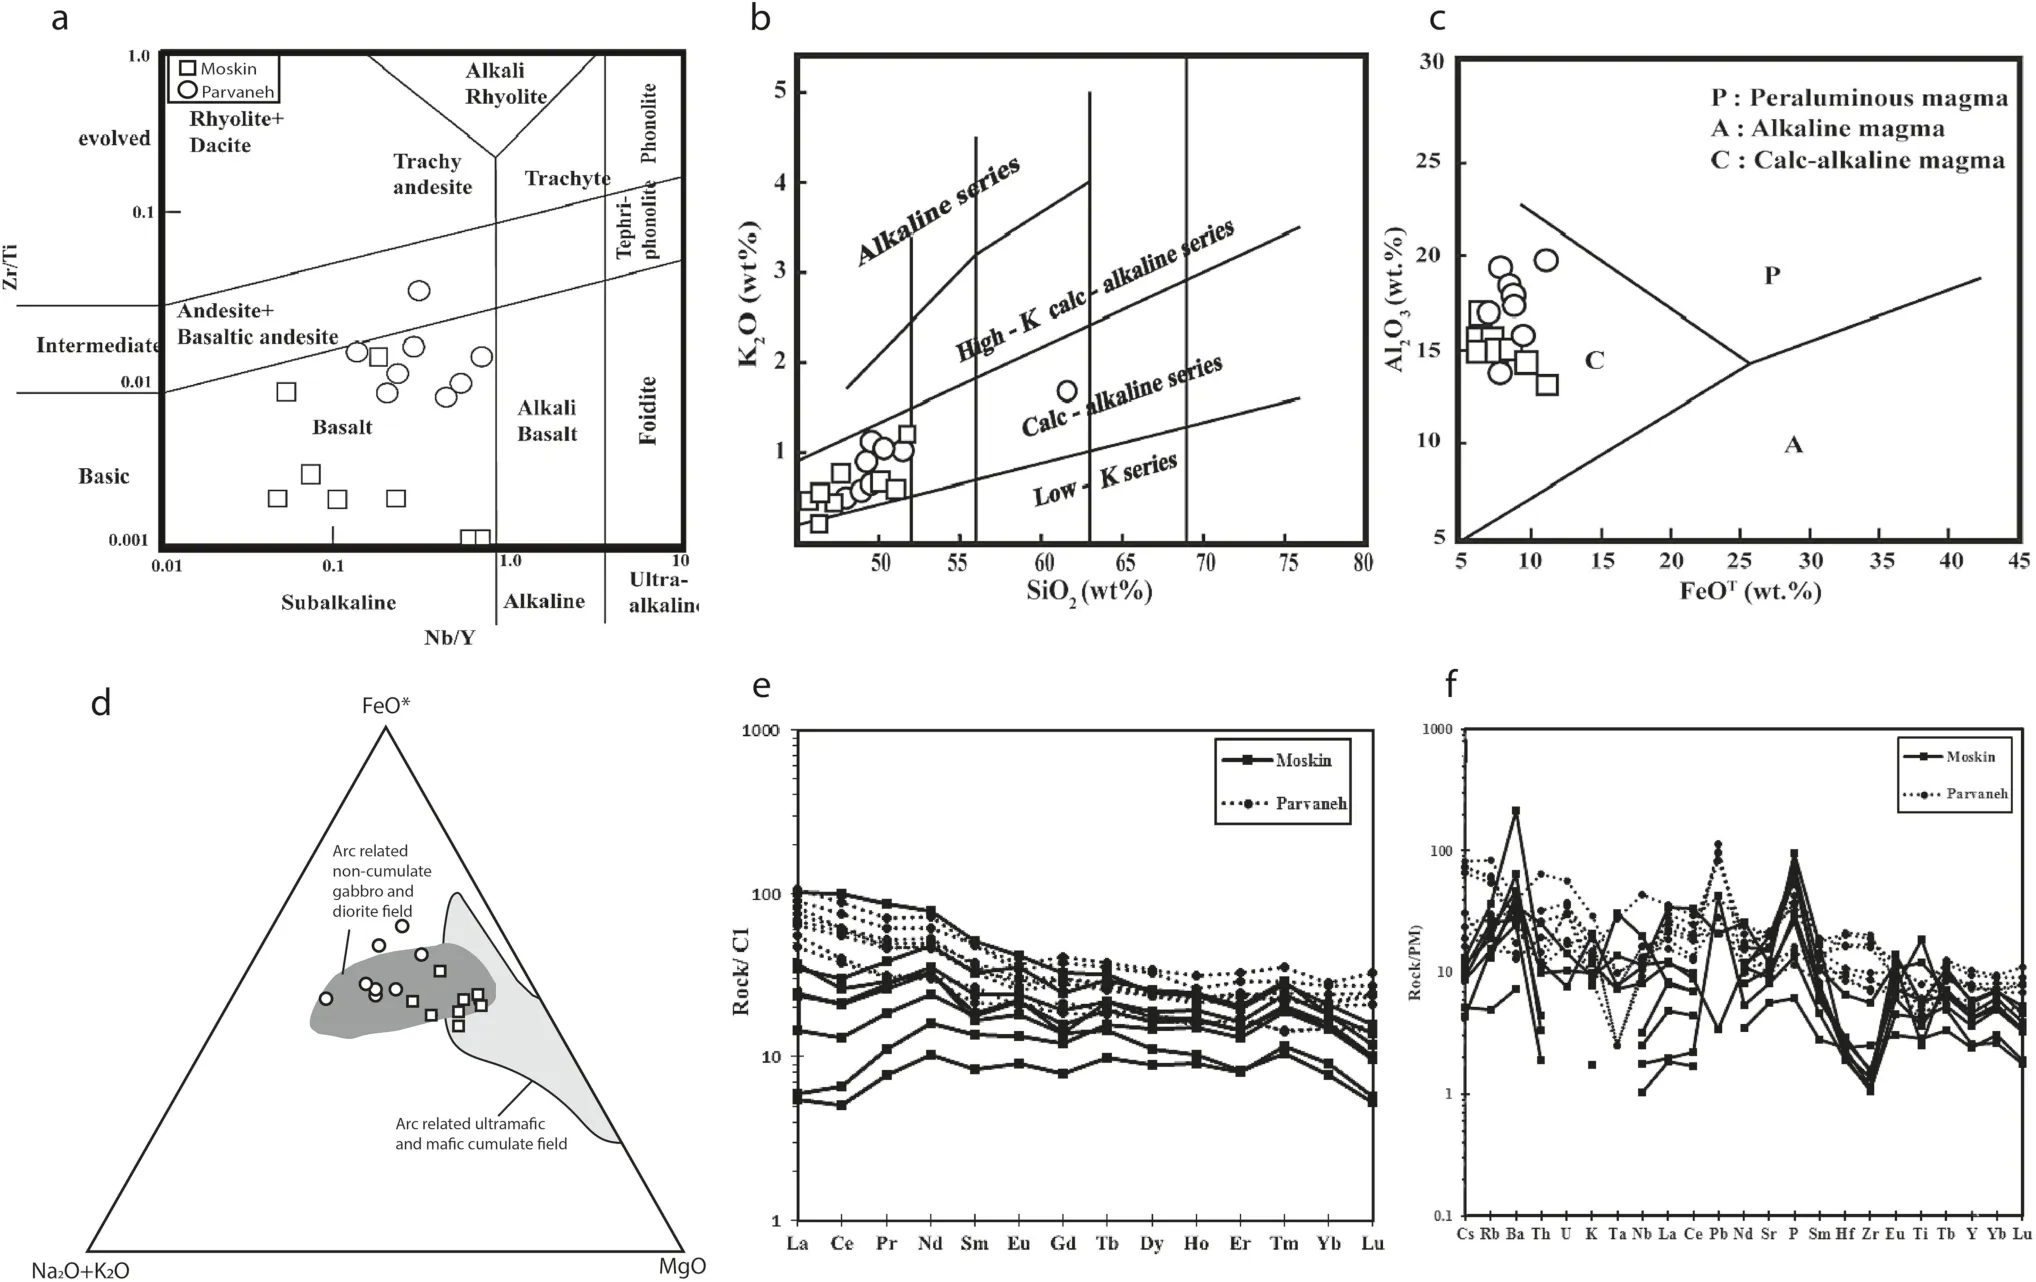
Fig.5 a Classification diagram of the studied igneous rocks based on the trace elements(Winchester and Floyd 1977),most of the samples are in the gabbro(basalt)field.b Determination of magmatic series for the studied rocks,SiO2 versus Na2O + K2O series(Ewart 1982).c Al2O3 versus FeOT(Abdel-Rahman 1994).All the samples fit at the calc-alkaline series field.d AFM discrimination ternary diagram for the Urmia gabbroic rocks.Fields of cumulate(light gray)and non-cumulate rocks(dark grey)are from Beard(1986).All of the samples lot in the non-cumulate field.e The chondorit normalized REE pattern (McDonough et al.1992) of the Moskin and Parvaneh gabbros.f The spidergram normalized to the primitive mantle (McDonough et al.1992) for the gabbros
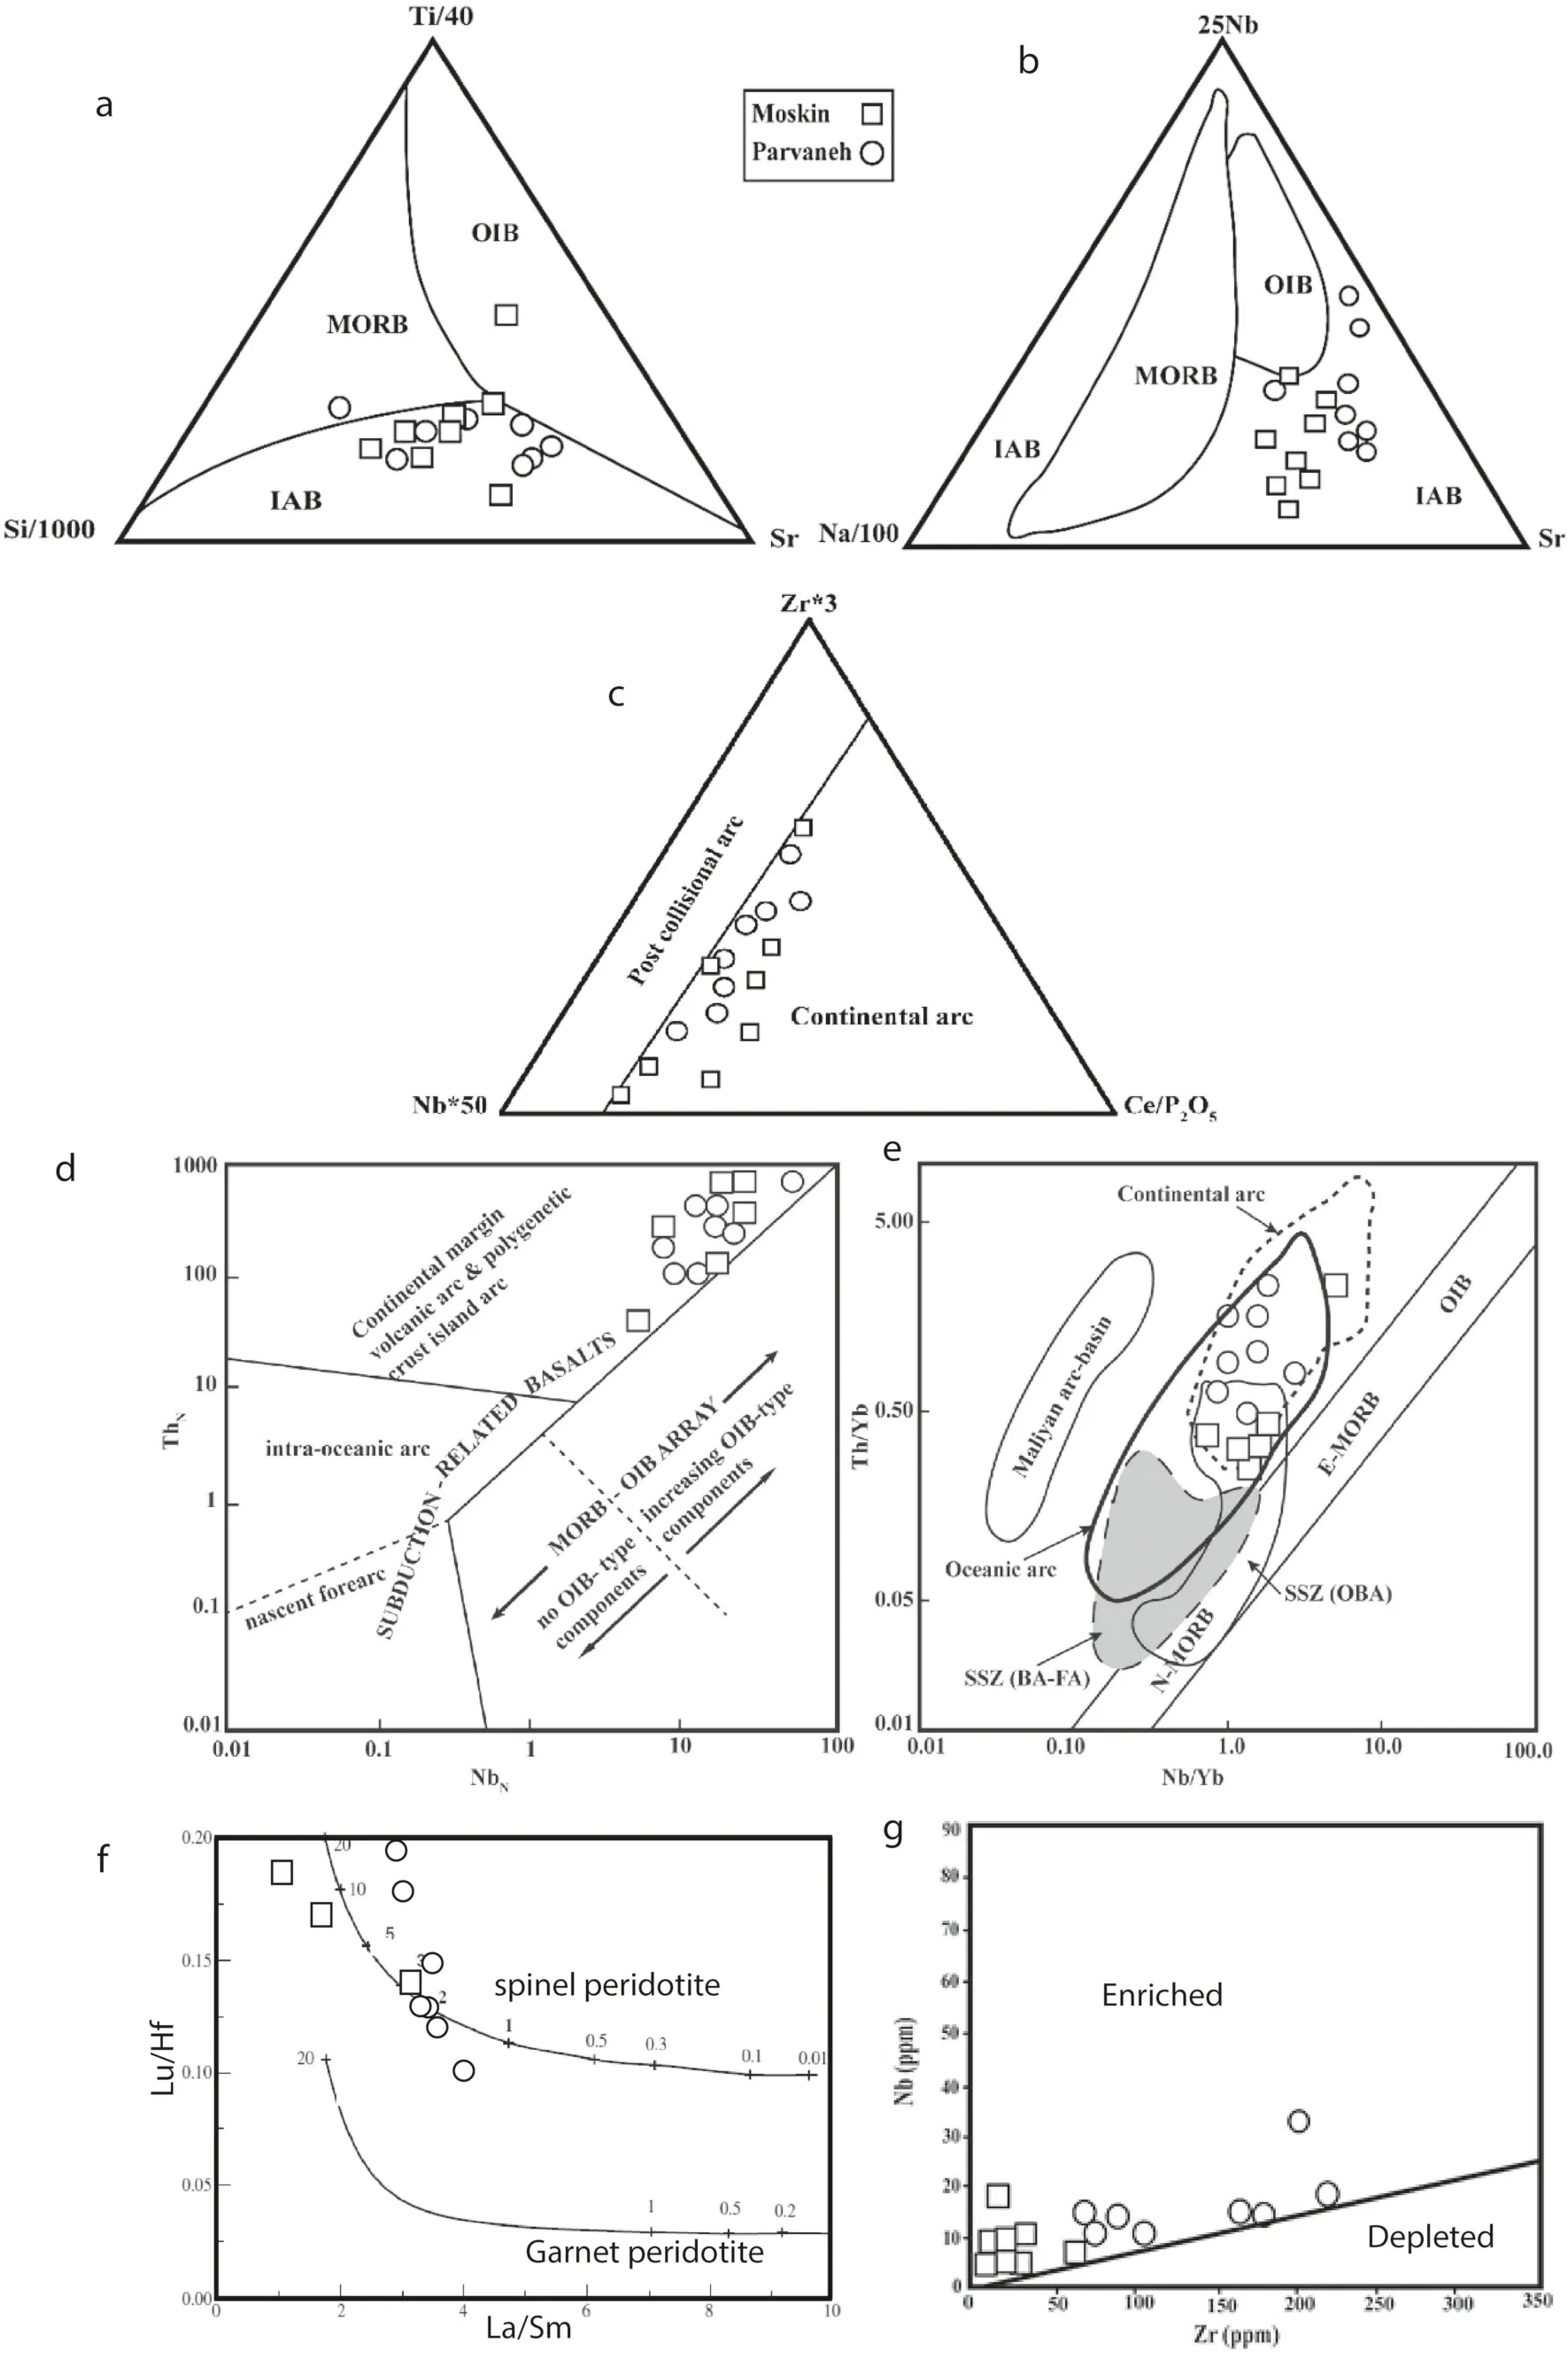
Fig.6 a, b The tectonic setting discrimination diagrams after Vermeesch (2006), all the samples are located in the IAB region,c after Muller et al.(1992), d ThN against NbN diagram (Saccaini,2015) which are normalized to the primitive mantle (McDonough et al.1992)and e is the discrimination diagram of the Th/Yb and Nb/Yb (Pearce 2008).All the studied gabbroic samples are within the continental arc position.f Diagram for source determination of the gabbros parental magma(Regelous et al.2003)which show the spinel peridotitic source materials for them.g Diagram of showing the quality of melting source of Nb versus Zr (Jung et al.2006).The gabbros show enriched source
Furthermore, the presence of negative Ta and Nb elements (HFSE) in all specimens probably indicates the involvement of subduction factors in the enrichment of mantle melt, which is related to the active margin of the continent (Aldanmaz et al.2000).
6.1 Tecteno-magmatic setting
We use several discrimination diagrams to determine the position of the Moskin and Parvaneh (Fig.6a–e).All of them show the volcanic arc relative to the subduction position for the gabbros.
The trace element ratios such as Sm/Yb against La/Sm,as well as the Sm/Yb to Sm (Aldanmaz et al.2000; Zhao and Zhou 2007) display that data related to the Parvaneh and Moskin gabbros are generated from the spinel lherzolite to spinel-garnet lherzolite with a melting rate of about 10%–30%(Fig.6f).The La/Sm ratio also considered a suitable criterion for measuring the enrichment of the source area of LREE (Koglin et al.2007).This factor is more significant than the Moskin for the Parvaneh gabbro.As well as Nb versus Zr (as low-mobility incompatible elements) is used to distinguish between the enrichment and depletion of the origin(Jung et al.2006),and the rocks are confirmed from an enriched type (Fig.6g).
Some trace element ratios like K/Ce,Rb/La, and Nb/Th show that the lower continental crust has been well involved in forming the studied gabbroic magmas.The contamination of the arc magma with crustal components has also occurred in areas such as the gabbroic intrusions of Astara (Salavati and Ashori 2016).
6.2 Geodynamic of the mafic intrusions
The subduction of Neo-Tethys below the Central Iran microplate(Fig.7)is from the southwest to the northeast at an angle of about 55° (McClay et al.2004; Heidari et al.2016).It is because of compressional phases that the Arabian Peninsula exerts on Iran’s microplate after the closure of Neo-Tethys(Berberian and King 1981;Mohajjel et al.2003a, b; Elmas and Yilmaz 2003; McClay et al.2004;Molinaro et al.2005).The effect of such a function is to develop faults along with the right-hand slip.Such faults are abundant in northwestern Iran, especially in West Azerbaijan (around Urmia).Intrusive mafic rocks formed at the depth with the nature associated with the arc have found the possibility of surface emergence in such an environment and when the stress caused by the collision is over.
6.3 Petro-physical studies
6.3.1 Crystal size distribution (CSD) patterns
Analysis and interpretation of CSD and other physical parameters of the crystal population enable us to distinguish between different origins and different growth histories.This ultimately enhances our understanding of magmatic processes.Composite-based physical measurements can show different stages of development the reveal the time scale for diffusion under crystallization conditions.One of the most common aspects of quantitative textural studies is the distribution of grain and crystal dimensions.However the first study on the dimensions of igneous rock crystals was published 120 years ago, but until 30 years ago, such studies did not receive much attention until the main article by Cashman and Marsh (1988) addressed this issue.
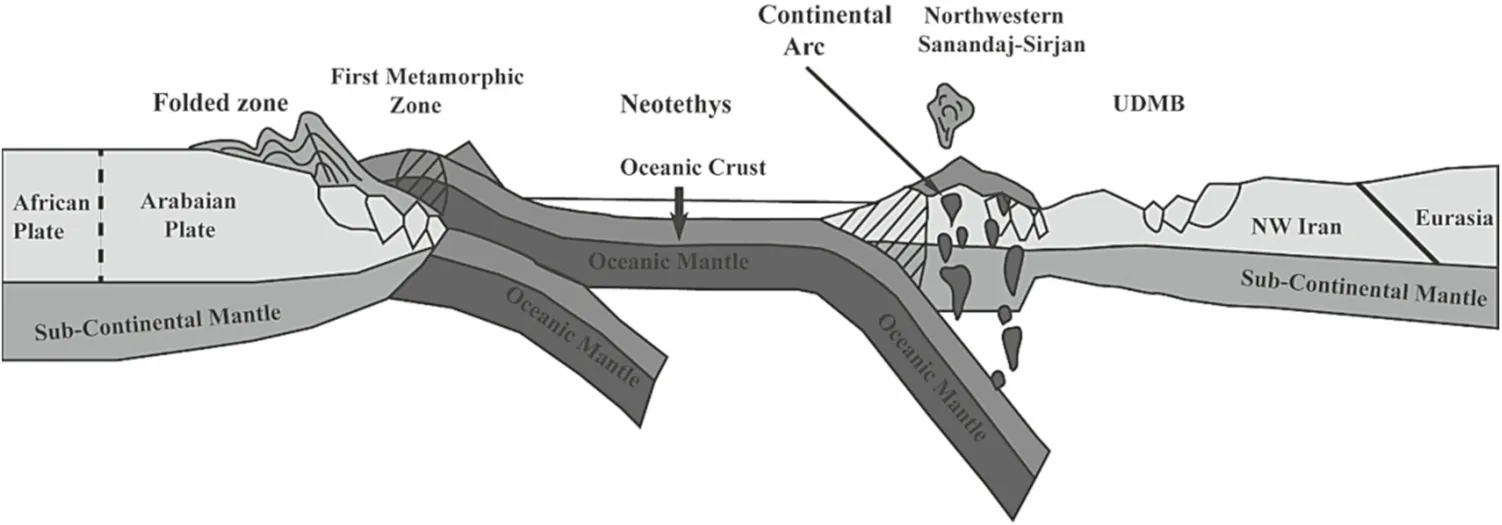
Fig.7 The schematic model of the Neo-Tethys oceanic crust subduction under the Central Iran micro-continent after Sudi Ajirlu et al.(2016).The continental arc formation along the Sanandaj–Sirjan structural zone of Iran as a result of the second episode of the subduction is cleared
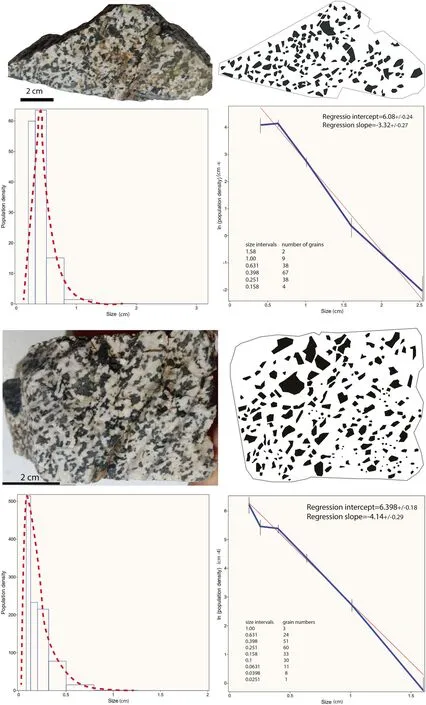
Fig.8 Total picture is formed from sample photograph, illustrated sketches from amphibole crystals,histogram graphs and CSD pattern,extracted for Moskin gabbro
For igneous rocks,kinetic issues of nucleation and early growth must also consider.The driving force of kinetic processes can be considered under-cooling or super-saturation of the system(Cashman 2020).The resulting crystal population is altered by mechanical factors such as sorting,coarsening, Ostwald-ripening, or subsequent mixing (Higgins 2006).
The primary functions that control growth textures are the nucleation rate, which is a function of time, and the growth rate,is depending on the time and crystal size.Then the crystal size distribution over time can be calculated based on both functions.We sometimes can assume that the growth rate is self-governing and not controlled by size.For example, during equilibrium, the growth rate depends on the size.For a phase in such a system:

This is equivalent to the length of all crystals with a linear CSD pattern of size zero to infinity.This distribution is linear on the population density diagram versus size.Items such as Ostwald-ripening (Moazzen and Modjarrad 2005), mixing of two magmas (Modjarrad 2015), filter pressing, and crystal aggregations lead to changes and bending in the straight-line CSD pattern (Higgins 2006).
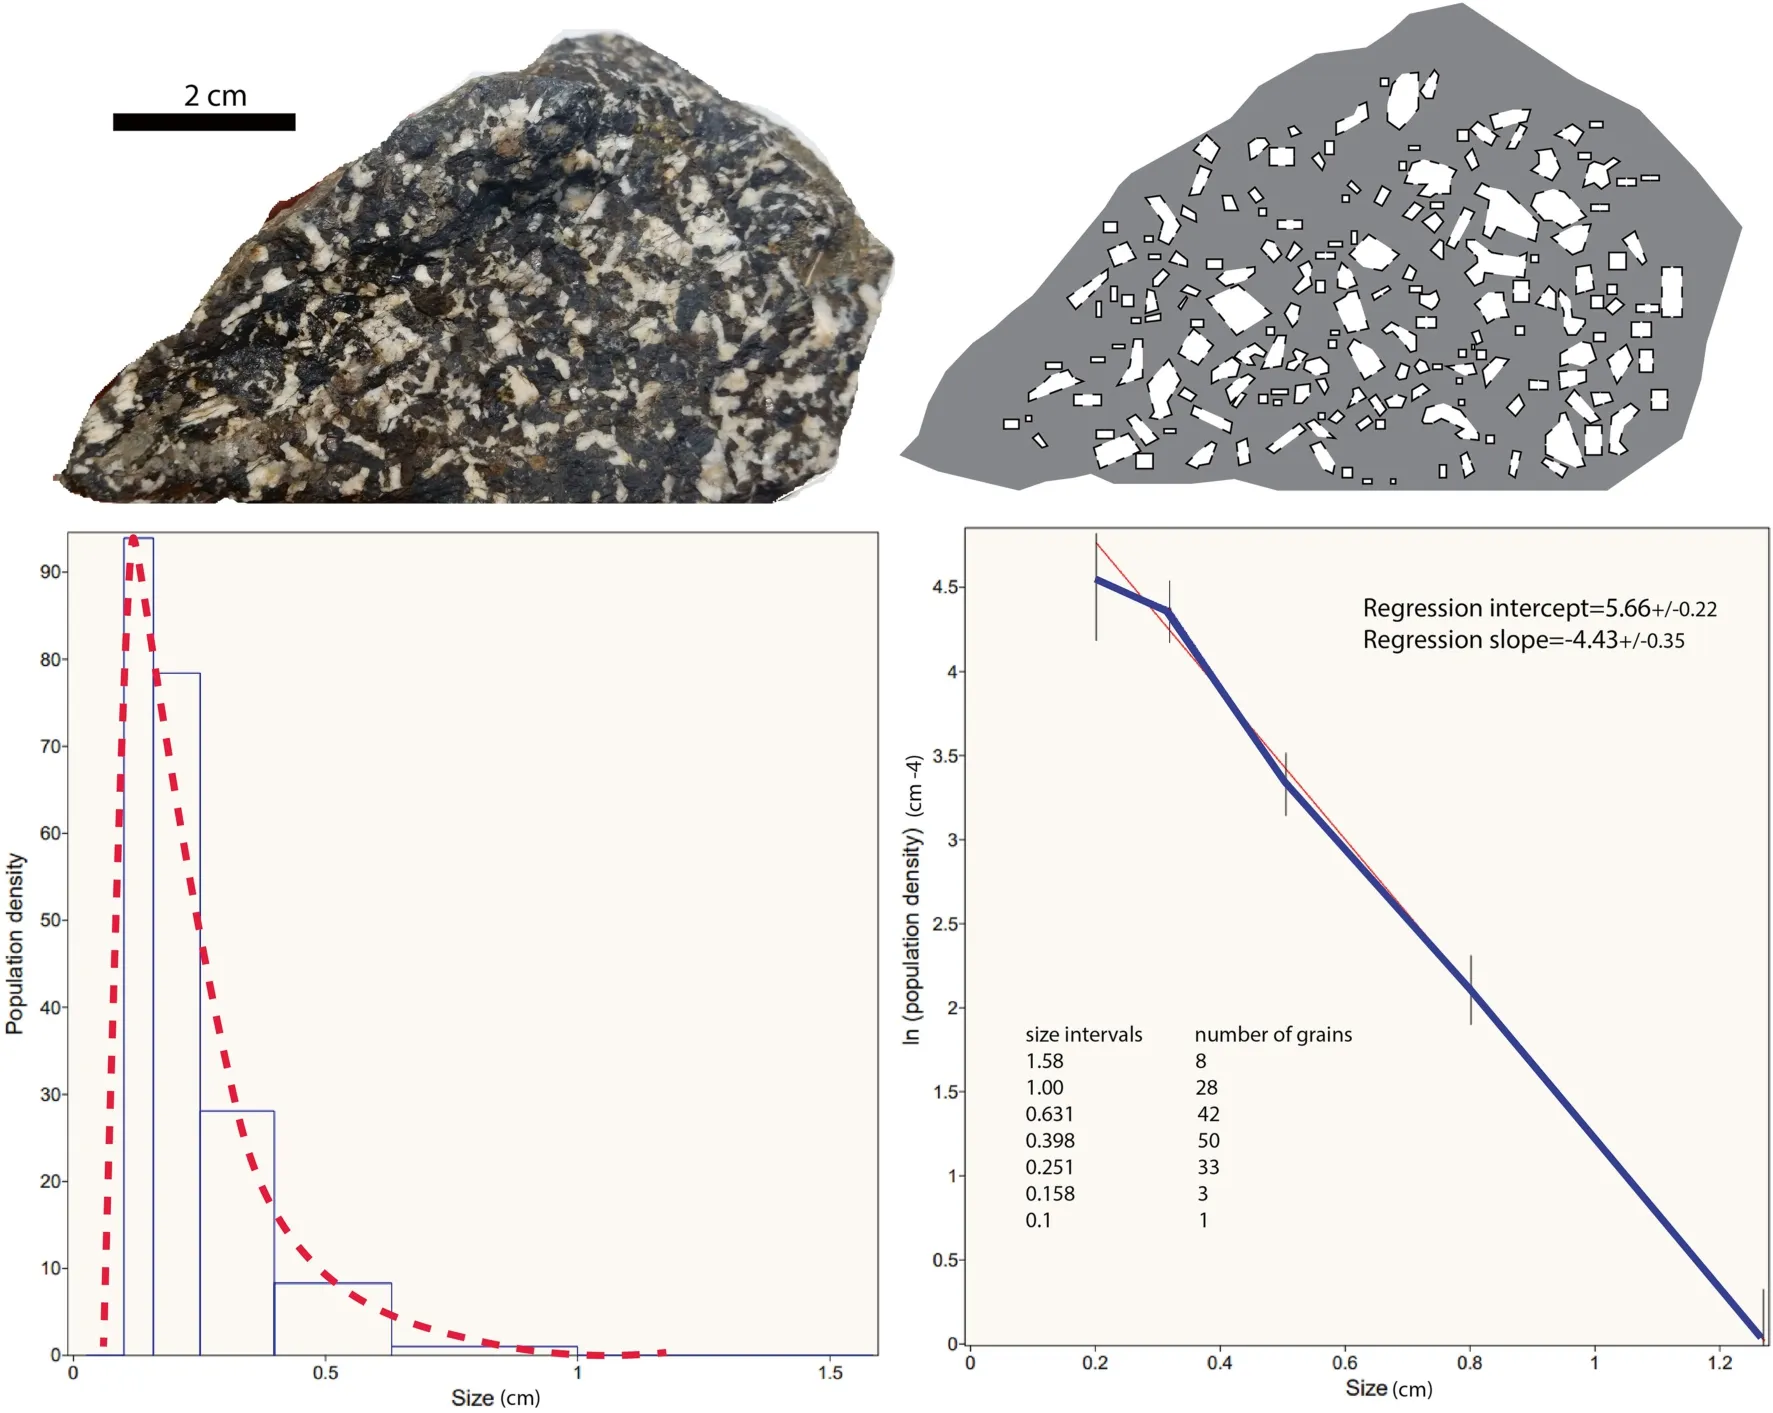
Fig.9 Total picture is formed from sample photograph, illustrated sketches from plagioclase crystals, histogram graphs and CSD pattern,extracted for Moskin gabbro
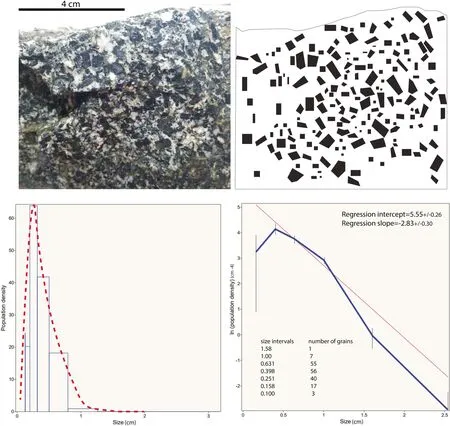
Fig.10 Total picture is formed from sample photograph, illustrated sketches from amphibole crystals, histogram graphs and CSD pattern,extracted for Parvaneh gabbro
In the present study, the ratio between nucleation to the growth of amphibole and plagioclase crystals in gabbro is calculated from the intercept value of the CSD pattern(Figs.8, 9, 10, 11).This ratio (J/G) is 5–6 times, just for Parvaneh plagioclase is ten times which on these rocks the numerous nuclei were formed by a vast degree of overstepping the rocks.However, the CSD patterns show a slope of (- 1/Gt) - 3 to - 4 for amphiboles and plagioclase except for Parvaneh plagioclase which shows a slope of - 16.Considering the standard proposed growth rate for crystals in silicate malts, 10-11cm/s, a time of at least 700–800 years was needed generally for the studied crystals were growing (for the slope of pattern equal to - 1/Gt = - 4).Also, CSD patterns show that magmatic mixing did not occur in the formation of the gabbros, but annealing has led to the convexity of the immediate part of patterns, at the part of the small grains.In many cases nucleation occurs at a surface,interface,impurity,or other heterogeneities in the system.When the rate of free energy change becomes negative, then a crystal can grow.Crystal growth rates commonly increase with increased undercooling.Our study on the gabbro shows that at the initial stages, the undercooling was high, and the nucleation rate was more than the growth rates, but the continued undercooling decrease caused heterogeneous nucleation and large crystals formation.
6.3.2 Crystal shapes
To extract the general shape parameters of amphibole and plagioclase crystals in these rocks, the measured axial ratios of the enclosed parallelograms of the crystals have used.Dimensions of the smallest parallelogram enclosed inside a crystal: three parameters are small diameter (S),intermediate (I), and long (L), and the axial ratio obtained from it.For mathematical reasons, it is better to divide the overall axial ratio into, S/I and I/L.After extracting the data from the classified images of two-dimensional sections, two critical parameters, width (w), and length (l)measured.The simplest way to estimate S:I:L is to use the parallelogram model.For rectangular grains without orientation (massive), the value of w/l equals S/I.In most cases, the w/l ratio is used to calculate the CSD pattern in terms of ease.Measuring I/L on the crystal will be more accurate than all of the above methods.We measured the w/l ratio of crystals on the 2D sections,which is equal to S/I, and calculated the I/L from Garrido et al.(2001)equation:
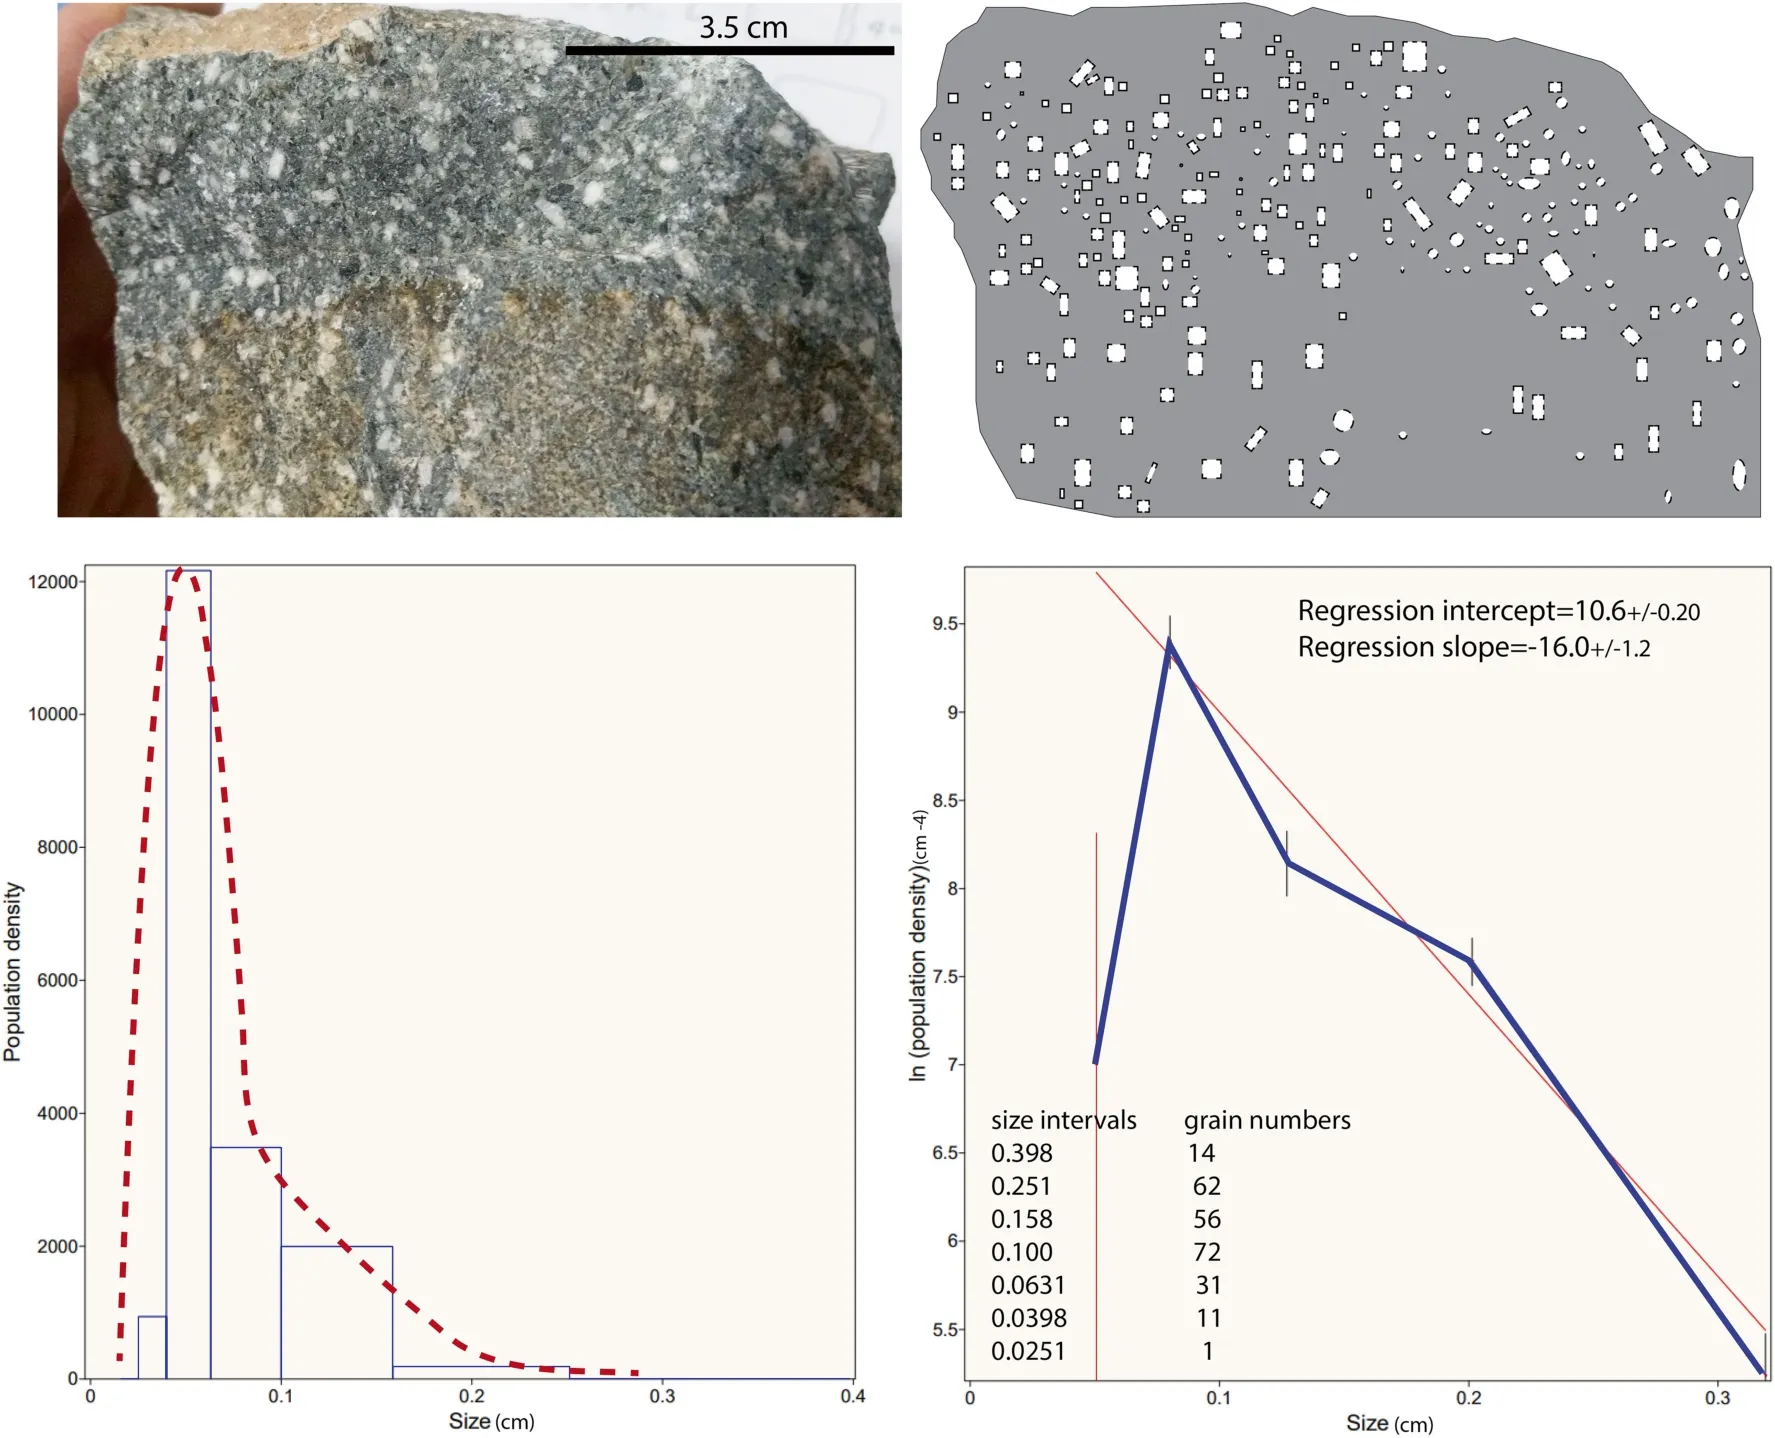
Fig.11 Total picture is formed from sample photograph, illustrated sketches from plagioclase crystals, histogram graphs and CSD pattern,extracted for Parvaneh gabbro

Fig.12 The crystal shape of amphibole and plagioclase in the gabbros is measured directly and plot on the mentioned graph of Higgins (1996)

Then we use the Higgins(1996) graph for crystal shape determination.The shape of amphibole crystals in the Moskin and Parvaneh gabbros(Fig.12)are bladed(with S/I = 0.4–0.5 and I/L = 0.1–0.3) and bladed to tabular for plagioclase (S/I = 0.4 and I/L = 0.6–0.7).
6.3.3 Spatial distribution patterns (SDPs)
In many rocks, the grains are not always randomly distributed in space but may be distributed in clusters, layers,or chains.Such spatial patterns can be defined by the presence of grains, their size, shape, and orientation, and their associated minerals.
Analysis of the SDP of rock crystals is a valuable technique for evaluating the processes involved in rock formation (Jerram et al.1996).In this paper, the SDP of crystals is quantified in two-dimensional sections.The distance between the centers of the grains and the nearest center of the neighbor grain was measured and used to determine the SDP pattern.This number is then normalized to a random distribution of points with the same population density to obtain big R values.This value is then applied to the sum of the other underlying minerals to obtain SDP.By considering the random distribution of spherical grains and then a straight line called RSDL is created in this diagram.If the grains are plotted above this line,they will be ordered and if they are plotted below the line, it means the cluster distribution of crystals in the rock.
The maximum R-value is 2.148 for a full ordered square/hexagonal cube packing.The minimum of this value depends on the grain ratio in the sample volume and is about 1.2 for 30% of the crystal.Changes in grain size matching may change the value of R by 0.25.The mechanical compaction of the integrated framework of the grains will lead to stronger packing and increase the value of R.If this compression continues, it may decrease R and form a cluster SDP in the direction perpendicular to the main stress.The overgrowth changes the location of the center of grains and increases R while decreasing porosity at the X-axis of the diagram.
As long as the temperature and fluid composition are constant, the position of the new core will be random.If a region of liquid or melt is depleted of the constituents of the crystal (for example, due to the crystallization of an adjacent crystal), it may cause the stopping of nucleation.This leads to the production of large-scale distribution patterns due to geochemical self-organization.
Nucleation can also occur in current phases, which is called heterogeneous nucleation.The position of the new crystal nucleus will depend on the location of the host crystal.One of the easiest ways to describe the SDP is to use the average distance of the nearest neighbor,which can be calculated from the centers of the grains.
The position of the grain centers examined when other textural parameters are known.The easiest way to determine the list of N positions of the crystalline center is to find the distance to the nearest neighbor r (Jerram et al.2003).The average distance to the nearest neighbor is:

The mean distance of the nearest neighboring for points with random scattering at the same population density(number of crystals per unit area), NA, is:

The ratio of these two parameters is equal to the big R equal to the position distribution of the grains:

In principle,for distributing random distribution,the big R is equal to one.This number will be less than one for cluster and more than one for ordered distribution.We measured the big R-values for amphiboles and plagioclase in the Moskin and Parvaneh gabbros(Fig.13).All crystals of the samples plot on the clustered field.Crystal clusters are made simply in magmas.If the crystals nucleate heterogeneously any change in the position of crystals in the magma system created different shapes of crystal(Schwindinger 1999),and the crystals re-mobilization form clusters.The formation of mineral clusters in the magmatic productions suggests that the clumps form before the emplacement of the intrusion(Jerram et al.2003).Another one is that they formed during the rise and the emplacement.
Suspicions in the mush zones at the top of a magma body (Philpotts and Dickson 2002) might produce crystal aggregations, which re-arrange individual crystal clusters to the bottom of the magma chamber (Jerram et al.2003).
6.3.4 Dihedral angles (DAs)
If a substance is completely solid, four crystals will be in contact in the corners of each crystal.Also, three crystals will have a common border along the edges of the crystal.On a plane perpendicular to the edges, the angle between the crystal boundaries is called the Dihedral Angle (DA).DA shows the surface energy difference between phases,at equilibrium.If the three isotropic phases collide at the edges, then:
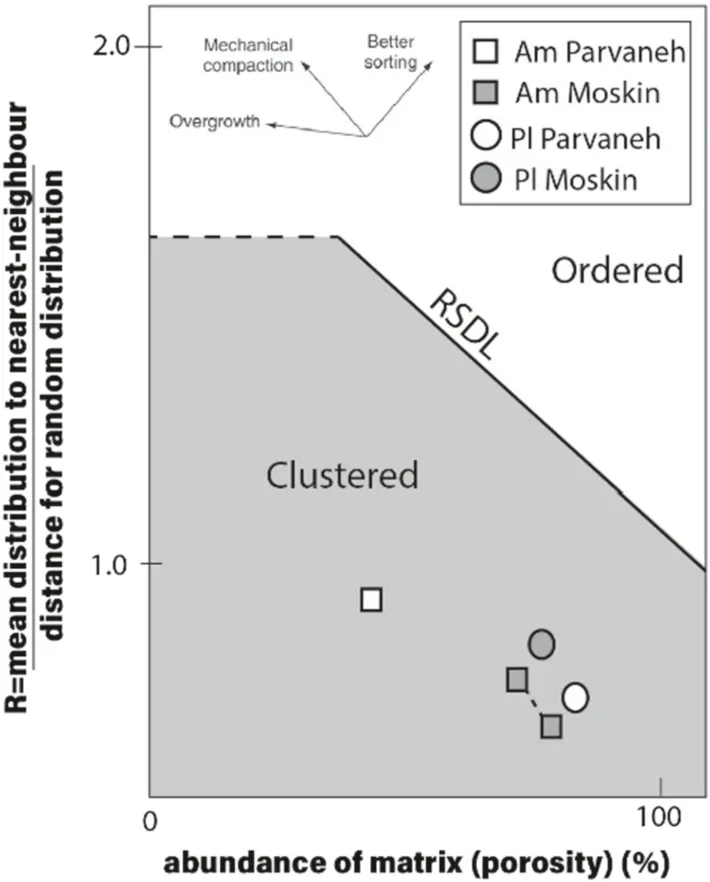
Fig.13 The graph of big R against porosity(sum of other phases)for amphibole and plagioclase grains in the gabbros.The SDP of the crystals in rocks is clustered.The diagram after Jerram et al.(2003)
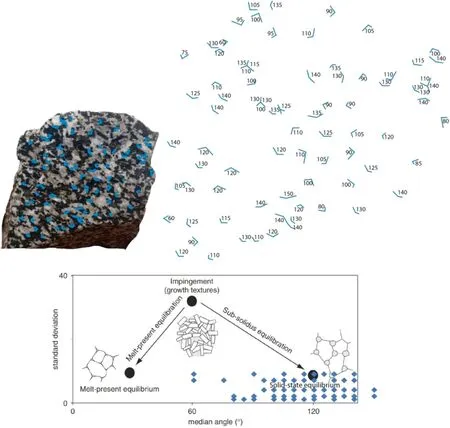
Fig.14 Dihedral angle measurement for Moskin gabbro.The diagram after Holness (2005)

The face of fractions is the surface energy between the phases along the grain boundary and the denominator angle of the same DA between the crystals on the opposing side.To measure this angle, large grains can be cut in specific directions,and the inner parts of the grain can be examined.
In this paper, the DAs of the amphiboles in the slab measured directly by the protractor (Fig.14).Then it was implemented in the relevant diagram(Holness 2005),and it found that the equilibrium in the solid-state was dominant for the crystallization of these rocks because the angles between the crystal surfaces were often about 120 degrees.
7 Conclusion
In general, the mafic rocks of the Parvaneh and Moskin regions near Urmia were studied.The most prevalent minerals in these rocks are reported as plagioclase,amphibole,(+/-)olivine,and pyroxene(in Moskin rocks).The nature of these rocks is calc-alkaline gabbro.In addition, the pattern of rare earth elements for the studied rocks showed enrichment in LREEs (a flat trend for Moskin rocks) compared to HREEs.Furthermore, the geochemical evidence of trace and rare elements for Moskin and Parvaneh gabbro rocks indicated the origin of the spinel-garnet lherzolitic mantle source for them.It reported that rocks belong to a continental arc environment given, and the magma has powerfully recorded the lower crust characters as it passes through it.The gabbroic rocks of the study area have been created by the subduction of the Neo-Tethys oceanic crust below the Sanandaj–Sirjan area(Central Iran microplate) at the active continental margin area.
The CSD pattern of the gabbro’s amphibole and plagioclase also are calculated, and it is clear that there is no magma mixing occurred at the gabbros magma generation.Also, the nucleation was faster than the growth rate (J/G was 5–6 times and exceptionally ten times) at the Moskin and Parvaneh gabbros which determined the initial overstepping degree (undercooling rate) was high and a significant number of nuclei per unit volume for these rocks.The shape of amphibole crystals in gabbros are bladed and bladed to tabular for plagioclase based on the aspect ratio(S:I:L) direct measurements on 2D sections.The Spatial Distribution Patterns (SDPs) are calculated from a big Rvalue based on the nearest neighbor’s theory for amphibole and plagioclase crystals, recognized clustered SDP for all of them.Clusters would improve by reactivation of crystal bodies that solidified at the chamber’s walls and roof or by crashing during resolving.
Also, the dihedral angle (DA) measurements on the outcrop images (between amphibole and plagioclase grains) display that solid-state equilibrium is dominant at the Moskin gabbro.
AcknowledgementsThe author thanks the editors and reviewers of the Journal.The author received financial support from the Natural Science Foundation of Urmia University.
Declarations
Conflict of interestThe author declares that there is no conflict of interest.
Springer Nature or its licensor holds exclusive rights to this article under a publishing agreement with the author(s) or other rightsholder(s); author self-archiving of the accepted manuscript version of this article is solely governed by the terms of such publishing agreement and applicable law.
杂志排行
Acta Geochimica的其它文章
- Fractionation mechanism of iron isotopes in highly fractionated granites from the Xinxian Pluton,Western Dabie Orogen,Central China
- Fluid inclusion studies of the Kenticha rare-element granitepegmatite, Southern Ethiopia
- Petrogenesis and tectonic implications of Late Triassic granitoids in the Alananshan,East Kunlun belt:evidence from geochemistry,geochronology, and zircon Hf isotopic compositions
- TiO2 nanoparticles in aquatic environments: impact on heavy metals distribution in sediments and overlying water
- Comparing mineral weathering and elemental transport between earth’s critical zone with different parent rocks in Yanshan Mountain, Hebei province, China
- U–Pb LA-ICP-MS geochronology of polygenetic zircons from Beshta and Kamenistaya intrusions (the Greater Caucasus)
