In situ mitigation strategies for field emission-induced cavity faults using low-level radiofrequency system
2022-12-20FengQiuYuanHeAnDongWuZhenLongZhu
Feng Qiu• Yuan He• An-Dong Wu• Zhen-Long Zhu•
Guo-Dong Jiang1 • Tian-Cai Jiang1• Zheng Gao1 • Qi Chen1• Zong-Heng Xue1 •Jin-Ying Ma1• Cheng-Ye Xu1• Zi-Qin Yang1,2 • Gui-Rong Huang1,2
Abstract In the Chinese ADS front-end demo superconducting radiofrequency linac (CAFe) at the Institute of Modern Physics, a burst-noise signal-triggered cavity fault frequently appears during beam commissioning. These events are characterized by a rapid burst noise in the cavity pick-up, which may lead to an unexpected low-level radiofrequency (LLRF) response that eventually causes a cavity fault. To eliminate the undesirable reaction of the LLRF control loop,we propose a method that uses a burstnoise detection and processing algorithm integrated into the LLRF feedback controller. This algorithm can prevent undesired regulations in LLRF systems. Data analysis revealed that some burst-noise events did not exhibit measurable energy loss. In contrast, the other events were accompanied by a rapid loss of cavity stored energy and exhibited similarities to the ‘‘E-quench’’ phenomena reported in other laboratories. A particle-in-cell simulation indicated that the suspected E-quench phenomenon may be related to a plasma formation process inside the cavity.Fortunately, the LLRF algorithm is robust to the two different types of burst-noise events and can significantly mitigate the corresponding cavity faults in CAFe beam commissioning.
Keywords Field emission · Flashover · E-quench ·Superconducting · LLRF · CAFe · Plasma formation
1 Introduction
At the Institute of Modern Physics (IMP), a proton facility called the Chinese accelerator-driven system frontend demo superconducting radiofrequency (SRF) linac(CAFe)was built to demonstrate the possibility of a 10-mA high-power continuous-wave (CW) proton beam for the future China Initiative Accelerator-Driven System(CiADS) project [1-4]. CAFe is a 162.5-MHz SRF machine operated in the CW mode. As shown in Fig. 1, it consists of an ion source,a low-energy beam transport line(LEBT), a normal conducting (NC) radiofrequency quadrupole accelerator(RFQ),a medium-energy beam transport line (MEBT), a superconducting (SC) half-wave resonator(HWR) accelerator, a high-energy beam transport line(HEBT), and a beam dump [1]. A total of 23 SC HWR cavities,with different optimizing β(v/c)values of 0.1 and 0.15 (HWR010 and HWR015), were assembled in four cryomodules (CM1to CM4). The 18 HWR010 cavities,which are denoted as CMM-N(where M and N represent the number of cryomodules and the order of the cavity in each cryomodule, respectively), were installed in three identical cryomodules. Five HWR015 cavities (CM4-1to CM4-5) were installed in cryomodule CM4[3]. Table 1 presents the main RF parameters of the six cavities in cryomodule CM3.
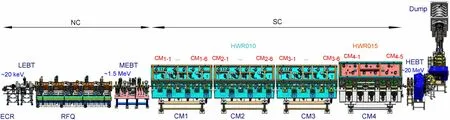
Fig. 1 (Color online) Layout of the CAFe facility. The NC and SC sections are marked in the figure. Two types of HWR superconducting cavities (HWR010 and HWR015) are mounted in four cryomodules (CM1 to CM4). The cavities CM3-1, CM3-3, CM3-5,and CM3-6 are marked by yellow triangles

Table 1 Radiofrequency (RF) parameters of SC cavities in CM3 for 8-mA CW beam operation
Availability and reliability are issues of concern for SRF-based applications, such as light-source linacs, to satisfy user expectations. For CiADS (and CAFe), reliability and availability studies are crucial. According to the operational expertise of SRF accelerator facilities worldwide,RF and cavity faults account for the majority of beam trips. Typical fault mechanisms include microphonics,transient beam loading, thermal quenching, helium fluctuations, and cavity defects associated with field emission(FE)[3,5-11].In particular,one type of cavity fault event,which is characterized by rapid (e.g., ≤7 μs) and large burst noise appearing in the cavity pick-up, is one of the dominant trips at CAFe.
A burst-noise signal appeared in the pick-up probe for the four SRF cavities (CM3-1, CM3-3, CM3-5, and CM3-6(see Fig.1),when the same cryomodule was used.Previous studies indicated that the burst noise at CAFe involves FEinitiated discharge on the RF ceramic window surface[12, 13]. In Ref. [12], these events were attributed to an electron trapping and energy localization process in insulating materials and recognized as ‘‘flashover’’ events.Suspicious burst-noise signals are common and may appear in many facilities. For example, the Shanghai Synchrotron Radiation Facility(SSRF)reported a cavity fault caused by another type of burst noise(known as‘‘arc’’in SSRF)[14].This phenomenon was interpreted as a multipacting arc in the region of the waveguide coupler. Additionally, Diamond Light Source reported burst noise(known as‘‘cavity probe blips’’in Diamond)in the cavity pick-up of two SRF cavities [15, 16]. This phenomenon was attributed to the electronic behavior of the cavity probes in Diamond.Although the formation mechanisms for these burst noises may differ,one aspect is common:rapid and large changes in the cavity pick-up. The burst-noise signal can confuse the low-level radiofrequency (LLRF) control system,leading to undesired reactions that eventually trip the cavity.
The SSRF decreased the operation gradient to mitigate this type of cavity fault; however, this was at the expense of the accelerator’s capability [14]. In CAFe, we added a cap to cover the pick-up coupler in 2019, and the burstnoise events were mitigated by 2020[12,13].However,in the 2021 beam commissioning, many burst-noise events appeared in the cavity pick-up after the cavities were operated with a higher gradient. In Diamond, a 50-kHz filter was added to the LLRF control loops to suppress the burst noise (probe blips). Meanwhile, the loop gain during the period of the burst noise decreased.The risk of a trip is reduced during these activities. However, a lower gain indicates a lower ramp rate for the driver’s power[15].We propose an LLRF algorithm to address burst-noise-induced RF trips. No additional low-pass filters are required in our design;hence,the gain margin is not impacted.In addition,loop gain adjustment is not needed; therefore, the loop performance is not affected. We demonstrated the algorithm in CAFe RF and beam commissioning,and the burstnoise events did not trip the cavity, owing to the proposed LLRF algorithm.
By further inspecting the data with burst-noise events,we were surprised to see that some events did not have measurable changes in the actual cavity voltage (Vc), but other events were accompanied by a sudden(7 μs)drop of Vc.The cavity stored energy W can be calculated as follows[17]:

where ω0and r/Q represent the cavity resonant frequency and the normalized shunt impedance,respectively.Because ω0and r/Q are approximately invariant at the μs scale, the Vcdrop corresponds to an energy loss. Events without energy loss are consistent with the flashover phenomena described in Ref. [12]. However, other events with energy loss are unexplained. Similar phenomena with complete rapid energy loss, which are referred to as E-quench, have been reported in many facilities, such as KEK [18], JLAB[19],and DESY [9].In CAFe, we also observed suspected E-quench phenomena during pulsed RF conditioning on CM3-5[3]. In Fig. 2, RF pulses with and without the suspected E-quench phenomena are presented. The storedcavity energy was completely lost in 1 μs [see Fig. 2b]: In this study, we suspect that a burst-noise event with partial energy loss is a type of mini-E-quench. Fortunately, the proposed LLRF algorithm is robust to the two different burst-noise events.

Fig. 2 (Color online) Waveforms of the RF pulse under RF conditioning in the cases a without E-quench and b with E-quench
2 LLRF and algorithm
Figure 3 presents the waveform of the burst noise in CAFe. Two typical burst-noise patterns were observed.Although the duration and shape differed,these burst-noise signals were large enough to confuse the LLRF system and lead to an undesired proportional-integral (PI) FB loop reaction. Details regarding the field-programmable gate array(FPGA)-based LLRF system can be found in [5,20].A burst-noise detection and processing module was built into the LLRF control loops, as shown in Fig. 4. This module aimed to remove the cavity faults induced by burst noise, which is discussed in detail in this section. An embedded Linux system was installed on an ARM chip integrated into the FPGA. The Experimental Physics and Industrial Control System (EPICS) was installed on the Linux system to achieve data acquisition.
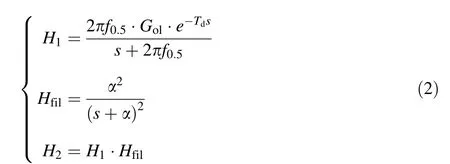
Initially, we followed the activities of Diamond and considered applying a digital low-pass filter to suppress burst noise. Two additional low-pass filters Hfil(s)=α2/(s+α)2were introduced in the LLRF control loops(after the CORDIC module in Fig.4).The parameter α was used to regulate the filter bandwidth.The simulation results are presented in Fig. 5. As shown, the filters improved the signal quality-particularly for the amplitude loop. The amplitude fluctuation was reduced to ±5% in the presence of the filter with a 20-kHz 3-dB bandwidth. However, the phase fluctuation remained larger than 40°under the same conditions.This indicated that the phase may be flipped by 180°even with a low FB gain of 5.Therefore,the risk of an RF trip on the reflected power remains.
In addition, we investigated the impact of the filter on the gain margin by checking the open-loop Bode plots. In CAFe, the cavity half-bandwidth (f0.5) is far smaller than those of the other RF components in the control loop. In our case, the cavity itself contributes only to the dominant poles. Furthermore, we assume that there is no coupling between the control objects[i.e.,the cavity detuning(Δf)is well compensated, and the loop phase is well calibrated].Under these assumptions, the open-loop transfer function of the LLRF system without a filter (H1) and with a filter(H2) can be simplified as

Fig. 3 (Color online) Comparison of the two different burst-noise patterns measured by the LLRF system with a sampling frequency of 1 MHz under feedback (FB) loop control (in the case with the presented‘burst-noise detection and processing’’algorithm,which is discussed later in this paper).The waveforms of these two burst-noise patterns measured using an oscilloscope with a high sampling rate(1.25 GHz) can be found in Ref. [3]

Fig. 4 (Color online)Schematic of the digital LLRF system in CAFe. A burst-noise detection and processing algorithm is integrated into the LLRF control loops (see Fig.6 for details)

Fig. 5 (Color online) a Comparison of the raw and filtered burstnoise signals. The filters used were 2nd-order infinite impulse response filters with the same form Hfil but different 3-dB bandwidths. The burst-noise-induced amplitude fluctuation was reduced to ±5% in the presence of the 20-kHz filter. However, the phase fluctuation remained larger than 40°. b Comparison of the open-loop Bode diagrams for the cases without filters and with filters of different 3-dB bandwidths. For clarity, the frequency response of the 20-kHz 2nd-order filter is shown as well. The filters significantly affected the system phase-margin (PM) values, which are marked in the phase diagram
The open-loop Bode plots in Fig. 5b indicate that the filter significantly reduced the PM in FB control with a lower bandwidth.
The simulation study indicated that the low-pass filter can attenuate noise but creates new problems. In this section,we propose a‘‘burst-noise detection and processing’’algorithm. Because the burst-noise signal is typically characterized by large and rapid changes in the cavity pickup signal, it can be detected by applying a simple digital differentiator in the LLRF loop, as shown in Fig. 6a. The differentiator is used to compute the difference between successive pick-up signal samples. If the absolute value of the difference signal exceeds a predefined threshold, a burst-noise trigger signal (T1) is activated and maintained for a time interval ΔT. In our case, the time period ΔT is typically set as 15 μs, which is longer than the duration of burst noise(which is generally 10 μs).Determination of the threshold value is another critical issue. This value cannot be too small; otherwise, accidental random analog-to-digital converter(ADC)noise can be falsely identified as burst noise. Conversely, if the value is too large, the LLRF system has already responded unexpectedly. In CAFe, the threshold is selected to be approximately 10 times the typical ADC noise amplitude.
A large error signal was sent to the PI FB controller when burst-noise events occurred,leading to an unexpected loop response and eventually causing a cavity fault. A burst-noise processing model is integrated into the PI controller to avoid system collapse. As shown in Fig. 6b,the trigger ‘‘T1’’ first turns switch ‘‘S1’’ to the upper position to prevent the arrival of the large errors arising from the burst-noise events.In this case,the input of the PI controller is connected to a zero register. This activity can prevent unwanted data accumulation of the accumulator‘‘ACC’’ in the I controller. However, part of the error signal can enter the PI controller before the trigger is emitted(see Fig.7).To solve this problem,another switch,i.e.,‘‘S2’’,is temporally switched to a latch(upper position)until the trigger ‘‘T1’’ returns to 0 state. The latch circuit always retains the data from the PI output data of 0.8 μs prior to the rising edge of the burst-noise trigger. Meanwhile, the value in the accumulator ‘‘ACC’’ is replaced by the data in the latch(udelay).When the trigger‘‘T1’’returns to 0, which indicates that the event is ending, the switches‘‘S1’’and ‘‘S2’’return to their normal states (i.e., the lower position).For clarity,Fig.7 shows a schematic of the faulthandling process.

Fig.6 a Schematic of the burstnoise detection algorithm.b Schematic of the burst noise processing algorithm

Fig. 7 (Color online) Principle of the burst-noise detection and processing algorithm. When the LLRF system detects the burstnoise events (indicated by the red square),a burst-noise trigger is immediately emitted and is held for a time interval of ΔT.The PI output of uPI isoverwritten by udelay (the blue square on the left side), which retains the data from uPI 0.8 μs prior to the rising edge of the burst-noise trigger
Although the algorithm cannot distinguish the different burst-noise patterns presented in Fig. 3,it is robust against these two patterns and can achieve stable accelerator operation.
3 Experimental results
To validate the proposed algorithm, we selected cavity CM3-1, which is most significantly affected by burst-noise events. For safety, we first operated CM3-1with a peak gradient of 26 MV/m in the absence of a beam. The parameter ΔT in the algorithm was set to 15 μs.
Figure 8 presents a comparison of the closed-loop performance with and without the proposed algorithm. Figure 8a shows the amplitude and phase of the cavity pick-up signal with and without the proposed algorithm, and Fig. 8b shows the corresponding PI outputs. First, we fed the system without an algorithm. The burst noise led to undesired PI regulation and eventually tripped the cavity(indicated by black). Next, we activated the algorithm and evaluated its performance. When burst noise was detected,the PI regulation was immediately suspended for 15 μs(indicated by red). The overall response process was consistent with the schematic presented in Fig. 7.

Fig. 8 (Color online) Performance of the proposed burst-noise detection and processing algorithm. a Amplitude and phase of the cavity pick-up signal in the cases with (red) and without (black) the proposed algorithm.b Amplitude and phase of the LLRF output in the cases with (red) and without (blue) the proposed algorithm
Additionally,we validated the proposed algorithm in the presence of a beam. We activated the algorithm and operated CAFe with an 8-mA CW beam continuously for 108 h. The RF parameters are presented in Table 1. The gradients of cavities CM3-1, CM3-3, CM3-5, and CM3-6were limited by frequent burst-noise interference. Furthermore, the gradient of cavity CM3-5was limited by the E-quench at approximately 25 MV/m, although the reason remains unclear.The gradient of cavity CM3-6was limited by thermal breakdown at approximately 27 MV/m.During the beam commissioning, we reduced the peak cavity gradients of these two cavities to 23 MV/m to achieve safe beam operation. The loop gains of the LLRF system were set between 30 and 60 (depending on the cavity halfbandwidth) to ensure a gain margin of >20 dB and a closed-loop bandwidth of approximately 10 kHz.RF faults were not observed after the implementation of the proposed algorithm. Figure 9 presents the RF stability, the beam current signal, and the corresponding burst-noise trigger signal for cavity CM3-1over 24 h.
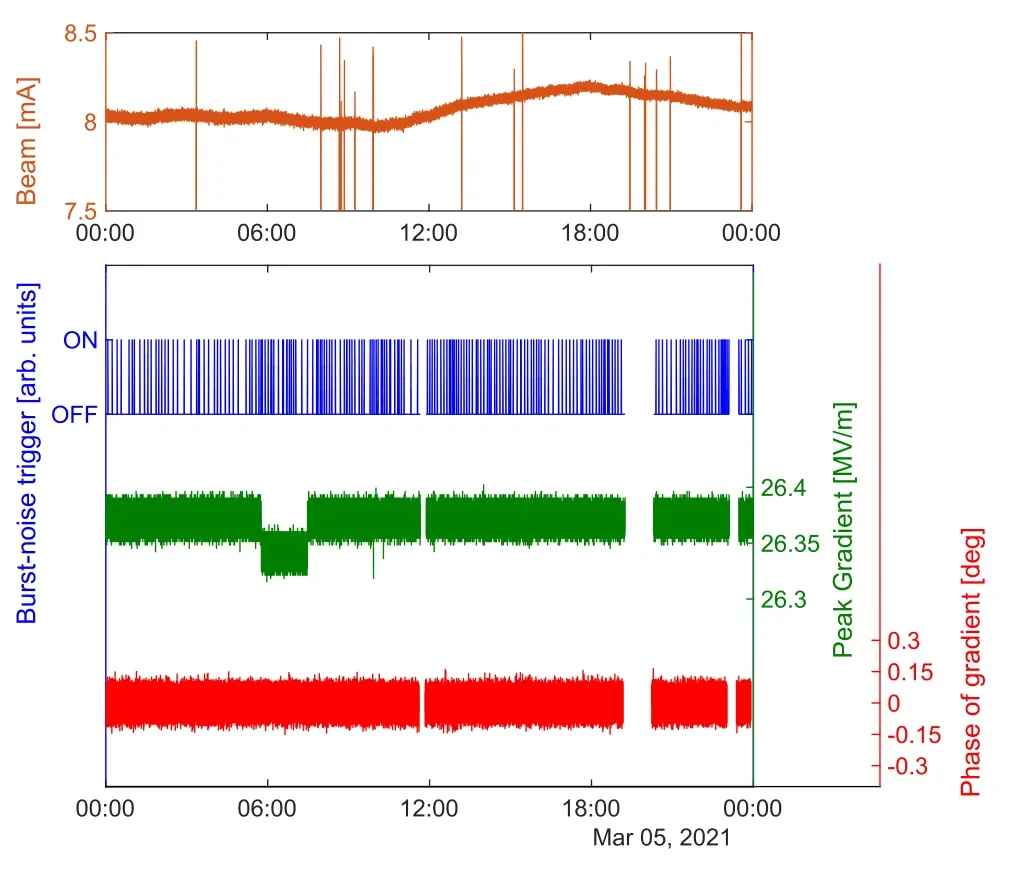
Fig. 9 (Color online) Long-term operation of cavity CM3-1 during the beam commissioning. The blue spike signals indicate the burstnoise events(ON:burst-noise signal appears).The missing samples in the signal are mainly caused by LLRF data communication failure.According to the recorded data of the cavity field,the cavity faults are effectively removed. Spikes are observed in the beam current signal(upper plot), but they are not correlated with the burst-noise events
As discussed in Sect. 4, certain burst-noise events (i.e.,mini-E-quench events) take cavity stored energy and lead to field drops. In practice, to ensure uninterrupted 8-mA beam operation, we set a relatively loose threshold for the maximum tolerable burst noise-induced RF fluctuation (20 μs after the burst noise passes away). The threshold is 2.5 MV/m for the field amplitude and 2.5°for the phase.If the burst noise-induced amplitude and phase changes are below the threshold,the LLRF interlock is not sent out,and the beam is operated without suspension. Because the RF source rapidly compensates for the field drop with a typical timescale of 200 μs,the beam loss caused by these types of burst-noise events is acceptable.Fortunately,the cryogenic load challenge was absent in the field drop process of CAFe. A rapid change in the cavity field leads to an increase in Lorentz force detuning,which affects the cavity phase [21]. This phenomenon was observed at CM3-3and CM3-6. Nevertheless, availabilities of 94% for the CW beam and 98% for the SRF cavity were achieved in CAFe beam commissioning.As indicated by its success in CAFe,this algorithm can be extended to other CW accelerators that suffer from burst-noise perturbation.
Figure 10 shows the overall number of burst-noise triggers over 108 h. It was found that cavities CM3-1and CM3-5frequently triggered burst noise. However, LLRF interlock signals were rare. This indicated that most of the amplitude and phase fluctuations caused by the burst-noise events were below the given threshold,which is clarified in Fig.14 and Sect. 5.To investigate the relationship between the occurrence rate of burst-noise events and the cavity gradient, we temporarily increased the cavity gradient by several millivolts per meter and examined the increment in burst-noise events. The results are shown in Fig. 10. The occurrence rate of events increased with the cavity gradient. This result motivated us to correlate the initial mechanism of burst-noise events with the FE.data and investigate the possible intrinsic physical mechanisms. Although the cavity pick-up may be polluted by burst noise and cannot reflect the actual cavity field, it is possible to reconstruct the actual Vcwith other clean signals. For example, according to Refs. [20, 22-24],

According to the algorithm described in Refs.[20,23],the two complex constants X and Y can be calibrated using the waveform data from the pulsed mode.Figure 11 presents a comparison of the measured Vc and reconstructed Vc values, and the results indicate good consistency. The actual cavity gradient can be calibrated using the known X and Y. Figure 12 shows a comparison of the calibrated Vc and measured Vc values for the two types of burst-noise events. The cavity gradient remains stable in Fig. 12a but significantly decreases in Fig. 12b.
The energy loss shown in Fig. 12b is gradually compensated for by LLRF FB. The cavity QLand cavity detuning (Δω) can be estimated in this power filling process using the formula
4 Discussion
Through the proposed LLRF algorithm,the cavity faults induced by the two different types of burst noise were eliminated. Thus, it is possible to further analyze the fault

Fig. 10 (Color online) Occurrence rate of the burst-noise events in four of the SC cavities at CAFe

Fig.11 (Color online)Comparison of measured Vc and calibrated Vc values obtained using V*f and V*r for cavity CM3-5

Fig. 12 (Color online) Separation of actual Vc from the cavity pick-up merged with the burst-noise signal in the case with the proposed algorithm under FB control
where θ and φ represent the phases Vcand Vf,respectively.The parameters ωRFand ω0.5represent the RF frequency and cavity half-bandwidth, respectively. Figure 13a shows the calibrated QLobtained using the waveform data from Fig. 12b. The QLof approximately 9×10⁵in Fig. 13a is consistent with the QLmeasured from the field decay curve when the RF was turned off. Because the cavity gradient changes rapidly, Lorentz force detuning may appear after the event, as shown in Fig. 13b. The detuning frequency was approximately 200 Hz,which was consistent with that of the cavity mechanical modes.This finding confirms that the actual energy was partially lost in the event presented in Fig. 12b.

Fig. 13 (Color online) a Calibration of the cavity loaded Q (QL)using the waveform data from the energy filling time. The calibrated QL was approximately 9×10⁵, which is consistent with the QL extracted from the field decay curve. b Cavity detuning (caused by rapidly changing cavity gradient) before and after the mini-E-quench event. The ~200-Hz fluctuation is consistent with one of the cavity mechanical modes
Further data analysis indicated that all the cases shown in Fig. 3a exhibited no gradient drop, but all the cases in Fig. 3b involved the gradient drop. As reported in Ref.[12],the events shown in Fig. 3a are flashover phenomena that involve discharge on the surface of the RF ceramic window of the pick-up coupler. Because the pick-up coupler is located in an area with a low energy density, this discharge in the RF window does not consume the cavity energy. The interpretation in Ref. [12] is consistent with the event characteristics shown in Fig.3a.For the events in Fig. 3b, we considered the possibility of attrition of the phenomena to the discharge behavior inside the cavity.Similar phenomena with a sudden and complete loss of the cavity stored energy have been recorded in many facilities,such as KEK, JLAB, DESY, and CAFe (Table 2). JLAB called this phenomenon ‘‘E-quench’’ and interpreted it as the effect of releasing a large number of electrons inside the cavity,which absorb the cavity energy.The events with partial cavity energy loss exhibited similar behavior to the E-quench phenomena.Owing to the lack of sufficient direct evidence, we hypothesize that the phenomena in Fig. 3b indicate the electron emission behavior inside the cavity.In this paper, we categorize burst-noise events with partial energy loss as ‘‘mini-E-quench’’. According to our experience with CAFe, we summarize the characteristics of flashover, mini-E-quench, and E-quench in Table 3.
The abnormal electrons emitted inside the RF cavity are typically referred to as dark current. The dark-current-induced RF transient shown in Fig. 12b can be interpreted as a type of beam loading. It is possible to extract beam information (i.e., beam current and beam phase) from the beam-induced RF transient (see ‘‘Appendix 1’’)[23, 25-27]. Figure 14 shows a comparison of the phases of the dark current as a function of gradient loss in the four cavities with burst-noise events. Interestingly, the plots of all events indicate similar distribution patterns that appear to be independent of the cavity. The reason for this phenomenon remains unclear. Because the mini-E-quench events never appeared in cavities CM3-2and CM3-4or in the cavities mounted in other cryomodules (except for CM3), it is not presumed that a dark current on a cavity upstream was transmitted to the cavities downstream.Further analysis of the dark current-induced transient suggested that the dark current probably had a two-peak shape(a large peak followed by a smaller peak).A detailed analysis is presented in ‘‘Appendix 1’’.
To further investigate the possible source of the dark current, a particle-in-cell (PIC) simulation was performed in the HWR010 cavity using CST Particle Studio. The simulation results indicated that the mini-E-quenchphenomenon was mostly linked to plasma-formation events inside the cavity (see ‘‘Appendix 2’’).

Table 2 Control parameters for the simulation in Fig. 5b
5 Outlook
Another possible solution to the burst-noise issue is to replace the polluted cavity pick-up signal with the calibrated Vcsignal (i.e., Vc =XV*f +YV*r) in the FPGA. As shown in Fig. 12, burst noise did not appear in the calibrated signal. Therefore, the burst-noise processing algorithm in Fig.6 is generally not required.Another advantage of this method is that we can directly identify suspected mini-E quench events by appropriately modifying the burst-noise detection algorithm. The calibration factors X and Y may be affected by other quantities, such as the cavity forward power or temperature drift, but this is beyond the scope of the present study.
The hypothesis regarding mini-E-quench and flashover presented in Sect. 4 lacks direct evidence.Therefore,a fast radiation detector is necessary. Several activities can be performed in future studies to confirm our hypotheses.One possible solution is to replace the current pick-up coupler with a magnetic coupling pick-up coil in a high-magnetic field area that is far from the high-electric field area. The electron and ion bombardment rates in the pick-up coupler may be significantly reduced,and the burst-noise issue may be mitigated.
6 Conclusion
In CAFe, two different types of burst-noise signals confuse the LLRF system, leading to undesired reactions and eventually causing cavity fault.We developed a burstnoise detection and processing algorithm and integrated it into the LLRF control loop to avoid undesired LLRF FB regulation. Data analysis indicated that one type of burstnoise event is associated with significant gradient loss,whereas the other type is without gradient loss. We categorized the burst-noise events as flashover(without energy loss) and mini-E-quench (with partial energy loss)accordingly. The proposed algorithm eliminated cavity faults caused by both types of burst noise in CAFe beam commissioning.Further analysis indicated that the gradient loss in the mini-E-quench event and the corresponding dark-current phase obeyed the specified distribution rules.The reasons for this phenomenon remain unclear. A PIC simulation suggested that the mini-E-quench is probably linked to a plasma-formation event.

Table 3 Characteristics of Equench, mini-E-quench, and flashover

Fig. 14 (Color online) Phase of the dark current as a function of the dark current-induced field loss. The plots for the four cavities in which the mini-E-quench events appeared obey similar rules
Appendix 1: Approach for characterizing dark current

Fig. 15 (Color online) Principle for characterizing the beam phase using a beam-induced transient signal. a Amplitude and phase of the cavity field with the beam-induced transient. b Cavity voltage in Cartesian coordinates. The red arrow indicates the beam transient vector
We can obtain the beam information according to the beam-induced RF transient. This principle is explained in Fig. 15. The amplitude and phase of the transient field induced by the beam are shown in Fig.15a.The short blue lines represent the cavity field before the beam arrival.The red line represents the beam-induced transient when the beam passes through the cavity. The short green lines depict the case where the beam ends. The cavity field is a superposition of the generator-induced field and the beaminduced field within this moment. Accordingly, the beam transient vector was geometrically added to the cavity field in Cartesian coordinates. The beam phase (φb) can be obtained by computing the angle between Vc(the moment before the arrival of the beam) and the beam transient vector,i.e.,ΔVind[see Fig.15b].Additionally,the length of ΔVindis directly proportional to the beam intensity.
Figure 16a shows the amplitude and phase (A/P)waveform of the peak gradient on CM3-3for four different mini-E-quench events. The corresponding I/Q components in Cartesian coordinates are shown in Fig. 16b. The phase between the dark current and the cavity field can be calibrated using the aforementioned method. ΔVindcan be obtained by fitting a linear equation to the RF transient:
The dark-current profile can be roughly estimated from the dark current-induced transient using the cavity differential equation [17, 23, 28]

where Vfand Vbrepresent the forward and current-induced voltages,respectively.To increase the signal-to-noise ratio of the waveform data, we deliberately selected a mini-Equench event that caused a gradient loss of 9 MV/m in cavity CM3-3(not shown in Fig.14).The estimated current profiles are shown in Fig.17.Interestingly,the dark current exhibited a two-peak shape (a larger peak followed by a smaller peak).The maximum dark current during this event was approximately 2.4 A. In this calibration, we used a transit time factor of 0.7, which is the optimized value for the HWR010 cavity. The actual peak dark current should be >2.4 A(because the speed of the electrons changes on a large scale). The data analysis indicated that for all the events in Fig. 14, the dark currents had similar two-peak shapes with different phases and intensities.

Fig. 16 (Color online) a Calibrated amplitude and phase waveform of the cavity field of CM3-3 for the four different mini-E-quench events.b Corresponding in-phase and quadrature (I/Q) components in Cartesian coordinates

Fig. 17 Estimated dark-current profile based on the dark currentinduced transient
Appendix 2: PIC simulation
When the HWR010 cavity was operated at its fundamental mode frequency, the maximum electric field was located in the inner conductor, as shown in Fig. 18a.Therefore, electrons were most likely emitted from the inner conductor, as shown in Fig. 18b. The emitted electrons are then accelerated in the electric field and collide with the outer surface of the cavity.In the CST PIC solver,we selected a face emitter in the inner conductor.The fieldemitted current density, i.e., jFE, conforms to Fowler-Nordheim (FN) theory [29, 30] and can be expressed as
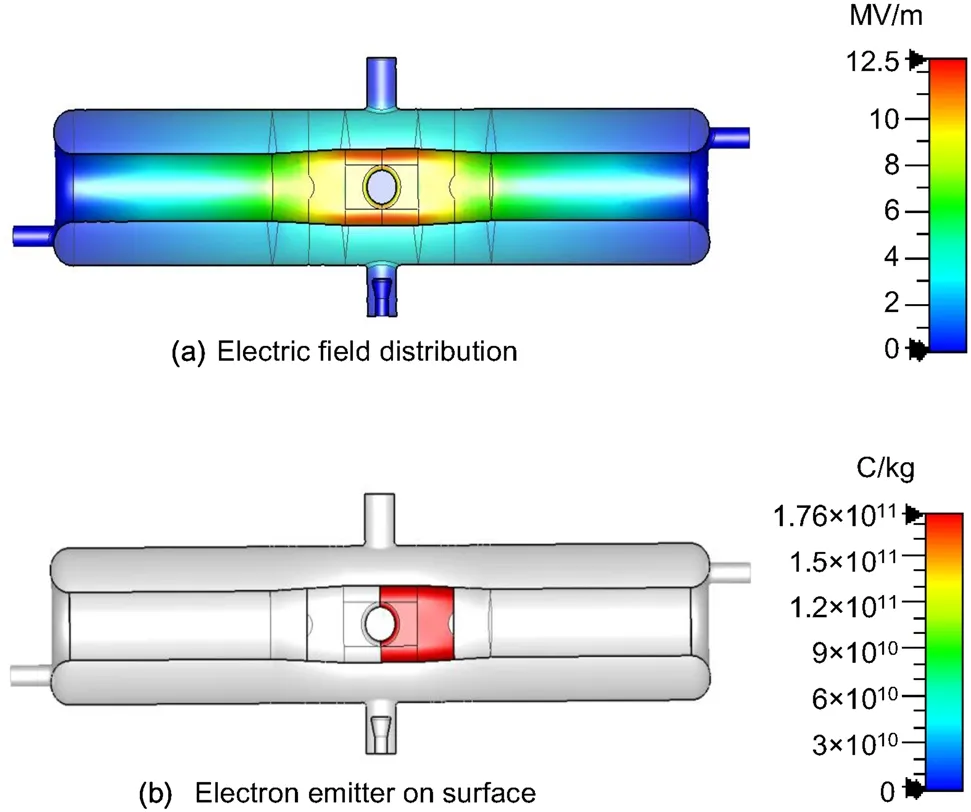
Fig. 18 (Color online) a Electric-field distribution in an HW010 cavity.b The inner conductor(indicated by the red area)is selected as the face-emitter in the CST PIC server

where parameter φ represents the work function of the material in eV(for niobium,φ=4.3 eV),Es represents the surface electric field. The parameter βFNis the enhancement factor, which describes the ratio of the local electric field to the average surface field.In the PIC simulation,we selected two enhancement factors:βFN=130 and βFN=1000.In Fig.19,the dark blue curve shows the distribution of the initial field-emitted current. The red curve indicates the current at which the emitted electrons collide with the outer conductor. The RF field was also plotted, for comparison.As shown in Fig. 19, the maximum phase between the FE current and RF was approximately 12°.This is inconsistent with the results presented in Fig.14,which indicate a darkcurrent phase between 15°and 50°.

Fig.19 (Color online)Initial FE current(dark blue)versus the FE current when the electrons collide with the outer conductor for a βFN=130 and b βFN=1000. The phase between the FE current and RF is ~12° (indicated by the magnified plots on the right side)
Another possible source of the dark current is plasma formation. The FE current ionizes the absorbed gas, and a dense plasma sheath is formed around the emitter on a short timescale (sub-microsecond). This process is consistent with the arcing mechanism in an RF device [31]. The plasma creates an electric field on the local RF surface that can reach GV/m levels[32],making it far stronger than the RF field(e.g.,Epeak<30 MV/m in CAFe).The FE current increases exponentially with an increase in the field strength. Here, the dark current is mainly contributed by the field-emitted electrons (on the local RF surface) and ions in the dense plasma. The current density (which is limited by the space charge effects) can reach 1012A/m2.As shown in Fig. 14, the estimated dark current was approximately 0.1 ~ 1 A, corresponding to an emissive area of 0.1 ~ 1 μm2, which is consistent with Refs.[31, 33]. Many smaller droplets and debris are ejected and randomly distributed near the FE site with the explosion of the original emitters (e.g., projection and particles) on the RF surface. The smaller droplets and debris may create a new plasma cloud and trigger a secondary chain of events.The two peaks in Fig.19 may correspond to two successive plasma-formation events.The main peak was caused by the explosion of the original emitter. In contrast, the subpeak was probably due to the second plasma-formation event related to the smaller debris created by the explosion of the original emitters. Finally, the electrons and positive ions from two successive plasma-formation events may collide with the pick-up antenna.Consequently,the cavity pick-up signal rapidly jumped up and down. According to the foregoing analysis, we conclude that the mini-E-quench events are most likely linked to the plasma-formation events inside the cavity rather than the ceramic window.
AcknowledgementsWe thank all the members of the CAFe commissioning team for providing stable beam operation. We also thank all the operation staff members for their cooperation and help during the machine study.
Author contributionsAll authors contributed to the study conception and design. Material preparation, data collection and analysis were performed by Feng Qiu, Yuan He and An-Dong Wu. The first draft of the manuscript was written by Feng Qiu and all authors commented on previous versions of the manuscript. All authors read and approved the final manuscript.
杂志排行

Nuclear Science and Techniques的其它文章
- Design and fabrication of button-style beam position monitors for the HEPS synchrotron light facility
- Spectral baseline estimation using penalized least squares with weights derived from the Bayesian method
- Investigating core axial power distribution with multiconcentration gadolinium in PWR
- Optimization study and design of scintillating fiber detector for DT neutron measurements on EAST with Geant4
- Method for detector description transformation to Unity and application in BESIII
- Improvement of the Bayesian neural network to study the photoneutron yield cross sections