Serum Metabolomic Characteristics of Primary Dysmenorrhea Rat Model Induced by Estradiol Benzoate Combined with Oxytocin
2022-11-28ZemingZHANGWeiLIULinnaJIAJiashuoJUZilongQIShuoLIUJieWANGZhipingNIUHuiXIONG
Zeming ZHANG, Wei LIU, Linna JIA, Jiashuo JU, Zilong QI, Shuo LIU, Jie WANG, Zhiping NIU,Hui XIONG
1. College of Traditional Chinese Medicine, Chengde Medical University, Chengde 067000, China; 2. School of Basic Medicine, Chengde Medical University, Chengde 067000, China; 3. Hebei Key Laboratory of Study and Exploitation of Chinese Medicine, Chengde Medical University, Chengde 067000, China
Abstract [Objectives] To investigate the serum metabolomic characteristics of primary dysmenorrhea rat model induced by estradiol benzoate combined with oxytocin, and to reveal its material basis. [Methods] 20 female SD rats were randomly divided into control group and model group. The primary dysmenorrhea rat model was established by subcutaneous injection of estradiol benzoate for 10 consecutive days and intraperitoneal injection of oxytocin on the last day. The serum samples of rats in control group and model group were collected by ultra-performance liquid chromatography (UPLC) quadrupole time-of-flight mass spectrometry (Q-TOF-MS). The differential metabolites were identified by multivariable pattern recognition method and endogenous metabolite database, and the metabolic pathways were enriched by Metaboanalyst 5.0 platform. [Results] There were significant differences in serum metabolic profiles between the two groups. A total of 36 potential biomarkers of primary dysmenorrhea including L-tyrosine, glycocholic acid, citric acid, palmitoyl carnitine and cholesterol were screened and identified, mainly involving metabolic pathways such as phenylalanine, tyrosine and tryptophan biosynthesis, glycerophospholipid metabolism, and primary bile acid biosynthesis. [Conclusions] The serum metabolic profile of primary dysmenorrhea rats deviates significantly from that of healthy rats, and there are multiple metabolic pathway disorders, which are mainly related to phenylalanine, tyrosine and tryptophan biosynthesis, glycerophospholipid metabolism, and primary bile acid biosynthesis.
Key words Primary dysmenorrhea, Metabolomics, Biomarkers, Serum, Material basis
1 Introduction
Primary dysmenorrhea (PD) is the most common gynecological disease among young females. According to epidemiological statistics, the incidence of primary dysmenorrhea varies greatly at home and abroad, roughly in the range of 0.9% to 94%[1]. It seriously affects the daily life of young females. Its pathogenesis is complex. At present, the most commonly recognized secretory pathways are prostaglandin[2], vasopressin[3], and endothelin[4]. Its biological essence is still under exploration. Therefore, it is necessary to systematically study the material basis of primary dysmenorrhea from an overall perspective. The occurrence of disease will give rise to changes in metabolites in the body. Metabolomics focus on the overall changes of metabolites in the body after pathological, physiological stimulation or genetic modification. Metabolomics can identify low molecular weight metabolites of the entire metabolic network, especially characteristic potential biomarkers, thus it is suitable for revealing the material basis of complex pathological mechanisms of diseases[5].
In this experiment, we established the primary dysmenorrhea rat model by subcutaneous injection of estradiol benzoate combined with intraperitoneal injection of oxytocin. Using non-targeted metabolomics technology, we made an overall analysis of the potential biomarkers and related metabolic pathways in the serum of primary dysmenorrhea rats and healthy rats, to reveal theinvivometabolic characteristics of primary dysmenorrhea and provide an experimental basis for exploring the pathogenesis of primary dysmenorrhea.
2 Materials and methods
2.1 MaterialsAB SCIEX UPLC (AB SCIEX, USA); AB Sciex Triple-TOF 5600+system (AB SCIEX, USA); Analyst TF 1.7 Software workstation (AB SCIEX, USA); 5427R High Speed Low Temperature Centrifuge (Eppendorf, USA); acetonitrile (Fisher, USA); formic acid (Fisher, USA); Oxytocin Injection (10 U/mL, Shanghai Quanyu Biotechnology Animal Pharmaceutical Co., Ltd., China); Estradiol Benzoate Injection (2 mg/mL, Shanghai Quanyu Biotechnology Animal Pharmaceutical Co., Ltd., China); 20 SD female rats (SPF grade), (174±21) g, were purchased from Beijing HFK Bio-Technology Co., Ltd. with license number of SCXK (Beijing) 2019-0008.
2.2 Animal modeling and sample processingAfter adaptation to the environment for one week before the experiment, rats were randomly divided into blank group and model group, 10 rats in each group. Rats in the model group were subcutaneously injected with estradiol benzoate injection for 10 consecutive days, once a day, the first and last doses were 1 mg/kg, and the doses were 0.5 mg/kg on the 2ndto 9thd. On the 10thd, 1 h after the last administration, oxytocin was injected intraperitoneally at a dose of 25 U/kg. Rats in the blank group were subcutaneously injected with an equal volume of normal saline. On the last day of modeling, the rats were anesthetized, and the blood was quickly taken from abdominal aorta, left standing for 30 min, centrifuged at 4 ℃, 4 000 rpm for 10 min, and stored at -80 ℃. Before analysis, thawed at room temperature, took 200 μL serum and added 800 μL methanol to precipitate proteins, vortex oscillated for 30 s, ultrasonic treated for 1 min, and centrifuged at 13 000 rpm/min for 10 min. Pipetted 800 μL of the supernatant, dried in vacuum at 40 ℃, dissolved the residue again with 200 μL of 60% methanol, ultrasonic treated for 1 min, vortex oscillated at 4 ℃ for 30 s, centrifuged at 13 000 rpm/min for 10 min, took the supernatant and screened with 0.22 μm filter membrane for UPLC analysis. The QC samples were taken and mixed in the same volume for each serum sample for the control of system and sample stability.
2.3 UPLC-Q-TOF-MS analysisChromatographic column ACQUITY UPLCTM BEH C18(100 mm×2.1 mmi.d., 1.7 μm); mobile phase A was 0.1% formic acid water, and mobile phase B was 0.1% formic acid acetonitrile; column temperature: 40 ℃; flow rate: 0.4 mL/min; injection volume: 5 μL; gradient elution process: 0-3.5 min, 95%-85% A; 3.5-6.5 min, 85%-70% A; 6.5-12.5 min, 70%-30% A; 12.5-18.5 min, 30%-0% A; 18.5-25 min, 0% A. Mass spectrometry conditions: The bombardment energies of positive ion mode and negative ion mode were 40 eV and -40 eV, respectively, and the collision energy difference was 20 V. The parameters of ESI ion source were set as follows: atomizing air pressure (GS1) 55 Psi, auxiliary air pressure (GS2) 55 Psi, air curtain air pressure 35 Psi, source temperature 500 ℃, spray voltage of positive ion mode and negative ion mode were 5 500 V and -4 500 V respectively, scanning range was 100-1 500 Da. Dynamic background subtraction (DBS), a QC sample was injected every 5 needles, and the system stability was checked for quality control.
2.4 Data processingSerum UPLC-Q-TOF-MS data were peak aligned and normalized using MarkerView 1.3.1 software, extracted the 3D data of metabolite ion retention time-mass-to-nucleus ratio-peak intensity. Pattern recognition analysis was carried out by using principal component analysis (PCA) and orthogonal partial least squares-discriminant analysis (OPLS-DA) methods provided by EZinfo 2.0 software. Differences between groups were tested byTtest, and ions withP<0.05 and VIP>1 were used as potential candidate variables. Through search of secondary fragments, databases HMDB (http://www.hmdb.ca/), METLIN (http://metlin.scripps.edu/metabo_search_alt2.php?&return=yes), combined with chromatographic retention time and MS/MS data, the chemical structure of the marker was determined. Finally, the screened markers were imported into MetaboAnalyst 5.0 for metabolic pathway enrichment analysis.
3 Results and analysis
3.1 Stability analysis of samples and equipmentIn order to determine the stability of the instrument during data collection, we prepared QC samples in this experiment. QC samples were inserted into the sequence of tested samples and run every 2 h. Evaluation of QC samples is an important operation in metabolomic analysis. If the mass spectral retention time and mass number are shifted, the QC sample will have a large deviation in the data analysis, and the sample needs to be re-injected and analyzed. Fig.1 shows all the QC samples in the sample collection process. It was found that in positive and negative ion modes, all QC samples were clustered together, and the mass spectral retention time did not shift, so we determined that the instrument is stable during data collection, and the collected sample data is credible.

Note: a. negative ion mode; b. positive ion mode.
3.2 Analysis of serum base peak chromatogramThe serum samples of the blank group and the model group on the 10thd of modeling in the experiment were taken and processed according to the treatment method of serum samples. In accordance with the optimized chromatographic and mass spectrometry conditions, the serum samples were scanned in positive and negative ion modes to obtain the metabolic profile base peak chromatogram of serum samples. The base peak chromatogram provides the basic information of the endogenous metabolites in the blood of the two groups of rats, and the visual analysis results show that there are certain differences in the base peak chromatogram profile (Fig.2).

Note: a. blank group in negative ion mode; b. model group in negative ion mode; c. blank group in positive ion mode; d. model group in positive ion mode.
Fig.2 Base peak chromatograms of blood samples in model group and blank group in positive and negative ion modes
3.3 Pattern recognitionThrough the analysis of serum base peak chromatogram, it was found that there was a certain difference in the metabolic profile between the blank group and the model group. Some components with differences were hidden in the peaks, and it was difficult to distinguish them intuitively. In order to accurately reflect the small differences between groups, it is necessary to reduce the dimensionality of complex data, effectively eliminate the overlapping parts in the coexistence of multiple information, and extract the principal components for analysis. Therefore, in this experiment, we used multivariate data processing technology to conduct principal component analysis on the two groups. Using Ezinfo software analysis, we obtained the three-dimensional metabolic profile information (retention time_mass-to-nucleus ratio_peak intensity) of the metabolic trajectory samples of the blank group and the model group and observed the clustering grouping. Fig.3 shows that the blank group and the model group can be clearly distinguished, indicating that the endogenous metabolites of the rat body are significantly disturbed after modeling.

Note: a. 2D PCA score chart in negative ion mode; b. 3D PCA score chart in negative ion mode; c. 2D PCA score chart in positive ion mode; d. 3D PCA score chart in positive ion mode.
Further using the OPLS-DA analysis method, we reduced the dimensionality of the data to facilitate the screening of differences between groups. As shown in Fig.4, the blank group and the model group in both the positive and negative ion modes have obvious separation. In positive ion mode, R2Y and Q2were 0.941 and 0.757, respectively; in negative ion mode, R2Y and Q2were 0.945 and 0.764, respectively, indicating that the modeling is accurate and reliable.

Note: a. 3D OPLS-DA score chart in negative ion mode; b. 3D OPLS-DA score chart in positive ion mode.
3.4 Identification and differential analysis of potential biomarkersIn order to effectively find potential endogenous metabolites that play a key role in cluster grouping, we used the established OPLS-DA model to obtain S-plot and VIP plot (Fig.5). As shown in Fig.5, the farther from the origin, the greater the contribution to the changes in metabolic profile trajectories. We selected ions with VIP greater than 1 andPvalue less than 0.05 as potential biomarkers. In negative ion mode, we identified 15 biomarkers; in positive ion mode, we identified 16 biomarkers. As shown in Fig.6, after modeling, the serum levels of 15 biomarkers increased extremely significantly (P<0.01), 8 biomarkers increased significantly (P<0.05), 3 biomarkers decreased extremely significantly (P<0.01), and 5 biomarkers decreased significantly (P<0.05).
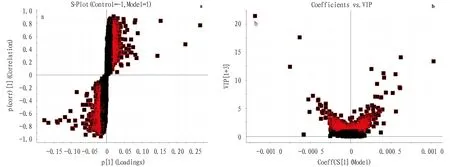
Note: a. S-plot; b. VIP plot.

Note: compared with the blank group, **P<0.01; *P<0.05.
3.5 Metabolic pathway analysis of potential biomarkersWe imported the corresponding 31 blood metabolic markers into the Metaboanalyst platform for metabolic pathway topology analysis. Using the Impact value greater than 0.05 combined with literature reports as the screening criteria, we obtained five metabolic pathways most related to primary dysmenorrhea, mainly including phenylalanine, tyrosine and tryptophan biosynthesis, glycerophospholipid metabolism, primary bile acid biosynthesis, citric acid cycle and tryptophan metabolism, as shown in Fig.7 and Table 1. The five core markers involved were L-tyrosine, lysophosphatidylcholine [22∶5 (7Z,10Z,13Z,16Z,19Z)], cholesterol, glycocholic acid, and phosphatidylcholine compounds. Among them, L-tryptophan was involved in phenylalanine, tyrosine and tryptophan biosynthesis and tyrosine metabolism; cholesterol and glycocholic acid were involved in primary bile acid biosynthesis; phosphatidylcholine compounds, lysophosphatidylcholine [22∶5 (7Z,10Z,13Z,16Z,19Z)] was involved in glycerophospholipid metabolism; citric acid was involved in tricarboxylic acid cycle.

Table 1 Analysis results of metabolic pathways related to blood biomarkers in primary dysmenorrhea

Note: 1. phenylalanine, tyrosine and tryptophan biosynthesis; 2. glycerophospholipid metabolism; 3. primary bile acid biosynthesis; 4. citric acid cycle; 5. tyrosine metabolism.
4 Discussion
Metabolomics uses high-throughput, high-resolution detection technology, combined with expert systems and pattern recognition analysis methods, to reveal the overall rules of changes in metabolites stimulated by internal and external factors, discover and screen biomarkers, objectively evaluate the end products of biochemical networks of organisms, and to explain biological phenomena, which is of great significance for revealing the metabolic mechanism of complex diseases[6-7]. In this experiment, we established a primary dysmenorrhea rat model by estradiol benzoate combined with oxytocin. Based on UPLC-Q-TOF-MS combined with multivariate pattern recognition, we screened the most relevant blood biomarkers including L-tyrosine, phosphatidylcholine compounds, cholesterol, glycocholic acid, and citric acid, mainly involving metabolic pathways such as phenylalanine, tyrosine and tryptophan biosynthesis, glycerophospholipid metabolism, primary bile acid biosynthesis and citric acid cycle.
In this experiment, we found that tyrosine in the phenylalanine, tyrosine and tryptophan biosynthesis and tyrosine metabolism pathway was highly expressed in serum. Tyrosine metabolism was closely related to phenylalanine, tyrosine and tryptophan biosynthesis, and the two could be transformed into each other. When amino acid metabolism is abnormal, tyrosine will accumulate in the body, and promote the synthesis of prostaglandins by activating tyrosine receptors[8]. Modern medicine has shown that the increased content of prostaglandins in the endometrium of rats is the main pathogenesis of primary dysmenorrhea; prostaglandins are released from the endometrium, causing excessive contraction of uterine smooth muscle and blood vessels, accordingly leading to dysmenorrhea[9]. Tyrosine is an important amino acid that can generate a variety of metabolites and is a major raw material for the synthesis of thyroxine. Thyroxine is a hormone synthesized and secreted by the thyroid gland, the terminal target organ of the hypothalamic-pituitary-thyroid axis. The level of thyroxine is regulated by the hypothalamus, pituitary and thyroid hormone levels in the body, and the dynamic balance of plasma hormone levels is maintained in the hypothalamic-pituitary-thyroid system. In this experiment, we found that the L-tyrosine content in the blood of the model rats was higher than that of the blank group, suggesting that the synthesis, storage and release of thyroxine in the body were disordered. Relevant research has shown that excessive thyroxine may lead to the occurrence of dysmenorrhea[10].
Disorders of the primary bile acid biosynthesis pathway are involved in the pathogenesis of various diseases. In this experiment, we found that the primary bile acid biosynthesis pathway significantly increased the synthesis of glycocholic acid in the blood, while the cholesterol was significantly decreased. Bile acids are synthesized from cholesterol in the liver and are the main elimination pathway of steroid substances in the body. By source, bile acids can be divided into primary bile acids, secondary bile acids, and tertiary bile acids. Cholesterol starts from 7α hydroxylation in hepatocytes, and then through 12α hydroxylation and 27α hydroxylation, the side chain is broken to generate cholic acid and chenodeoxycholic acid, respectively, and then combined with taurine and glycine to become conjugated primary bile acid, such as glycocholic acid[11]. Enterohepatic circulation of bile acids is carried out 10 times a day, and about 95% of bile acids are reabsorbed into the liver for reuse, and then excreted in the feces. The injection of estradiol benzoate in rats increases the level of estrogen, and estrogen inhibits bile acid reflux and bile acid excretion, resulting in bile acid accumulation[12]. Some study has shown that women with dysmenorrhea are associated with bile acid turnover, and that the decrease in bile turnover can trigger dysmenorrhea[13].
Glycerophospholipid metabolism includes changes in metabolites such as phosphatidylcholine (PC) and lysophosphatidylcholine (LysoPC), which mainly occur in tissues such as liver, kidney, and uterus. PC is abundant in the brain, adrenal glands, and red blood cells. Lysophosphatidylcholine is a metabolite of glycerophospholipids that removes a molecule of fatty acid. It exists in the body’s plasma, and most of it is bound to plasma proteins, including LysoPC [22∶4 (7Z,10Z,13Z,16Z)/0∶0], LysoPC [20∶2 (11Z,14Z)/0∶0], LysoPC(17∶0/0∶0),etc., which are considered to be biomarkers between normal rats and dysmenorrhea rats[14]. Lysophosphatidylcholine can be converted into lysophosphatidic acid and act as a messenger molecule that plays a role in intercellular conduction, mediating various biological effects, including promoting the contraction of smooth muscle and blood vessels. In addition, studies have confirmed that lysophosphatidic acid can also promote the expression of cyclooxygenase-2, a key enzyme in the synthesis of prostaglandins, promote the secretion of prostaglandins, and lead to the occurrence of dysmenorrhea[15]. According to reports, glycerophospholipid metabolism dysfunction affects mitochondrial activity, participates in tricarboxylic acid cycle, and then influences the occurrence and development of primary dysmenorrhea[16]. In this experiment, we found that lysophosphatidylcholine and phosphatidylcholine compounds were disturbed. Compared with the blank group, the concentrations of these markers in the model group were significantly increased, consistent with literature reports, and can be used as diagnostic markers for primary dysmenorrhea.
Citric acid is a major intermediate in the tricarboxylic acid cycle (TCA) that occurs in mitochondria. Mitochondrial dysfunction may give rise to a decrease in citrate in the blood[16]. Studies have found that endometrial cell damage and blood circulation disorders in patients with dysmenorrhea will lead to mitochondrial dysfunction[17]. Besides, mitochondria can store calcium ions and control the homeostasis of calcium concentration in cells. Mitochondrial dysfunction may lead to contraction of endometrial smooth muscle, resulting in increased intracellular calcium concentration and subsequent symptoms of primary dysmenorrhea. Through the metabolomics study, it was found that the content of citric acid in the blood of dysmenorrhea rats was significantly lower than that of the blank group, indicating that the citric acid cycle disorder leads to mitochondrial dysfunction, promotes uterine smooth muscle contraction, and ultimately induces the dysmenorrhea.
In this experiment, using the UPLC-Q-TOF-MS technology combined with the multivariate pattern recognition method, we studied the serum metabolomic characteristics of the primary dysmenorrhea rat model, and revealed the material basis of its pathogenesis including 31 potential biomarkers, mainly phenylalanine, tyrosine and tryptophan biosynthesis, glycerophospholipid metabolism, primary bile acid biosynthesis and citric acid cycle and other metabolic pathways, which jointly influence the progress of primary dysmenorrhea. It is expected to lay an experimental foundation for the discovery of new diagnostic and/prognostic related disease markers, so as to deeply understand the inner mechanism of primary dysmenorrhea. However, its core mechanism requires a precise point-to-point analysis.
杂志排行

Medicinal Plant的其它文章
- Establishment of Quality Standard for Freeze-dried Tablets of Polygonatum sibiricum and Study on Anti-tumor Activity of Diosgenin
- Herbal Textual Research of Inulae Flos in Chinese Classic Prescription
- Quality Standard of Zijinbiao
- Quality Standard of Yi Medicinal Material Anaphalis margaritacea
- Protective Effects of Six PPTs on Hypoxia/Reoxygenation Induced Cardiomyocyte Injury by Different Treatments
- Prescription Design and Preparation Process of Paeonol Bead Popping Gum with Hypoglycemic Effect