Geological mapping and mining prospecting in the Aouli inlier (Eastern Meseta,Morocco) based on remote sensing and geographic information systems (GIS)
2022-11-28LkhlifBenissiAmrouiTrekAdnneToiHssnIouhKhdrZidKhlidElmriMohmedHiti
Lkhlif Benissi, Amroui Trek, Adnne Toi,*, Hssn Iouh, Khdr Zid, Khlid Elmri,Mohmed Hiti
a Laboratory of Georessources, Department of Geosciences, Faculty of Sciences and Technics, Moulay Ismail University, Errachidia 52000, Morocco
b Laboratory of Georessources, Geoenvironment & Civil Engineering, Department of Earth Sciences, Faculty of Sciences and Technologies of Marrakesh, Cadi Ayyad University,Marrakesh 40000, Morocco
c Department of Earth Sciences, Faculty of Sciences. Mohamed First University, Oujda 60000, Morocco
Keywords:Remote sensing GIS Aouli inlier Mining prospecting Multi-criteria analysis
ABSTRACT Landsat 8 Oli, ASTER, and Sentinel 2A satellite images processing was used to map geological formations, lineaments and hydrothermal alteration minerals in the Aouli inlier, as a case study to illustrate the application of digital images processing and Geographic Information System (GIS) in geological mapping and mining prospecting. Principal Component Analysis (PCA) applied to the Landsat images allowed good lithological discrimination and contributed to the updating of available geological maps. The Automatic lineament extraction from Sentinel images revealed the main tectonic structures affecting Aouli inlier. The ratio bands (b5+b7)/b6 and the false color composite (b4/b6, b2/b1, b3/b2) allowed the hydrothermal alteration minerals mapping from Aster images. Combined with available geological data and field observations, the satellite derived data were integrated and analyzed in a GIS software to establish mining prospecting guides. The results showed that the anomaly zones are intimately linked to NNE-SSW and NW-SE oriented faults and to highly fractured areas developing argillic and Fe rich alterations. Verified via field survey, this approach was successfully applied to the Aouli inlier to rapidly target potential areas to be explored in the tactical phase. This provides a model for future prospecting efforts for similar mineral deposits in other areas.
1. Introduction
Exploring for minerals is a challenge that miners need to approach with as much information as possible. Metals and minerals can easily be missed, and the process of searching for them is an expensive risk. In mineral exploration, aerial and satellite imagery provides one route of quickly examining large land areas and of identifying mineralization, reducing by the way, the exploration costs and time in the areas difficult to access (Kruse FA et al., 2003; Pournamdari MO et al., 2014).
In recent years, remote sensing images and Geographic information systems (GIS) constituted a powerful tool for geological mapping (Wahi MO et al., 2013; Siamak Kh et al.,2016; Fu BI et al., 2019) and mineral exploration (Pour AM and Hashim MA, 2014; Guha, AR and Vinod KU, 2016;Cengiz OY and Sener ER, 2019). These systems are used (1)to gather valuable data and allows the development of a large geological database, and (2) to process and analyze the information that allows a better valorization of geological data and helps increasing the accuracy and effectiveness of an exploration program.
The Aouli inlier is a metallogenic province known for its numerous deposit sites of base metals (Pb, Zn, Cu, and ± Ag)and various industrial minerals (Barite, fluorite, gypsum and clay) hosted by the Paleozoic and the Meso-Cenozoic age formations (Emberger A, 1965a). The scientific and economic importance of the Aouli inlier has prompted the realization of many detailed geological studies (Emberger A, 1965; Filali FO et al., 1999; Naji MO, 2004; Margoum DA, 2015). The oldest mining works in this province dating from the Romans time, even the Almohads. At the beginning of the 20thcentury, mining prospecting allowed the discovery of exploitable deposits (Aouli, Mibladen, Zaida and Sidi Ayad)(Emberger A, 1965b). Since then no prospecting program has been established.
This paper aims to use the remote sensing and GIS system for the geological mapping and mineral exploration of the Aouli inlier, of 750 km2, focusing on the vein mineralization composed of galena-barite-fluorite. The processing of multi-sensor satellite images (Landsat 8 Oli, Sentinel 2A, and ASTER) will be used to establish geological, fracturing, and mineral alterations maps. The data derived from this processing will be integrated into a geographic information system (GIS) to set as multi-criteria analysis of mineralized zones and to establish mining exploration guides in the study area. Results will be validated by field survey.
2. Geological and metallogenic setting
2.1. Geological setting
The Aouli inlier, occupies the western part of the eastern Meseta (Fig. 1). It is formed by a Paleozoic basement,composed of metamorphic and plutonic outcrops,unconformably superposed by a Triassic volcano-sedimentary series, followed by the Secondary and the Tertiary geological formations (Emberger A, 1965b).
(i) The basement formations
The crystallophyllian unit outcrops in the SE part of the studied inlier between Sidi Ayad, Aouli and Sidi Saïd areas(Fig. 1). It is composed of a sandstone-pelitic sedimentary series of the Cambrian age, strongly folded and metamorphosed (Ganzeev A et al., 1978; Hoepffner CH,1987). This series consists mainly of chlorite, sericite, and biotite schists; interlayered with the quartzites and the amphibolites. The latter appears as sills or dykes with several tens of meters thick (Ganzeev A et al., 1978).
During the Hercynian orogeny, this crystallophyllian unit was intruded by granitoid batholiths which mainly outcrop in the western part of the Aouli inlier and occupy a total areagreater than 700 km2(Amade E, 1965; Diot HE, 1989) (Fig. 1).Petrographic studies, carried out on these granitoids, reveal four distinct types (Table 1).

Table 1. Granitic facies of the high Moulouya (after El-Hadi HA et al., 2003; Dahire MO, 2004).

Fig. 1. Geological map of Aouli inlier (Margoum DA, 2015; Emberger A, 1965a, 1965b).
(ii) The cover
The cover consists of a sub-tabular and conformable Meso-Cenozoic series on the Paleozoic basement. From the base to the top (Margoum DA et al., 2015): (1) The Triassic outcrops formed by a volcano-sedimentary series;conglomerates, sandstones, arkoses, clays, and basaltic flow sequences. (2) The Jurassic (Lias-Dogger) is organized as mesosequence of coastal deposits, and formed by conglomerates, sandstones, marls, limestones, and massive dolomites. (3) The cretaceous is formed by transgressed facies as a thick conglomerate, sandstones, argillites, marls, and limestone. (4) Post Cretaceous (Paleogene, Neogene, and Quaternary) deposits include levels of marls, clays,limestones, and coarse conglomerates (Amade E, 1965;Emberger A, 1965a; Naji MO, 2004).
2.2. Tectonic and metallogenic setting
Tectonically, the eovarisque phase gives rise of some isoclinal and synchistous folds in the Aouli inlier. The late post-Westphalian deformation was manifested by an episodeof folding, which formed the anticlinorium of Adrar-Akorar(Fig. 1), corresponding to the Moulouya valley. With a subhorizontal E-W oriented axis, this anticlinorium is affected by a network of sub-vertical late-Hercynian faults(Rhinane HA, 1990). This network is characterized by the predominance of the NNE, ENE, NE, and NW directions(Emberger A, 1965b).
The Aouli inlier province is characterized by three mineralization types with different morphologies (stratiform,massive, disseminated, and vein) and mineralogies (Fig. 2):

Fig. 2. Geologic cross section NW-SE of Aouli inlier (Margoum DA, 2015. modified from Emberger A, 1965a, 1965b).
(i) The Aouli ore deposits are presented as the vein-type and are hosted in the Paleozoic basement. These veins, with the hectometric to kilometric extension, are 1 to 8 m thick and appear as mineralized columns alternating with sterile columns (Wadjinni A, 1997; Raddi YO et al., 2011),
(ii) The mineralization of the Zeïda deposits, classified as red beds, occurs in disseminated form or in small clusters impregnating the Triassic arkoses (Jébrak MI et al., 1998)and,
(iii) The Mibladen ore deposits appear in the form of stratoid clusters hosted in the Middle Lias dolomitic outcrops(Margoum DA et al., 2015). They are qualified as the Mississippi Valley type (Jébrak MI et al., 1998; Naji MO,2004).
3. Materials and methods
In this study, three satellite image types were used(Landsat 8 Oli, Sentinel 2A, and ASTER). They were captured in good weather conditions and excellent image quality (Table 2).
The methodology used in this work is summarized in Fig. 3.The main processing give the thematic maps of lithology,structural and mineral alterations. This is obtained by performing image transformations (principal component analysis, band ratio, colored composite, and lineament extraction). The processing is applied to three types of image data completed by pre-existing geological and topographical maps enriched and validated by our own field observations.
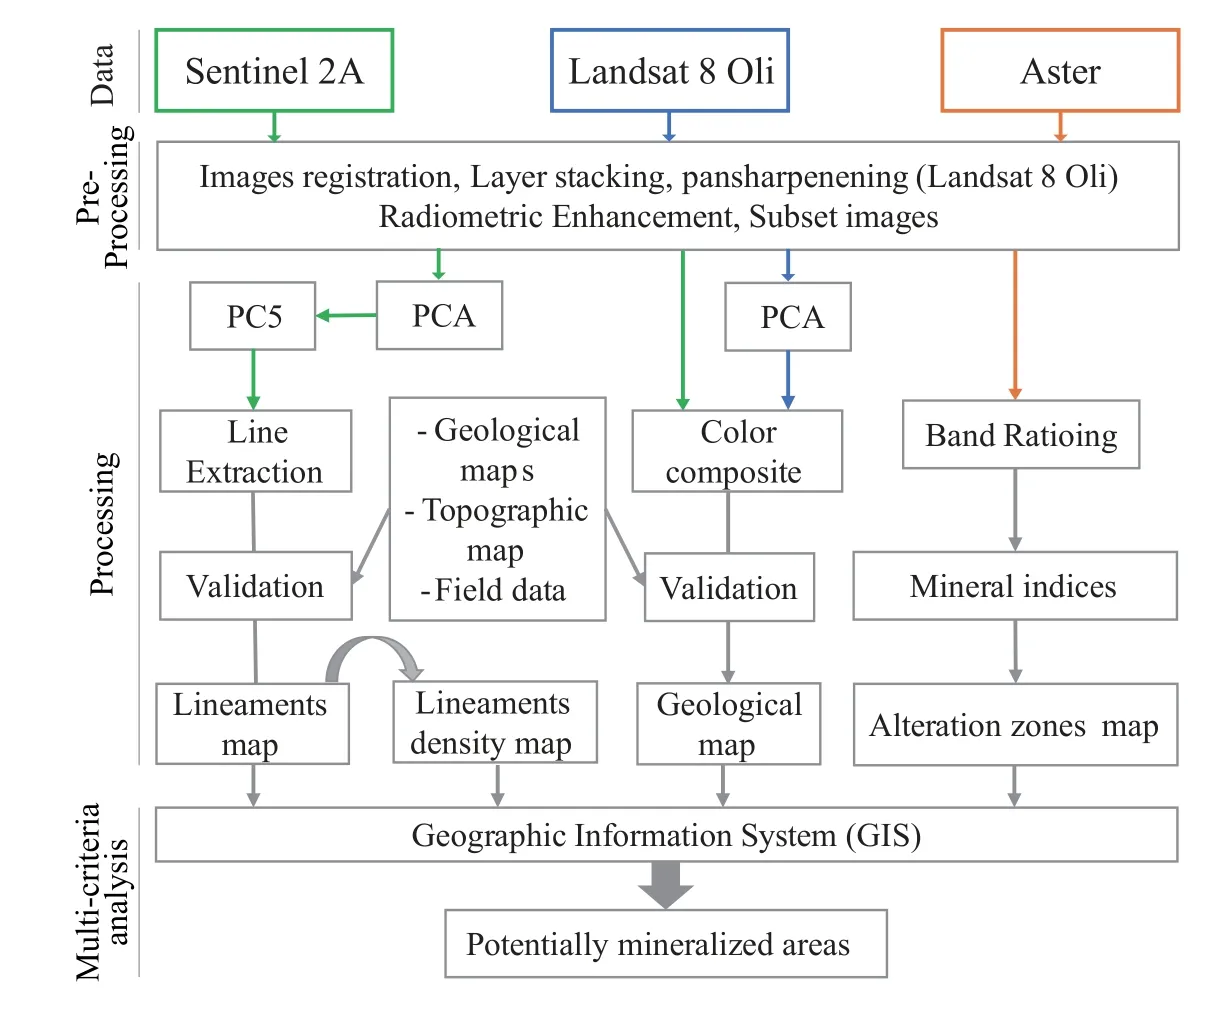
Fig. 3. Flowchart of the methodology for processing satellite images.
Landsat 8 is equipped with the Operational Land Imager(OLI) and thermal infrared (TIR) sensors. The image shows eight spectral bands with a spatial resolution of 30 meters(bands 1 to 7 and 9), one band (panchromatic) at 15 meters spatial resolution (Band 8), and two thermal bands 10 and 11 at 100 meters resolution (Table 3) (Roy D et al., 2014). In this study, a scene image acquired on April 03, 2018, is used; the VNIR and SWIR bands were grouped into a single multispectral image with a resolution of 30 m, and then spatially enhanced by combination with the panchromatic band at 15m spatial resolution.
The Sentinel 2A images (Table 3) contain 13 bands in the VNIR and SWIR spectral domain, with four bands at 10 m spatial resolution, six bands at 20 m, and three atmospheric correction bands at 60 m (Drusch M et al., 2012). The cloudless images were radiometrically enhanced by the Histogram Equalization algorithm, and then all bands were grouped together.
ASTER multispectral sensor covers a wide range of spectral regions with 14 bands, including three VNIR bands with a spatial resolution of 15 m, six SWIR bands with a spatial resolution of 30 m, and five TIR bands with a spatial resolution of 90 m (Abrams M, 2000;Table 3). The Aster data used in this work were acquired on August 17, 2004. Only the VNIR and SWIR bands were grouped together in a single multispectral image.
Mapping of the geological formations of Aouli inlier was done using Landsat 8 Oli images. Thus, a 1/50000 geological map covering the entire inlier was produced, based on Principal Component Analysis (PCA) of Landsat 8 Oli images, and completed by photo-interpretation of the Sentinel 2A images in true color.
The ASTER data band ratio is useful for the qualitative detection of alteration minerals (Di Tommaso IN and Rubinstein NO, 2007). These minerals, such as kaolinite,alunite, and iron oxides can be identified using mineral spectral indices (Cengiz OY and Sener ER, 2019). In this work, we used the spectral indices of Alunite-Kaolinite-Pyrophyllite (b5 + b7)/b6, Gossan (b4/b2), and the hydrothermal colored composite (RGB: b4/b6, b2/b1 and b3/b2) (ERDAS, 2007) to establish the distribution maps of the various alteration anomalies.
Lineaments (geological fracturing) were automatically extracted from PC5 band of Sentinel 2A, using the "Line Extraction" algorithm in PCI Geomatica software. This operation was just performed on the basement of Aouli inlier.This automated extraction can uniformly process different images and extract lineaments that are not recognized by analog processing. The lineament extraction was performed as follows: (1) first we carried out a Principal Component Analysis on Sentinel 2A multispectral image (Five bands were created). (2) After several automatic lineament extraction tests on different PCA images we selected the PC5 band, which gave optimal and more logical results, compared to field and bibliographic data. The thresholds of the parameters used for the lineament extraction is mentioned inTable 4.

Table 2. Used Multispectral images.
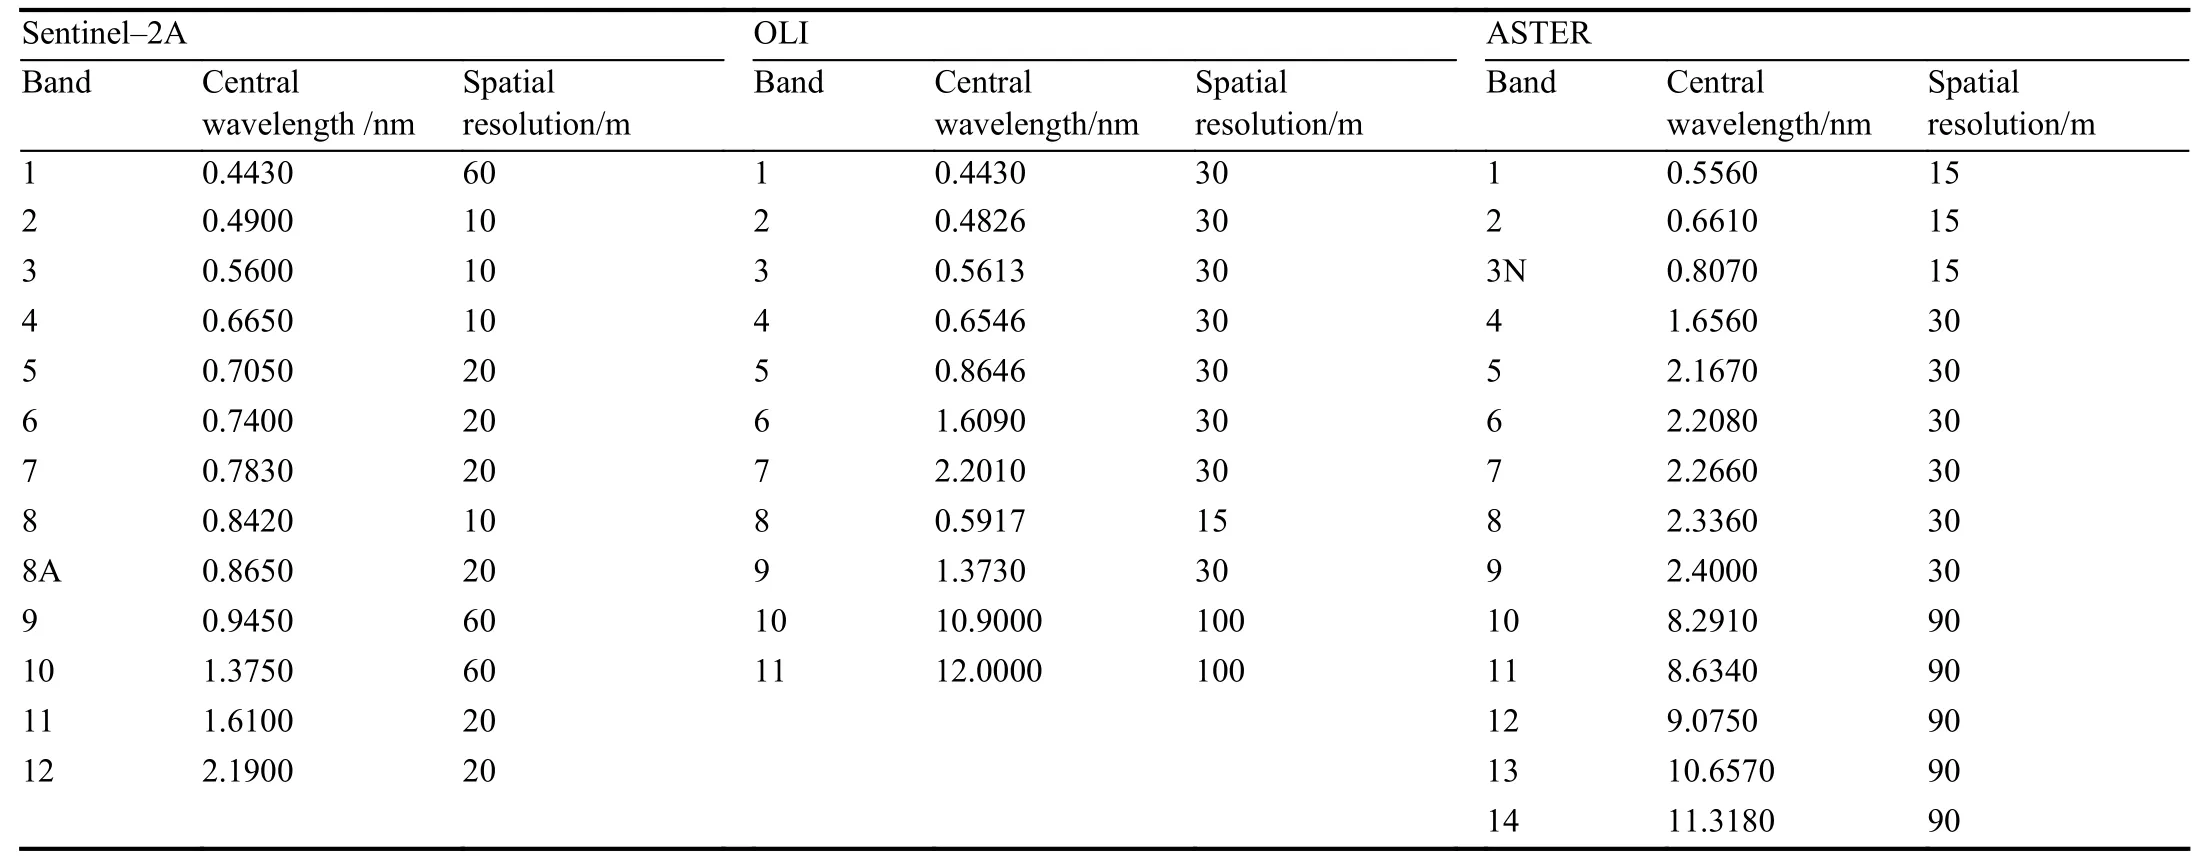
Table 3. Description of the Sentinel-2A, Landsat 8 Oli and Aster sensors.
Then, the resulting lineament map was compared with the topographic one of Midelt at 1/200000 (Emberger A, 1965b),to make adjustments and to rule out lineaments that coincide with roads, streams, cliffs, and those that also coincide with the boundaries of lithological formations. This operation will make it possible to restore a map containing only the geological lineaments and in particular those which correspond to geological fractures or veins.
4. Results and discussion
4.1. Geological mapping
The geological map is an essential tool for any mining prospecting approach. In the study area, there is no updated work or recent regional geological mapping. Therefore, a detailed geological map covering the entire inlier was produced using a GIS software. This new map is based on the interpretation of remote sensing images, field data and the compilation of preexisting geological data.
PCA applied to Landsat 8 Oli images showed a very low correlation between the PCA bands (Table 5). This permits to distinguish clearly the lithological units outcropping in the study area using RGB band combinations.

Table 4. Automatic lineament extraction used parameters.

Table 5. Correlation matrix of the PCA bands.
The RGB combination (PC1, PC2 and PC4) allowed distinguishing different contrasts between the geological formations of the basement as the reddish-brown shales; the dark blue amphibolites, and the pink to purplish granitoid.The cover is constituted by the purplish-blue clays; the darkblue basaltic effusions; the pistachio green to yellowish carbonates and marls from the Cretaceous, and dark pink alluvium (Fig. 4).
The superimposition of the geological formations contours extracted from the geological map of Mibladen at 1∶50000(Raddi YO et al., 2013) on that resulting from the PCA (RGB:PC1, PC2 and PC4), also allowed distinguishing lithological boundaries based on the color contrasts variation (Fig. 4).
Based on (1) the photo-interpretation of the PCA color composite image and the Sentinel 2A images in true RGB color (b4, b3, b2), and (2) the preexisting geological maps(Emberger A, 1965a; Raddi YO et al., 2013; Elabouyi MU et al., 2019) and fieldwork, an updated geological map (Fig. 5)covering the Aouli inlier was so obtained. On this new map,some important cartographic information has been updated and added in the existing geological map of Mibladen (Raddi YO et al., 2013): (1) the boundary between the chlorite-sericite schists and the biotite schists, delimited between (point: X/4.73287°W, Y/32.75543°N, and point:X/4.79315°W, Y/32.72608°N) has been clarified, (2) the boundary between the cretaceous formation and the middle Lias formation delimited between (point: X/4.65201°W,Y/32.74767°N, and point: X/4.69773°W, Y/32.74473°N) has been updated also (Fig. 7), (3) the updating of the amphibolites outcropping, located at the center point:X/4.73894°W, Y/32.88326°N, mentioned in the pre-existing maps of Emberger, 1965 and Raddi et al., 2013 as hornfels and, (4) the limits of the geological formations in the western part of the Aouli inlier have been specified compared to the previous edition of the geological maps of Emberger A, 1965and Elabouyi MU et al., 2019.
4.2. Lineaments analysis
The different processing operations of lineaments extraction allowed us to establish a synthetic map of the geological fracturing with 2128 lineaments. The analysis of the results indicates that the lineaments appear mainly in the Sidi Saïd, Adrar-Akorar, Hassi, Aouli, and Dhar El Khach localities and are organized as corridor oriented SE-NW and NNE-SSW in the Assaka-Ijdi and Ansegmir areas (Fig. 6).
4.2.1. Lineaments orientation
Lineaments statistical analysis has been explored by several authors to study the geometry of the network. It’s also in order to identify its dominant directions on a regional scale(Deslandes S and Gwyn QHJ, 1991). The statistical analysis of the lineament direction frequencies gave a rose diagram within an equivalent class having an amplitude of 10°.
The rose diagram shows several trending lineaments varying from N-S to ESE-WNW, of which the NE-SW oriented lineament (N30-N60) is dominant. This direction represents 42% of the Aouli inlier lineaments (Fig. 7).
4.2.2. Lineament density
Lineament density indicates the concentration of lineaments per area unit. In the present work, this parameter is used to identify areas with strong fracturing. Following the use of the ‘Line density’ algorithm in ArcGIS, a map was obtained showing high fracturing intensities in the areas of Ansegmir, Assaka-Ijdi, Sidi Saïd, and around Adrar Akorar and from West Aouli (Fig. 8).
For the analysis and structural interpretation of the study area, a comparison of our lineaments resulting from remote sensing with the preexisting structural work carried out in the basement of Aouli inlier (geological and structural maps) was made. The superposition of the lineament map with the structural data provided by Emberger A, 1965 and Margoum DA et al., 2015 (Fig. 9), allowed us to identify a set of lineaments that are superimposed with the mapped faults in the preexisting geological maps, trending NE-SW, EW, and NW-SE, or correspond to their lateral extension. In some localities, these lineaments mapped by remote sensing are slightly offsetting from the structural elements in geological maps. This could be related to the larges fault network (shear zones).
One can also note that the lineaments are denser and shorter at the SE part of the basement located between Sidi Saïd, Hassi and Aouli. This is due to the presence of the ductile lithological formations forming a materialized dome structure by the trajectories vergence of regional cleavage(Fig. 10). This elongated structure oriented E-W was generated by a late deformation phase linked to the Hercynian orogeny (Hoepffner CH, 1994; Filali FO et al., 1999).
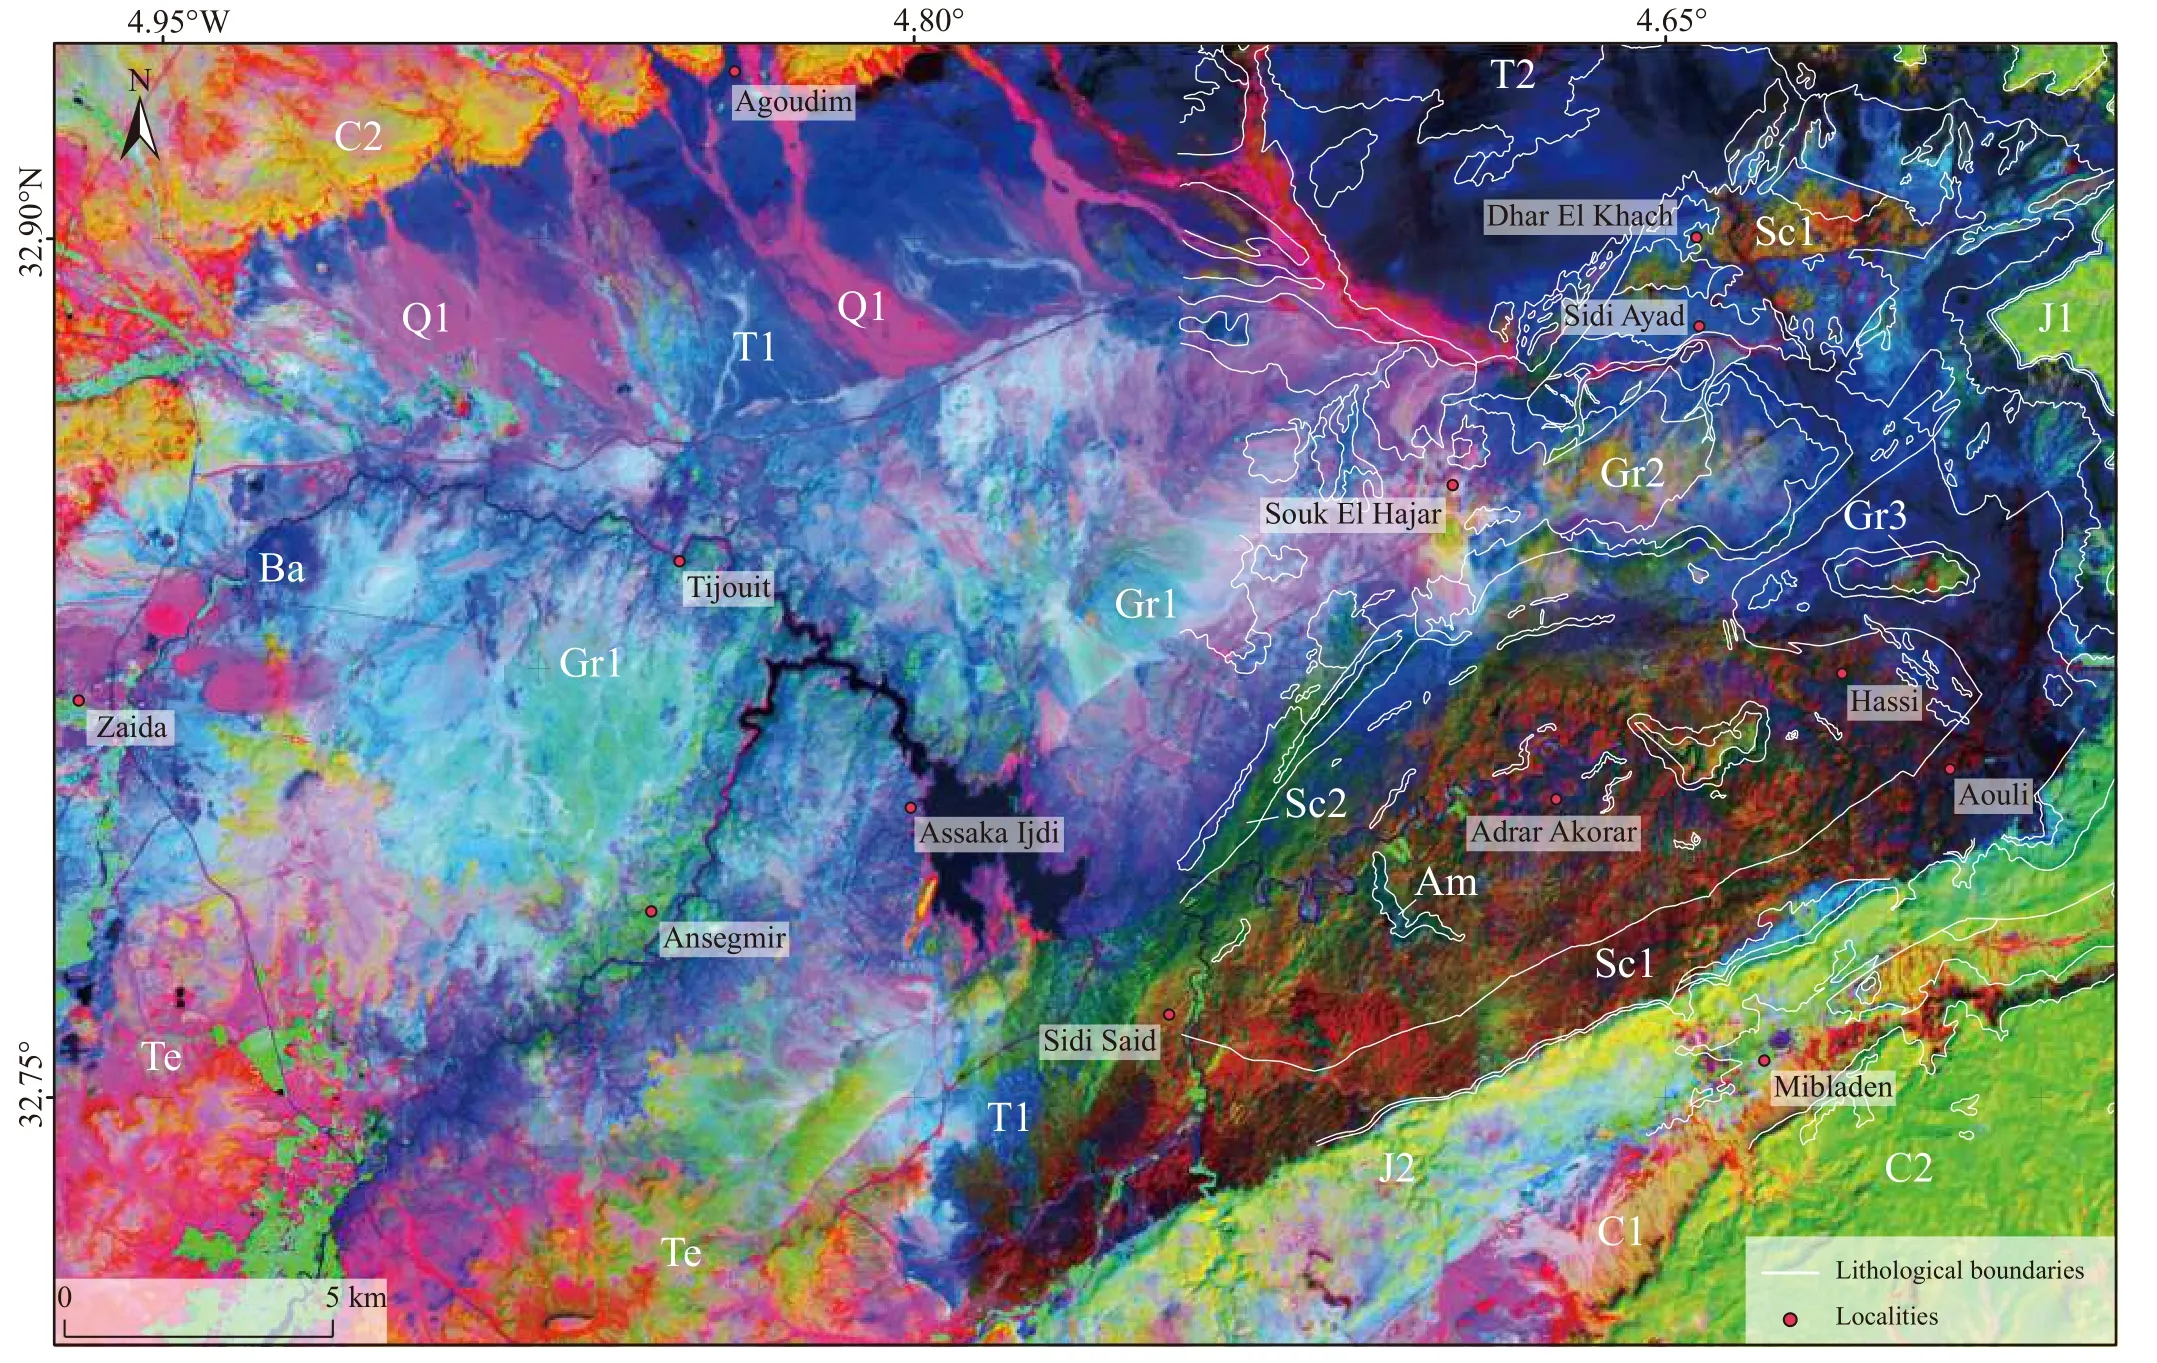
Fig. 4. PCA-derived image (RGB: PC1, PC2 and PC4) with overlaid geological vector layers (Lithological boundary in white). Sc1-Schists;Sc2-Hornfels; Gr1-Aouli granite; Gr2-El Hassir granitoid; Gr3-Biotite and muscovite granite; T1-Triassic Claystone; T2-Basalt; J-J2-Jurassic. C1-C2-Cretaceous.
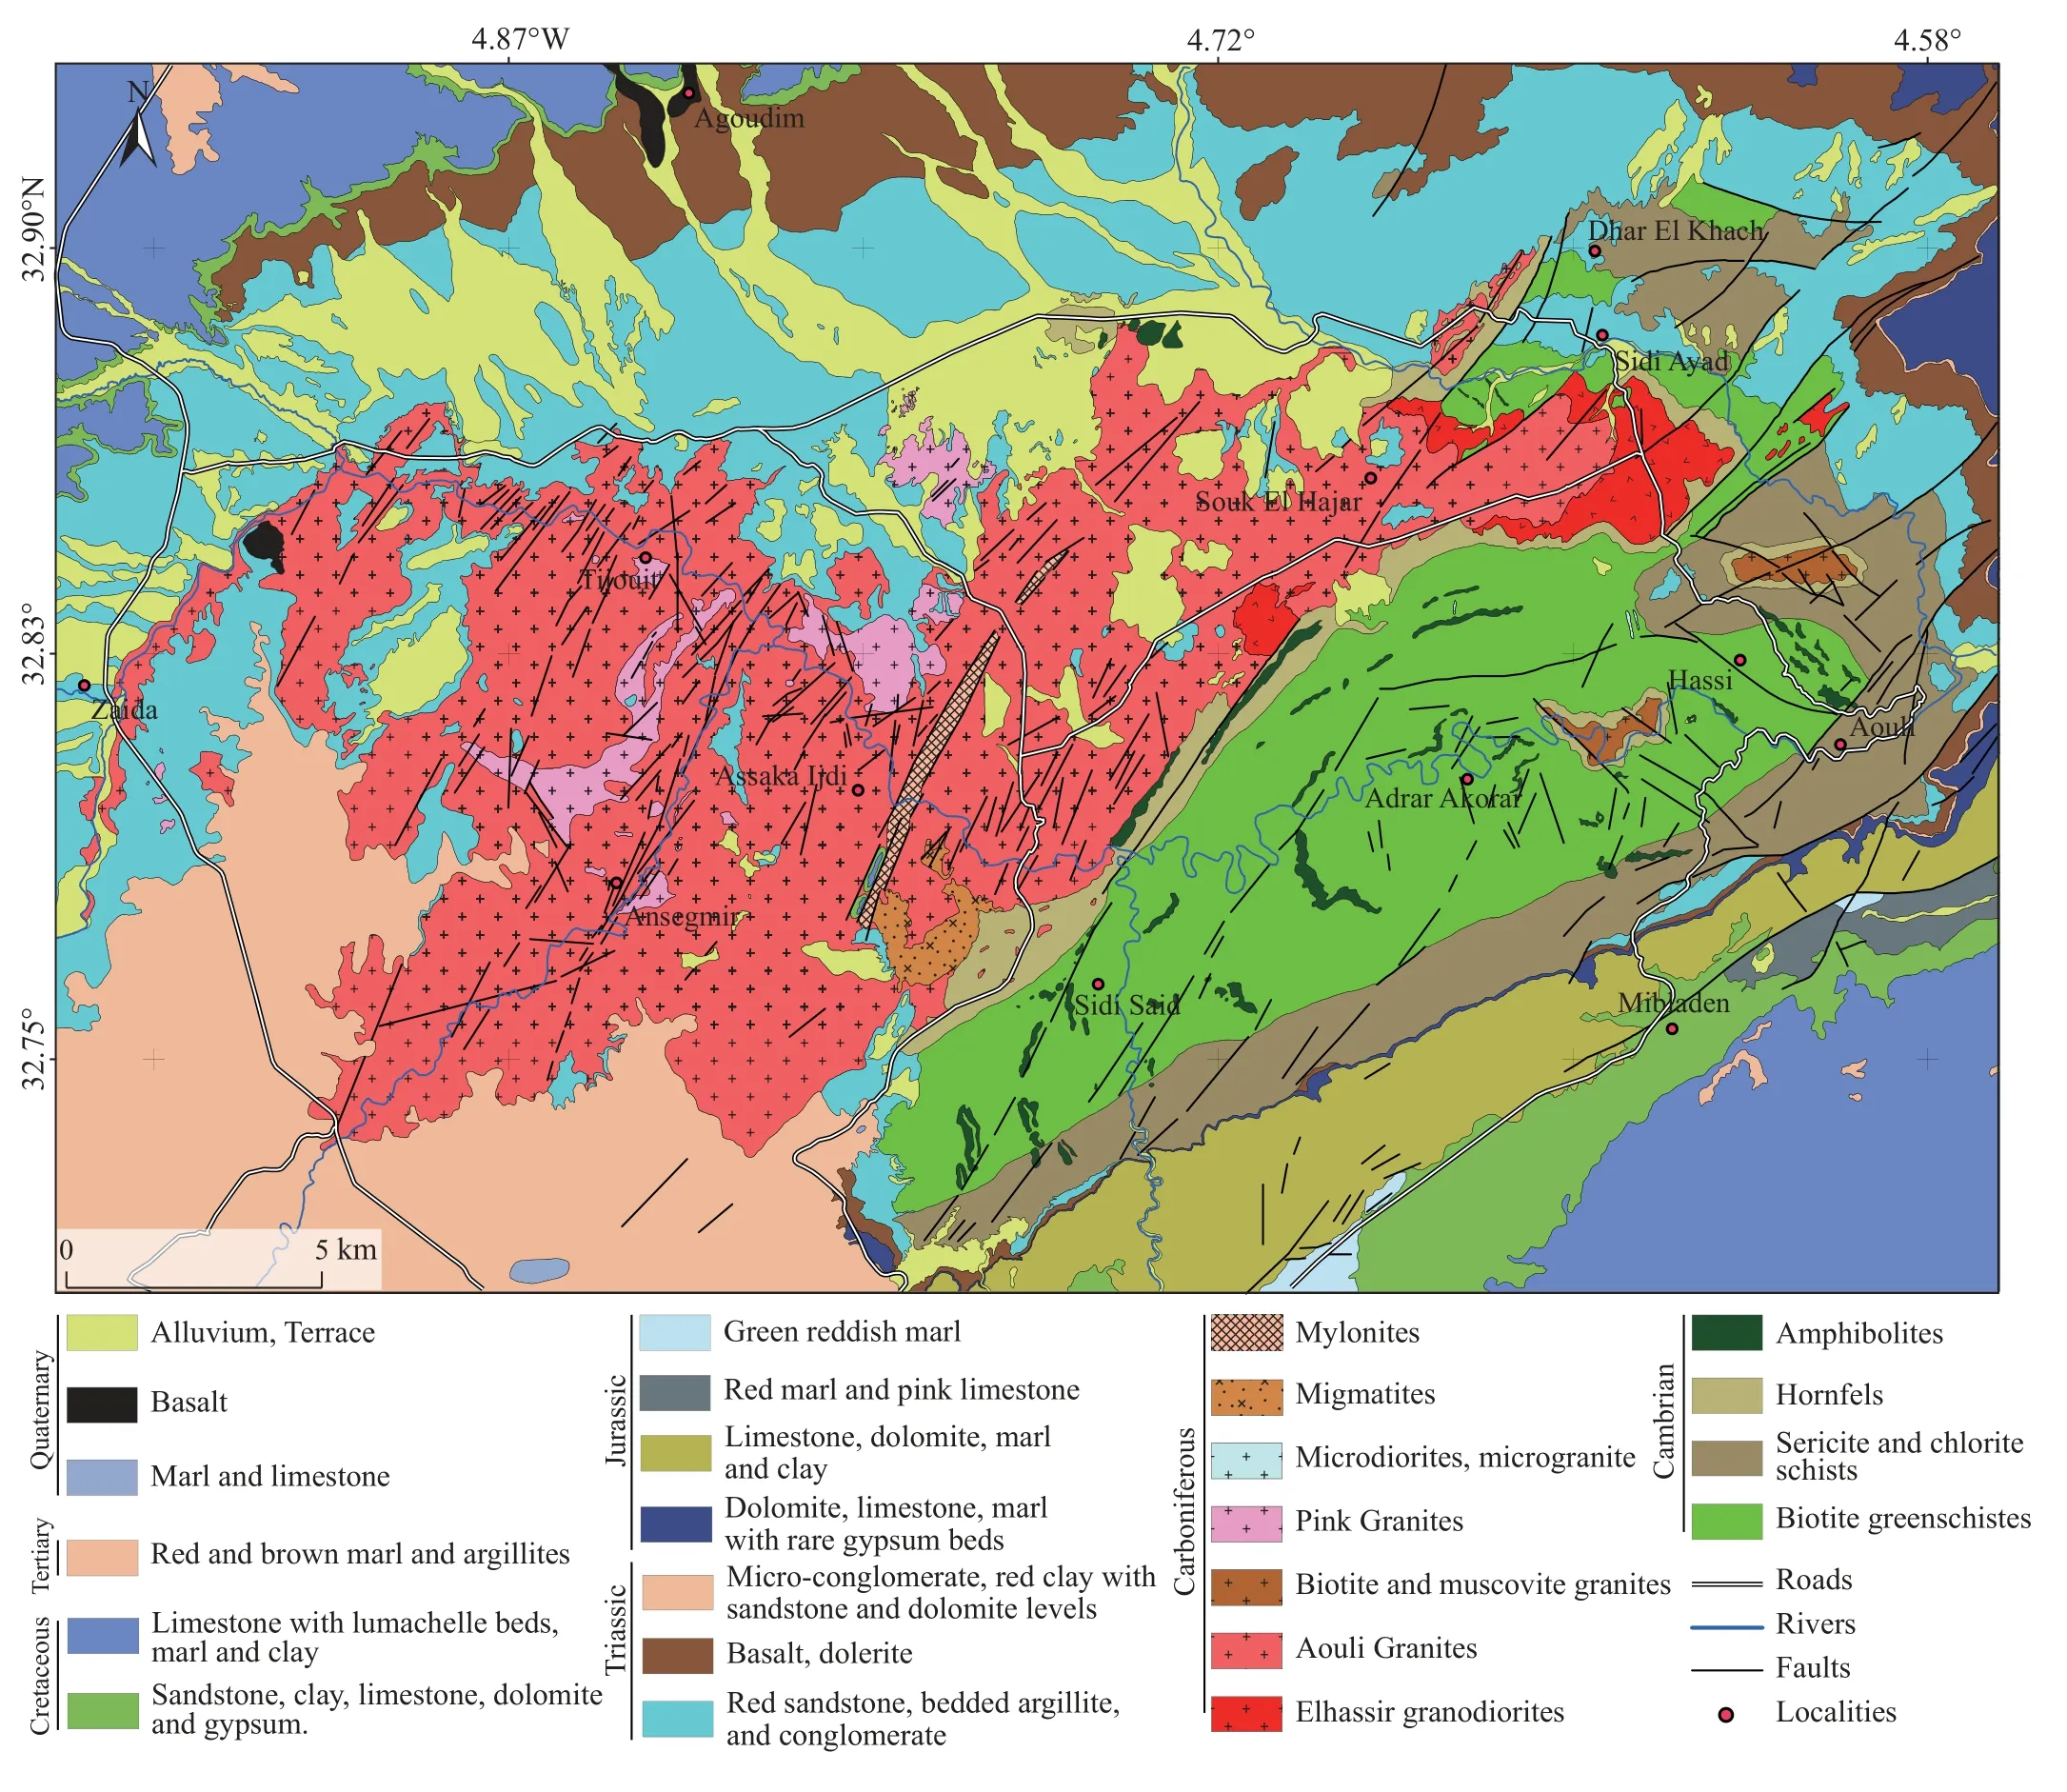
Fig. 5. Updated Geological map of Aouli inlier resulting from remote sensing interpretation, field survey and archive data (after Margoum DA,2015).
All of the lineament data (density, orientation, and line length) appear to be highly variable over the entire Aouli inlier, but they are coherent with previous geological work and our field observations. Fieldwork observations compared with the large-scale analysis of the map carried out by remote sensing reveals that the regional cleavage forms an anticlinorium with an E-W oriented axis, which cleavage planes show slight dips (10° to 40°) and diverging on either side of the axial plane. This ductile deformation has been attributed by Hoepffner CH, 1994 to the early phase of the Hercynian orogeny.
The Late-Hercynian brittle tectonic phase is manifested by sheared and/or mylonitized corridors trending NE-SW to NW-SE, covering kilometric bands affecting schists and granitoid. The observed fault structures show directions varying from N-S, NE-SW, and ESE-WNW (Fig. 11). The mineralized veins, well developed in the Aouli inlier, show an orientation ranging from N-S to ESE-WNW with a hectometric extension.

Fig. 7. Lineament orientations in the basement; a-Rosacea of lineament orientations with an interval of 10°; b-frequency of lineament orientations (interval of 10°).
These faults have played as dextral and sinistral during the Hercynian and Late Hercynian deformation which have contributed to the opening of the extensional structures that represent the major ore bodies of the region.
4.3. Mapping alteration minerals
4.3.1. Geology and mineralogy of basement mineralization
The fluorite-barite and the sulfide vein mineralization of the basement are hosted in the granitoid and the sandstone-schist series with amphibolite intercalations. The mineralized structures appear as filling vein swarms,multimeric extension oriented ENE-WSW, WNW-ESE, and E-W, veins, and tension gashes. These veins show the same mineral constitutions although their relative proportions vary from one vein to another and from one vein system to another(Margoum DA et al., 2015).
According to the field observations, one can distinguish a mineralogical assemblage consisting mainly of fluorite, barite,and quartz, to which are locally added significant quantities of sulfides, mainly consisting of galena, pyrite, and chalcopyrite.In addition, the supergene alteration of sulfides led to the development of cerussite, malachite, azurite, and iron oxides(Fig. 12). One can notice that the alteration zones at the mineralized veins wall are marked by the presence of clay and iron minerals (limonite, goethite, etc.). These weathering minerals were considered as the mineralized zone indicators on the satellite images.
4.3.2. Mapping of hydrothermal alteration minerals
(i) Gossan
The Gossan band ratio (b4/b2) (Volesky JO et al., 2003)allows the detection of gossans, these correspond to the superficial part of the ore deposit, highly oxygenated and hydrated due to the combined actions of the atmosphere and biosphere (Jébrak MI, 2008). The distribution map of the Gossan in the studied area shows that its signature is aligned in the shear zones and appears as concentrated or scattered points (Fig. 13). The high Gossan density coincides with the shear zones oriented from NE-SW to E-W (referred to in the previous works by the designation as Souk El Hajar and George Faults in Fig. 1). The signature of the Gossan coincides also with the outcrops of amphibolites and alkaline granites located at the west of Ansgmir localities. This could be related to the presence of ferromagnesian minerals in the mineralogical composition of these rocks.

Fig. 9. Map of lineaments superposed to faults from data archive.
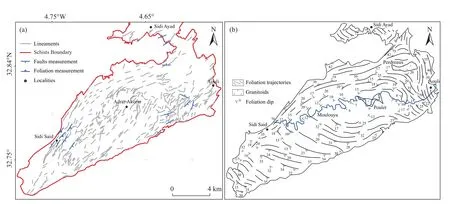
Fig. 10. a-Lineament in the schist extracted from ACP5; b-schistosity trajectories (after Filali FO et al., 1999).
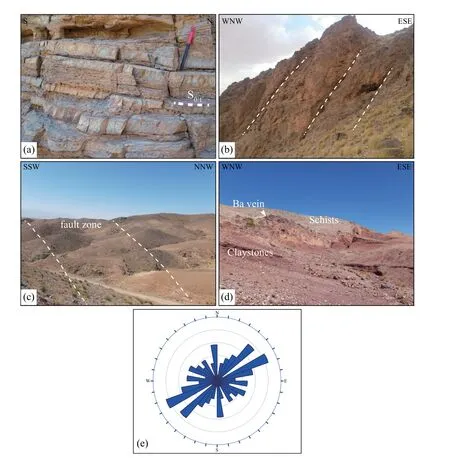
Fig. 11. a-Schists; b-N30 fault; c-N45 fault zone; d-barite vein in the boundary between Palaeozoic schist and Triassic clay stones; e-rosacea of fractures measured in the field.
(ii) Alunite-Kaolinite-Pyrophyllite
The ASTER band ratio (b5+b7)/b6 was used in this work to map areas rich in Alunite-Kaolinite-Pyrophyllite minerals(Van der Meer FR et al., 2012). The signature of these clay minerals is well developed in the Sidi Saïd, north of Adrar Akorar, west of Aouli, and east of Dhar El Khach areas (Fig.14). Indeed, the development of these signatures is mainly associated with the shear zones oriented from NE-SW, E-W to NW-SE.
(iii) Hydrothermal component
The mapping of the hydrothermal alteration zones by the RGB colored composite based on the b4/b6, b2/b1, and b3/b2 band ratios (ERDAS, 2007) allows the detection of altered areas shown by red color in the basement (Fig. 15), and coincide with the mapped shear zones which correspond to the same zones of clay minerals of the Alunite-Kaolinite-Pyrophyllite. However, this signature is undeveloped in the granite, except for some trace east of Souk El Hajar (Fig. 15).
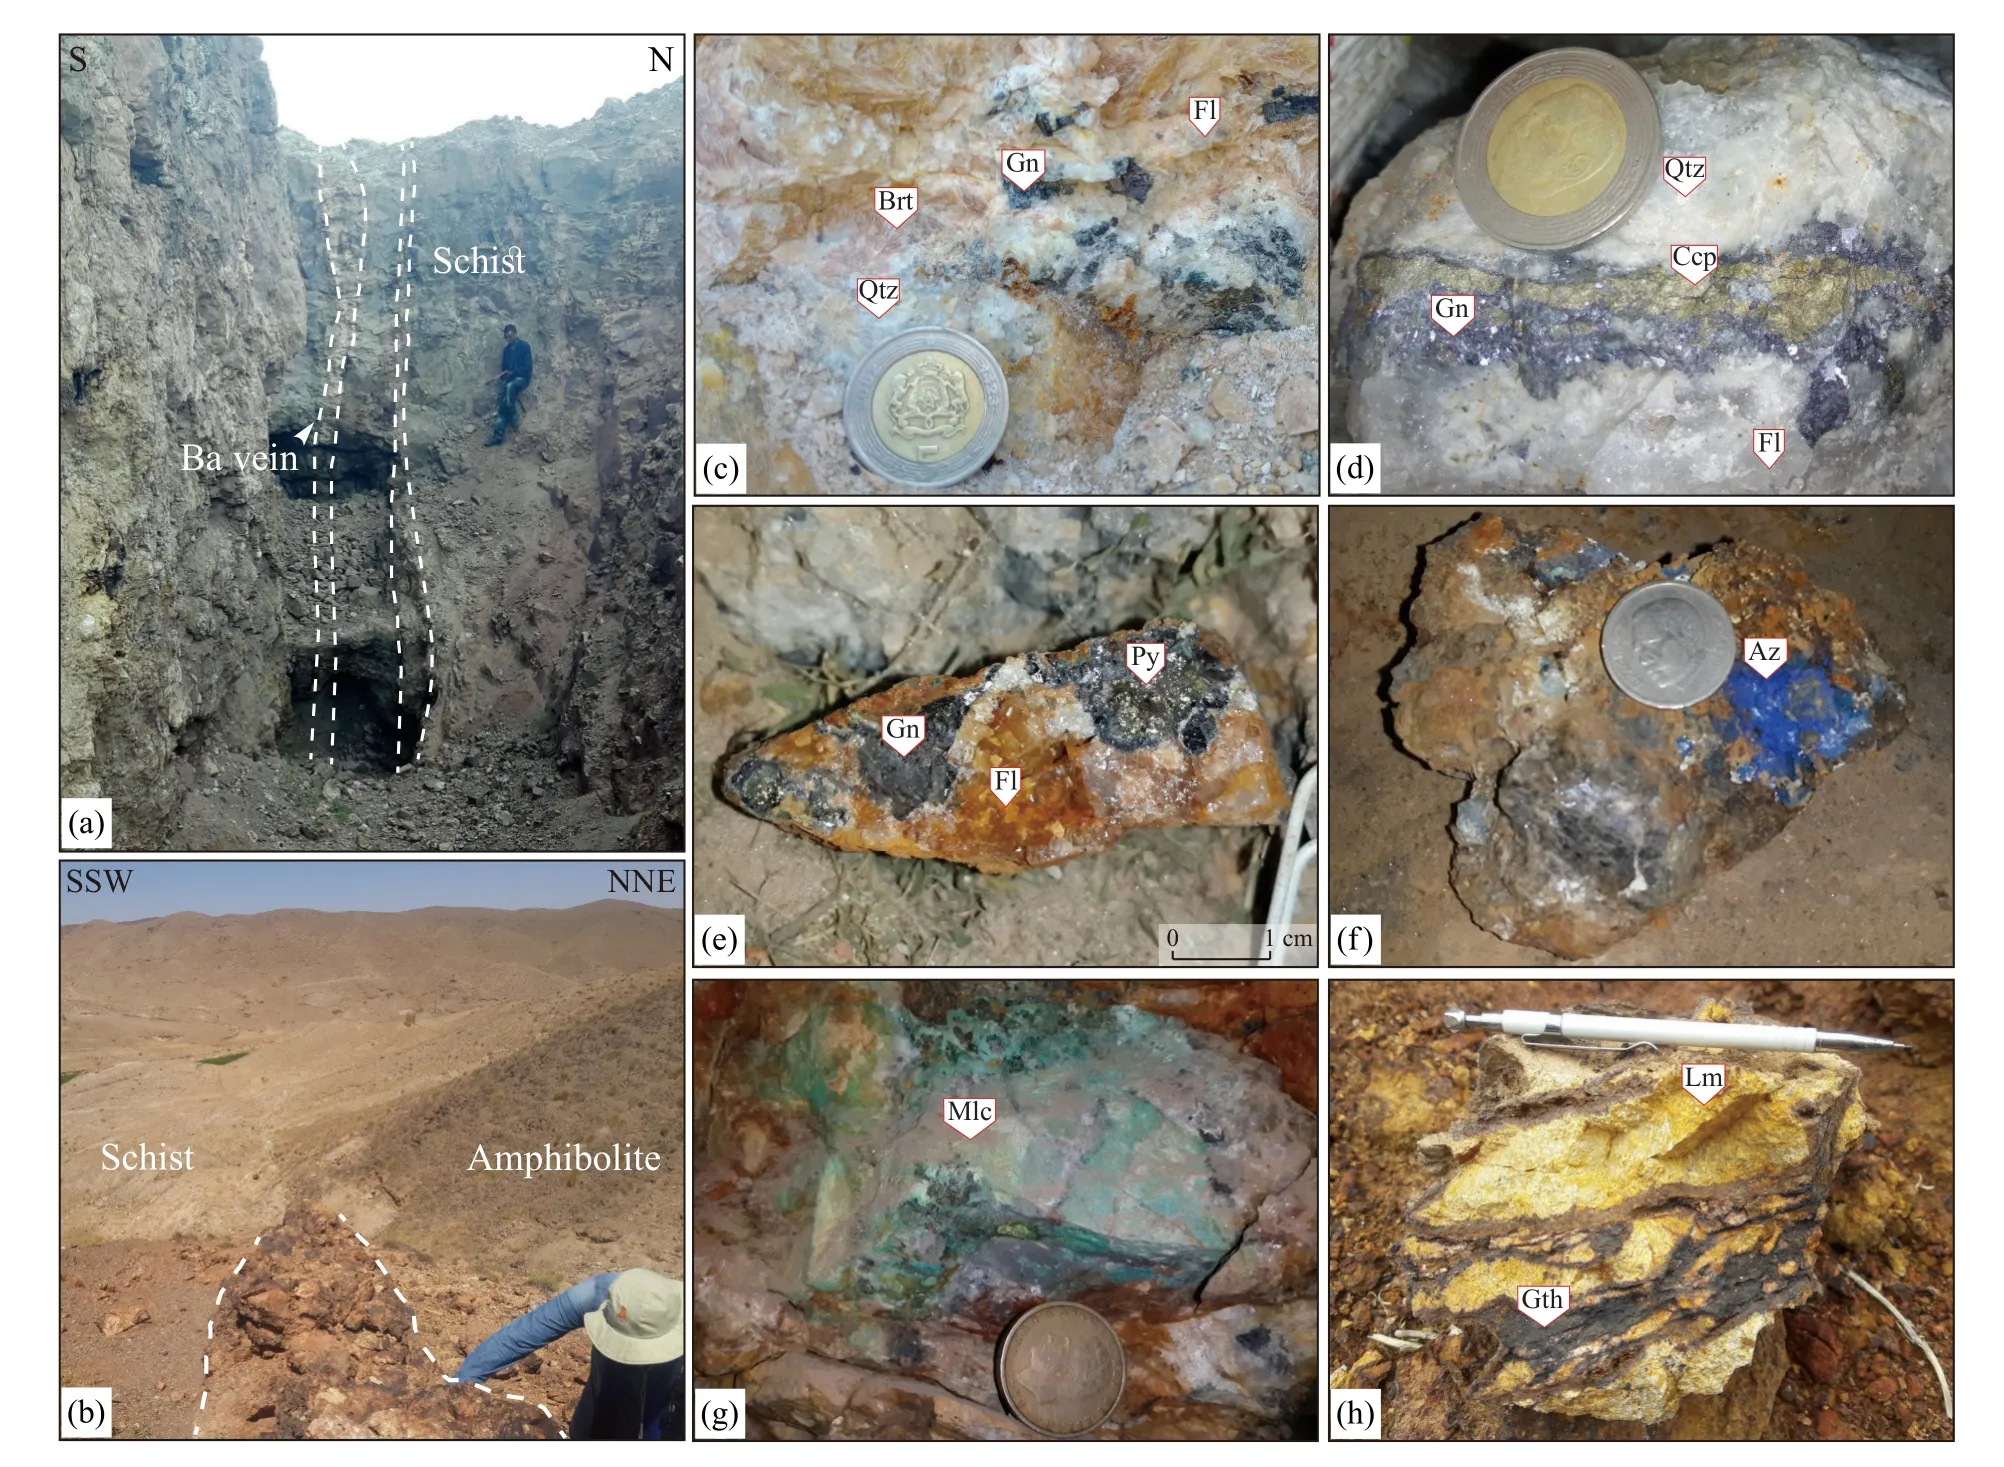
Fig. 12. a-Subvertical Barite vein hosted in schist; b-Ba vein showing surface oxidation; c, g-mineralogy of the mineralization. Brt-barite;Gn-galena; Qtz-quartz; Fl-fluorite; Py-pyrite; Ccp-chalcopyrite; Mlc-malachite; Az-azurite; (h)-sample from the oxidation zone with goethite (Ght) and limonite (Lm).
4.4. Multicriteria analysis
This type of processing is proposed to optimize the interpretation of the data by crossing them simultaneously using a GIS software. These processing techniques aim to create synergies capable of revealing new information(Scanvic JE, 1993). In this work, the data derived from the processing of satellite images (lineaments and alteration zones) and field mapping surveys (mineralized veins) were compared and analyzed to set up prospecting guides to target potential areas to be explored.
The resulting map from the superposition of these data(Fig. 16) shows a coincidence of the high lineament density area (strong fracturing), the Alunite-Kaolinite-Pyrophyllite,and Gossan with the known mineralized veins locations in the Aouli inlier.
The plotting of these veins on the map of the hydrothermal colored composite shows a very good correlation between hydrothermal alteration zones and veins(Fig. 17). Thus, one can notice that these veins follow the direction of the main shear zones and sometimes oblique to these directions.

Fig. 14. Aster (b5+b7)/b6 ratio highlighting Alunite, Kaolinite, Pyrophyllite rich zones.
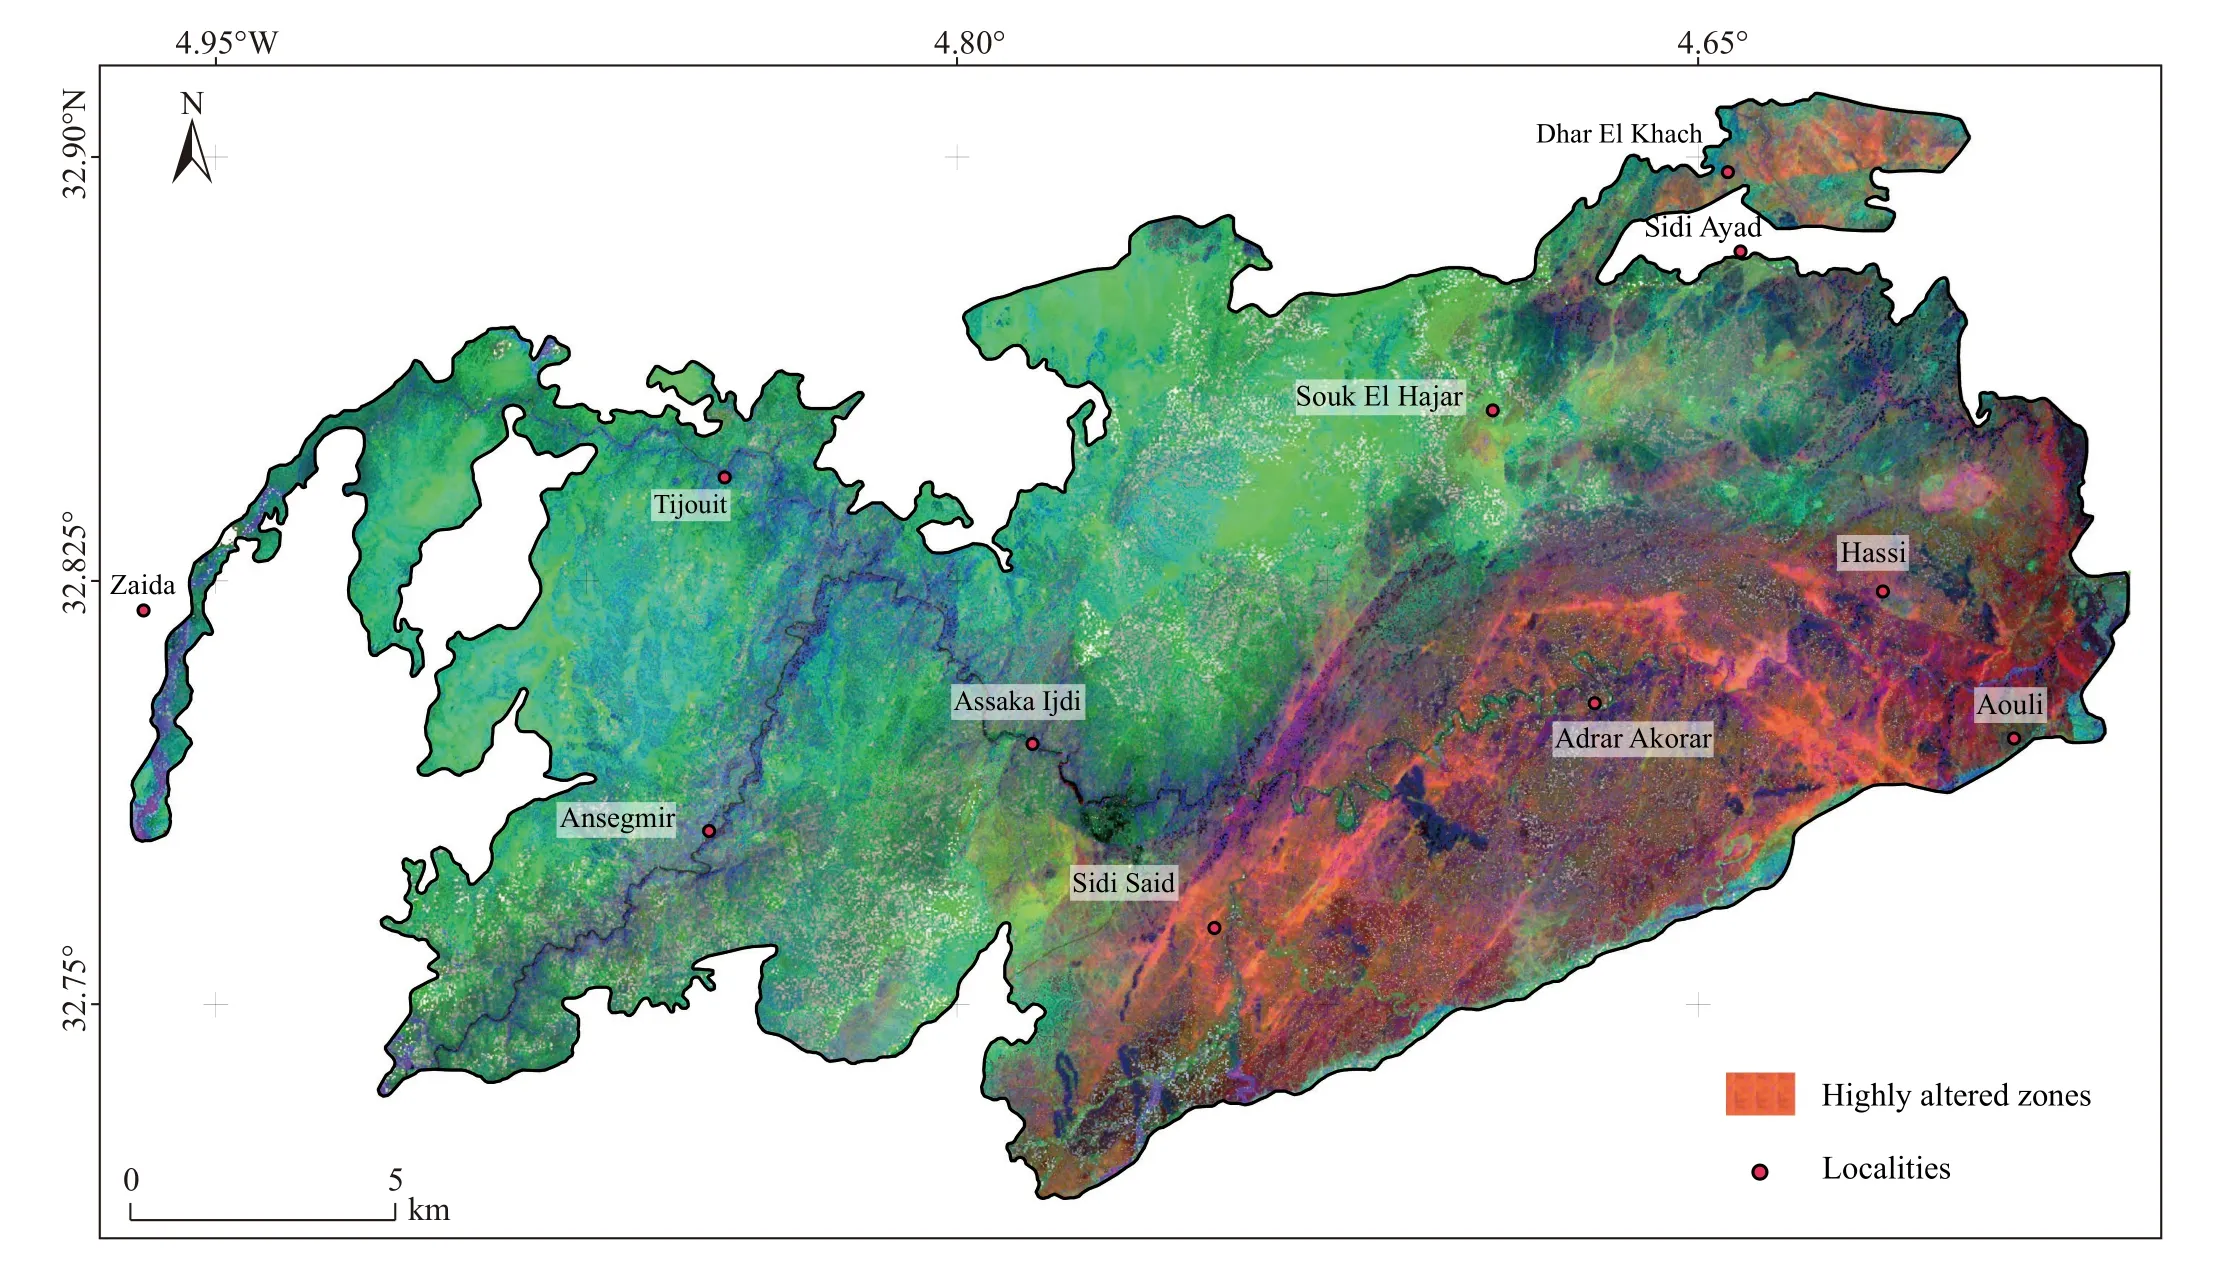
Fig. 15. ASTER hydrothermal component image (RGB: b5/b7, b3/b1 and b4/b3).

Fig. 16. Superposition of the lineament and mineral alteration maps.

Fig. 17. Superposition of ASTER hydrothermal image (RGB: b5/b7, b3/b1 and b4/b3) with ore veins.
The results show that the mineralized zones correspond to strongly fractured areas, altered and containing clay minerals and iron oxides. This shows the importance of the shear zones, which played a role in major drains of mineralizing fluids in the basement.
According to the obtained results, the shear zones and associated fractures (structural discontinuities) that show the development of hydrothermal alteration minerals are the most favorable areas for possible exploration of the vein mineralization fluoro-barite ± sulfides in Aouli inlier. Indeed,the oriented NNE-SSW shear zone of Ansegmir, the NW-SE corridor of Assaka Ijdi-Tijouit and the east of Dhar El khach(areas that not known by a former mining activity) could be more potential for a possible prospecting mining. Thus, the ESE extension of the veins exploited at Sidi Said, the Eastern extension of the George’s vein, the NE continuity of the Aouli veins and the SE extension of the Adrar Akorar veins are good potential site for mining exploration.
5. Conclusion
Remote sensing and GIS tools by their mapping methods,extraction of lineaments, and alteration minerals, associated with field observations, contributed fully to the mapping of geological formations, alteration zones, and structural discontinuities. The multicriteria analysis of these data checked by field observations allowed orienting mining exploration by setting up regional prospecting guides.
Landsat 8 Oli, ASTER, and Sentinel 2A data made it possible geological mapping and prospecting of barite-fluorite ± sulfides veins mineralization in the Aouli inlier of 720 km2. This was achieved by crossing data from satellite image processing and geological field data. The discrimination of the geological formations of the Aouli inlier,with a great lithological variation, was possible by using the principal component analysis (PCA) of the Landsat 8 Oli images and the photo-interpretation of the Sentinel 2A images. The plotting of this data on the existing geological maps in a GIS database and its validation by the field observations make it possible to compile and update a new geological map. Indeed, the map produced has been improved by correcting the geological contours of the formations and the mapping of new outcrops.
The automatic extraction of lineaments from Sentinel images allowed the mapping of the main structural discontinuities in the basement; this shows a very good correlation with the field surveys. This technique made it possible to draw the anticlinorium structure of the schist formations; and to identify the main oriented faults oriented NE-SW, N-S, and ESE-WNW. In addition, the high density of lineaments in the Ansegmir, Assaka Ijdi, Sidi Saïd, and around Adrar Akorar and west of Aouli localities, is linked to the strong fracturing in the oriented NE-SW, and NW-SE shear zones.
The Gossan, Alunite-Kaolinite-Pyrophyllite, and hydrothermal minerals, extracted from Aster images, are intimately linked to the main fault zones (Aouli, Sidi Ayad,Sidi Saïd, Souk El Hajar, and Ansegmir). The fault zones facilitate the circulation of hydrothermal fluids responsible for the alteration and the deposit of mineralization in the Aouli inlier. Indeed, the plotting of these alteration zones and the mineralized veins mapped on the lineament density map shows that these veins coincide perfectly with the most fractured and altered zones. Therefore, the most favorable areas for possible mining exploration of the fluoro-barite ±sulfides mineralized veins in the Aouli inlier are the shear zones and the associated fractures (structural discontinuities)which contain hydrothermal alteration minerals. The most important targets presented in this work are the oriented NNE-SSW corridor of Ansegmir, the NW-SE corridor of Assaka-Ijdi, Tijouit, and the east of Dhar El khach. These later zones are new potential zones and are not known by former mining activity. We also denote the ESE extension of the veins exploited at the Sidi Said, the East extension of the George’s vein, the NE continuity of the Aouli veins, and the SE extension of the veins of Adrar Akorar, are considered in this work as targets and potential zones for an eventual tactical mining exploration.
The approach used in this work was successfully applied to the Aouli inlier to rapidly target potential. This provides a model for future prospecting efforts for similar mineral deposits both in the Moulouya province and in other similar areas. Future work will also consider using both high resolution hyperspectral data and geographic information system including geological, geophysical and geochemical data. This will be used particularly to develop a methodology that integrates machine learning algorithms to effectively conduct multi-criteria analysis.
CRediT authorship contribution statement-
Benaissi Lakhlifa, Tarik Amraoui, Adnane Tobi and Khadra Zaid carried out data processing. Khalid Elamari and Mohamed Hibti participated in design and helped to draft the manuscript. All authors participated in the analysis and interpretation of the results and contributed to the final manuscript.
Declaration of competing interest
The authors declare no conflicts of interest.
Acknowledgment
There was no external funding and for this study.
杂志排行
China Geology的其它文章
- On the origin of outer integument
- Innovative understanding in the geological research of China seas and adjacent regions -based on the 1∶1000000 marine regional geological survey
- New timing of the Indosinian intracontinental deformation from the Triassic growth strata in the Kuqa Depression, Southern Tianshan, China
- Discovery of Miocene pegmatite type Be-Nb-Ta(-Rb) mineralization in the Yangbajain of Central Lhasa subterrane, Tibet
- Comment on “Geological mapping and mining prospecting in the Aouli inlier (Eastern Meseta, Morocco) based on remote sensing and geographic information systems (GIS)”by Benaissi et al. (China Geology, 5 (2022))
- 2022 Annual Report of China Mineral Resources (lithium, nickel, cobalt, REE etc.)
