DNA barcoding of broad-headed bugs (Hemiptera:Alydidae) from China
2022-11-28YIWenBoWANGShiJunWANGShuJingZHANGHaiGuangBUWenJun
YI Wen-Bo,WANG Shi-Jun,WANG Shu-Jing,ZHANG Hai-Guang,BU Wen-Jun,*
(1.Department of Biology,Xinzhou Teachers University,Xinzhou,Shanxi 034000,China;2.School of Plant Protection,Shanxi Agricultural University,Jinzhong,Shanxi 030800,China;3.Institute of Entomology,College of Life Sciences,Nankai University,Tianjin 300071,China;4.College of Life Sciences,Linyi University,Linyi,Shandong 276000,China)
Abstract:【Aim】 The aim of the study is to test the validity of DNA barcoding for the identification of broad-headed bugs (Hemiptera:Coreidae) from China.【Methods】 The DNA barcode sequences of mitochondrial COI gene of 207 samples from 23 species of 13 genera of Alydidae from China were amplified,and 31 internal transcribed spacer 1 (ITS-1) sequences of three Leptocorisa species were amplified as auxiliary markers.The interspecific and intraspecific genetic distances (Kimura 2-parameter model,K2P) were calculated by MEGA 11 software.The species cluster analysis was performed using neighbor-joining (NJ) method.The holotype networks were constructed using median joining network algorithm.【Results】 Based on the DNA barcode sequences of mitochondrial COI,the mean intraspecific K2P distances of all the tested 23 species of Alydidae from China were below 2%,and the interspecific K2P distances ranged from 0.98% to 23.98%,with an average of 17.50%.Most species were separated from each other with a high bootstrap value.This COI barcode section could not distinguish between Leptocorisa chinensis and L. oratoria because of the partial COI haplotypes they shared.The ITS-1 sequences did distinguish the two species in the haplotype network analysis.【Conclusion】 The DNA barcoding results from our data are congruent with most of the taxonomic units of the family Alydidae from China based on morphological characteristics.However,for extremely closely related species,mitochondrial data alone,especially COI barcode sequences,sometimes are insufficient for accurate species delimitation,and other DNA sequences or other types of data need to be introduced.
Key words:Hemiptera;Heteroptera;Alydidae;DNA barcoding;COI;species delimitation
1 INTRODUCTION
Alydidae,commonly known as broad-headed bugs,is the 2nd most diverse family in Coreoidea,next to Coreidae.Approximately 54 genera and 291 species have been described worldwide (Schuh and Slater,1995;Henry,2009;Yi and Bu,2015;Brailovsky,2019).Alydidae contains some serious pests,such as the genusRiportusin the Palaearctic Region,known as bean bugs,and the genusLeptocorisain the Oriental Region,known as rice seed bugs.Three species in the genusLeptocorisa,L.acuta,L.chinensisandL.oratoria,have long been misidentified each other due to their close relationships and similar morphological characteristics (Ahmad,1965;Dolling,2006;Yi and Bu,2017).Furthermore,there are some very little known but peculiar bugs in Alydidae,with very rare habit and stenochory,such as the generaDacleraandAcestra(Li and Zheng,1993).Prior to this study,only a few studies have used one or two species as samples for DNA barcoding (Jungetal.,2011a;Parketal.,2011;Raupachetal.,2014),and thus far,no single study has specifically investigated DNA barcoding in the family Alydidae.Partial mitochondrialCOIsequences as well as other mitochondrial genes have been used as DNA barcodes for distinguishing animal species (Hebertetal.,2004a;Lakraetal.,2011).A 648 bp fragment ofCOIhas been confirmed to provide sufficient resolution to identify species (Hebertetal.,2004b).Therefore,we chose the standardCOIfragment as a molecular marker to perform our experiments.
Implementing the above conditions,we selected the family Alydidae as an example to test the validity of DNA barcoding,especially for species from China.
2 MATERIALS AND METHODS
2.1 DNA extraction,amplification and sequencing
A total of 207 samples representing 23 species belonging to 13 genera of Alydidae were collected from China (Table 1).Individual samples were preserved in 100% ethanol and stored at -20℃ until DNA extraction.All materials were deposited in the Institute of Entomology,Nankai University,Tianjin,China.The ipsilateral legs of 207 samples were used to extract total genomic DNA using the protocol of the UniversalGen DNA Kit (Beijing ComWin Biotech Co.,Ltd.).All 207 individuals were used to amplify a 658 bp fragment at theCOI5′ end.Meanwhile,the partialITS-1 sequence of a total of 31 individuals ofLeptocorisachinensis,L.
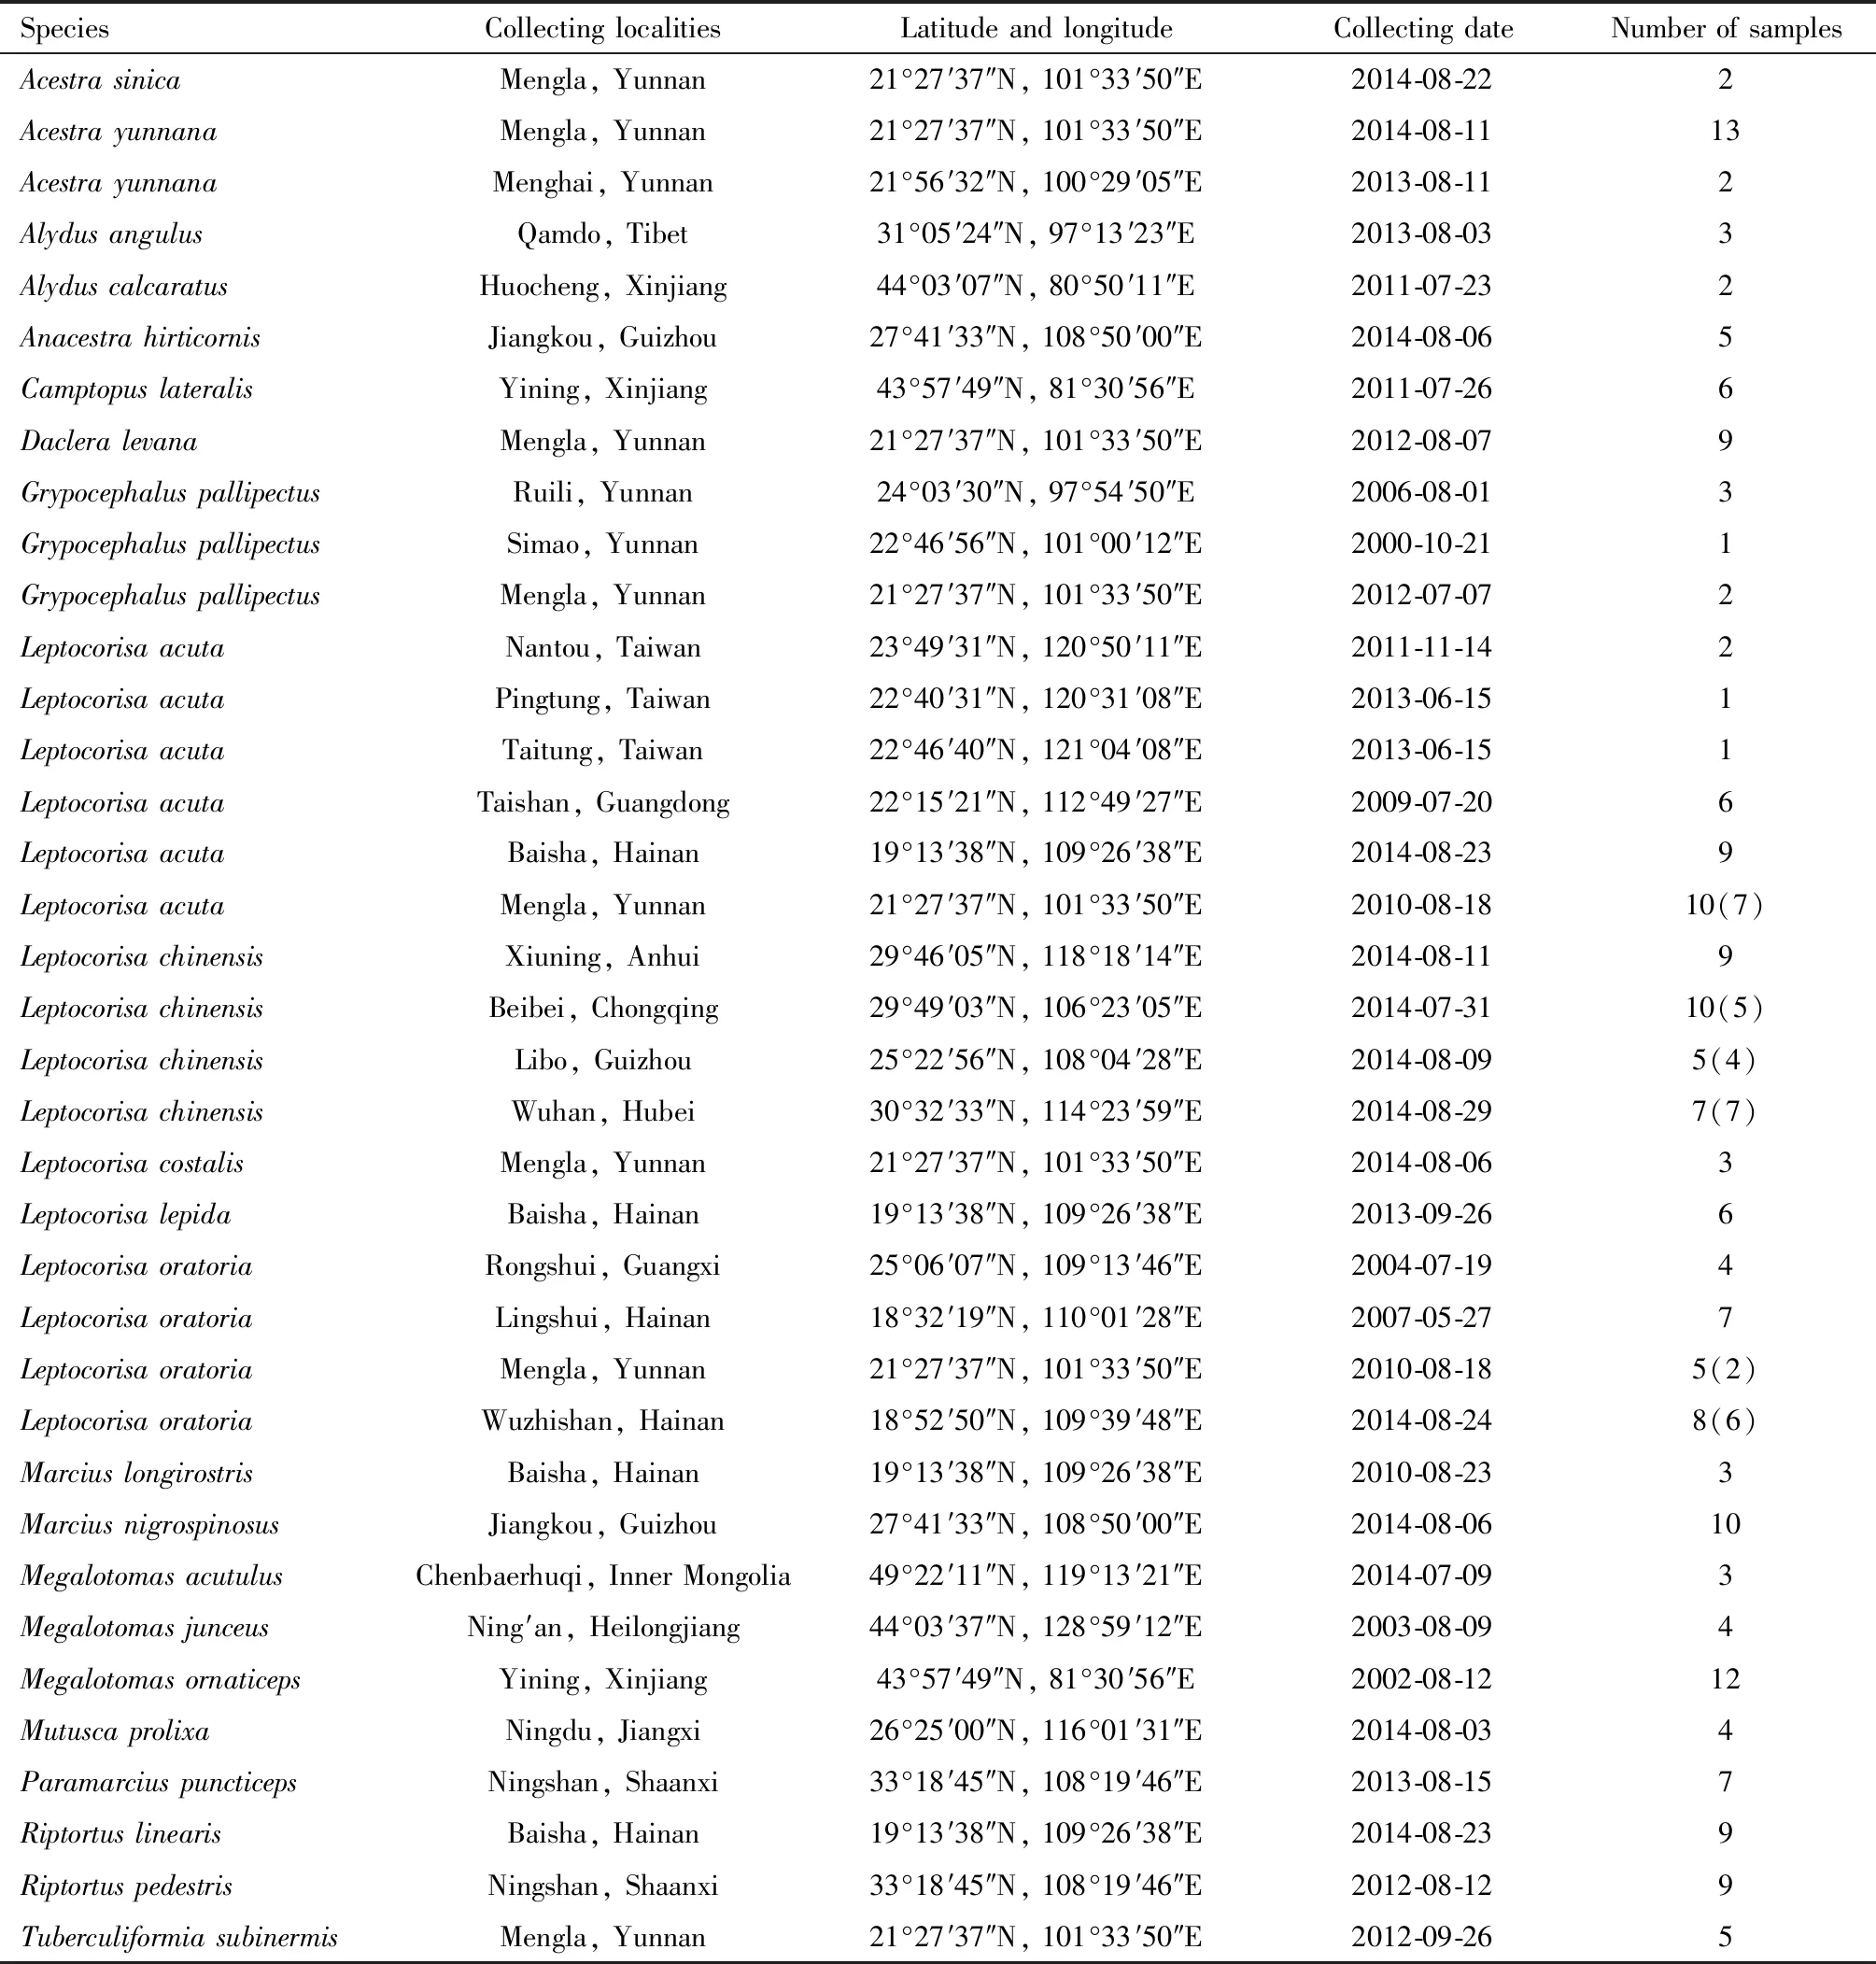
Table 1 Sampling information
oratoria,andL.acutawas amplified as an assistant marker for species delimitation.PCRs for amplification of the fragment at theCOI5′ end were performed using the universal primers LCO1490 and HCO2198 (Folmeretal.,1994).Primers AA5 (5′-CCGATTGAATGATTTAGTGAGGTCT-3′) and BB (5′-TCAAGCAGCCCGACTCTAAG-3′) were used to amplify the partialITS-1 gene sequence.A 40 μL PCR reaction containing 20 μL 2×Es Taq MasterMix (Beijing ComWin Biotech Co.,Ltd.),14 μL ddH2O,2 μL DNA template,and 2 μL of each sense/reverse primer (10 μmol/L).The procedures included an initial denaturation at 94℃ for 1 min,followed by 33 cycles of 30 s at 94℃,30 s at 51℃,and 40 s at 72℃,ending with a final single extra extension at 72℃ for 8 min.
2.2 Data analysis
COIandITS-1 fragment sequences from samples described in subsection 2.1 were trimmed and manually aligned using the BioEdit software version 7.1.9 (Hall,1999).A search was performed using the Basic Local Alignment Tool (BLAST)(Altschuletal.,1990) on the website of the National Center for Biotechnology Information (NCBI) and barcode records of the Barcode of Life Data System (BOLD)(Ratnasingham and Hebert,2007) to determine the similarity and/or contamination of the sequences with respect to any other published sequences.When the sequence identification hit a match of preferably >98% similarity,the morphology of the specimen was re-examined to ascertain the result of the earlier search.Nucleotide composition was analyzed using DnaSP 5.10 (Librado and Rozas,2009) and MEGA 11 (Tamuraetal.,2021).For 207COIsequences of broad-headed bugs collected from China,neighbor-joining (NJ) cluster analysis was performed using MEGA 11 (Tamuraetal.,2021) with the standard NJ method and pairwise distances modified using the Kimura two-parameter (K2P) model (Kimura,1980).Estimates of average evolutionary distances for interspecies,intraspecies and intergenera were also calculated using the maximum composite likelihood model in MEGA 11 (Tamuraetal.,2021).Bootstrap analysis was performed with 1 000 replicates.The online version of Automatic Barcode Gap Discovery (ABGD)(Puillandreetal.,2012) was used for both pairwise distance analyses and to generate distance histograms and distance ranks.Molecular operational taxonomic unit (MOTU) division was performed in jMOTU (Jonesetal.,2011).Network 4.6.1.3 (Fluxus Technology,Suffolk,UK) was used to create intraspecific median-joining networks to visualize the evolutionary relationships among haplotypes ofLeptocorisaspecies (Bandeltetal.,1999).
3 RESULTS
3.1 Features of COI fragment sequences
We ultimately obtained 207 partialCOIsequences with a length of 601 bp from all Alydidae individuals,which included 258 variable sites and 247 parsimony informative sites,after deleting the terminal ambiguous region of the aligned data.Furthermore,no insertions or deletions were found in DNA sequences,and no stop codons were found when the DNA sequences were translated into amino acids,implying that all amplified sequences encode functional COI.The meanCOIsequence composition in the generated sequences was A%=31.3%,C%=17.5%,G%=16.7% and T%=34.5%,revealing a high AT content (65.8%),as is typically known from this gene fragment for arthropods.
3.2 Genetic divergence
The mean intraspecific K2P distances of all species were below 2% (Fig.1:A),ranging from 0 to 1.575%,with three species being between 1%-2% and others being less than 1%.The average of all species was approximately 0.41%.The interspecific K2P distances ranged from 0.98% to 23.98%,with an average of 17.50%.All interspecies K2P distances were distinctly greater than intraspecific K2P distances except for two outliers including 0.98% betweenL.oratoriaandL.chinensis,and 1.74% betweenMegalotomusacutulusandM.ornaticepts.Both were remarkably smaller than the average,creating no barcoding gap between intraspecific and interspecific distance.The intergeneric distance ranged from 14.27% to 22.75%,except for the distance between the generaAlydusandMegalotomus,which was only 9.82%.There was no significant barcoding gap between interspecific and intergeneric distances.
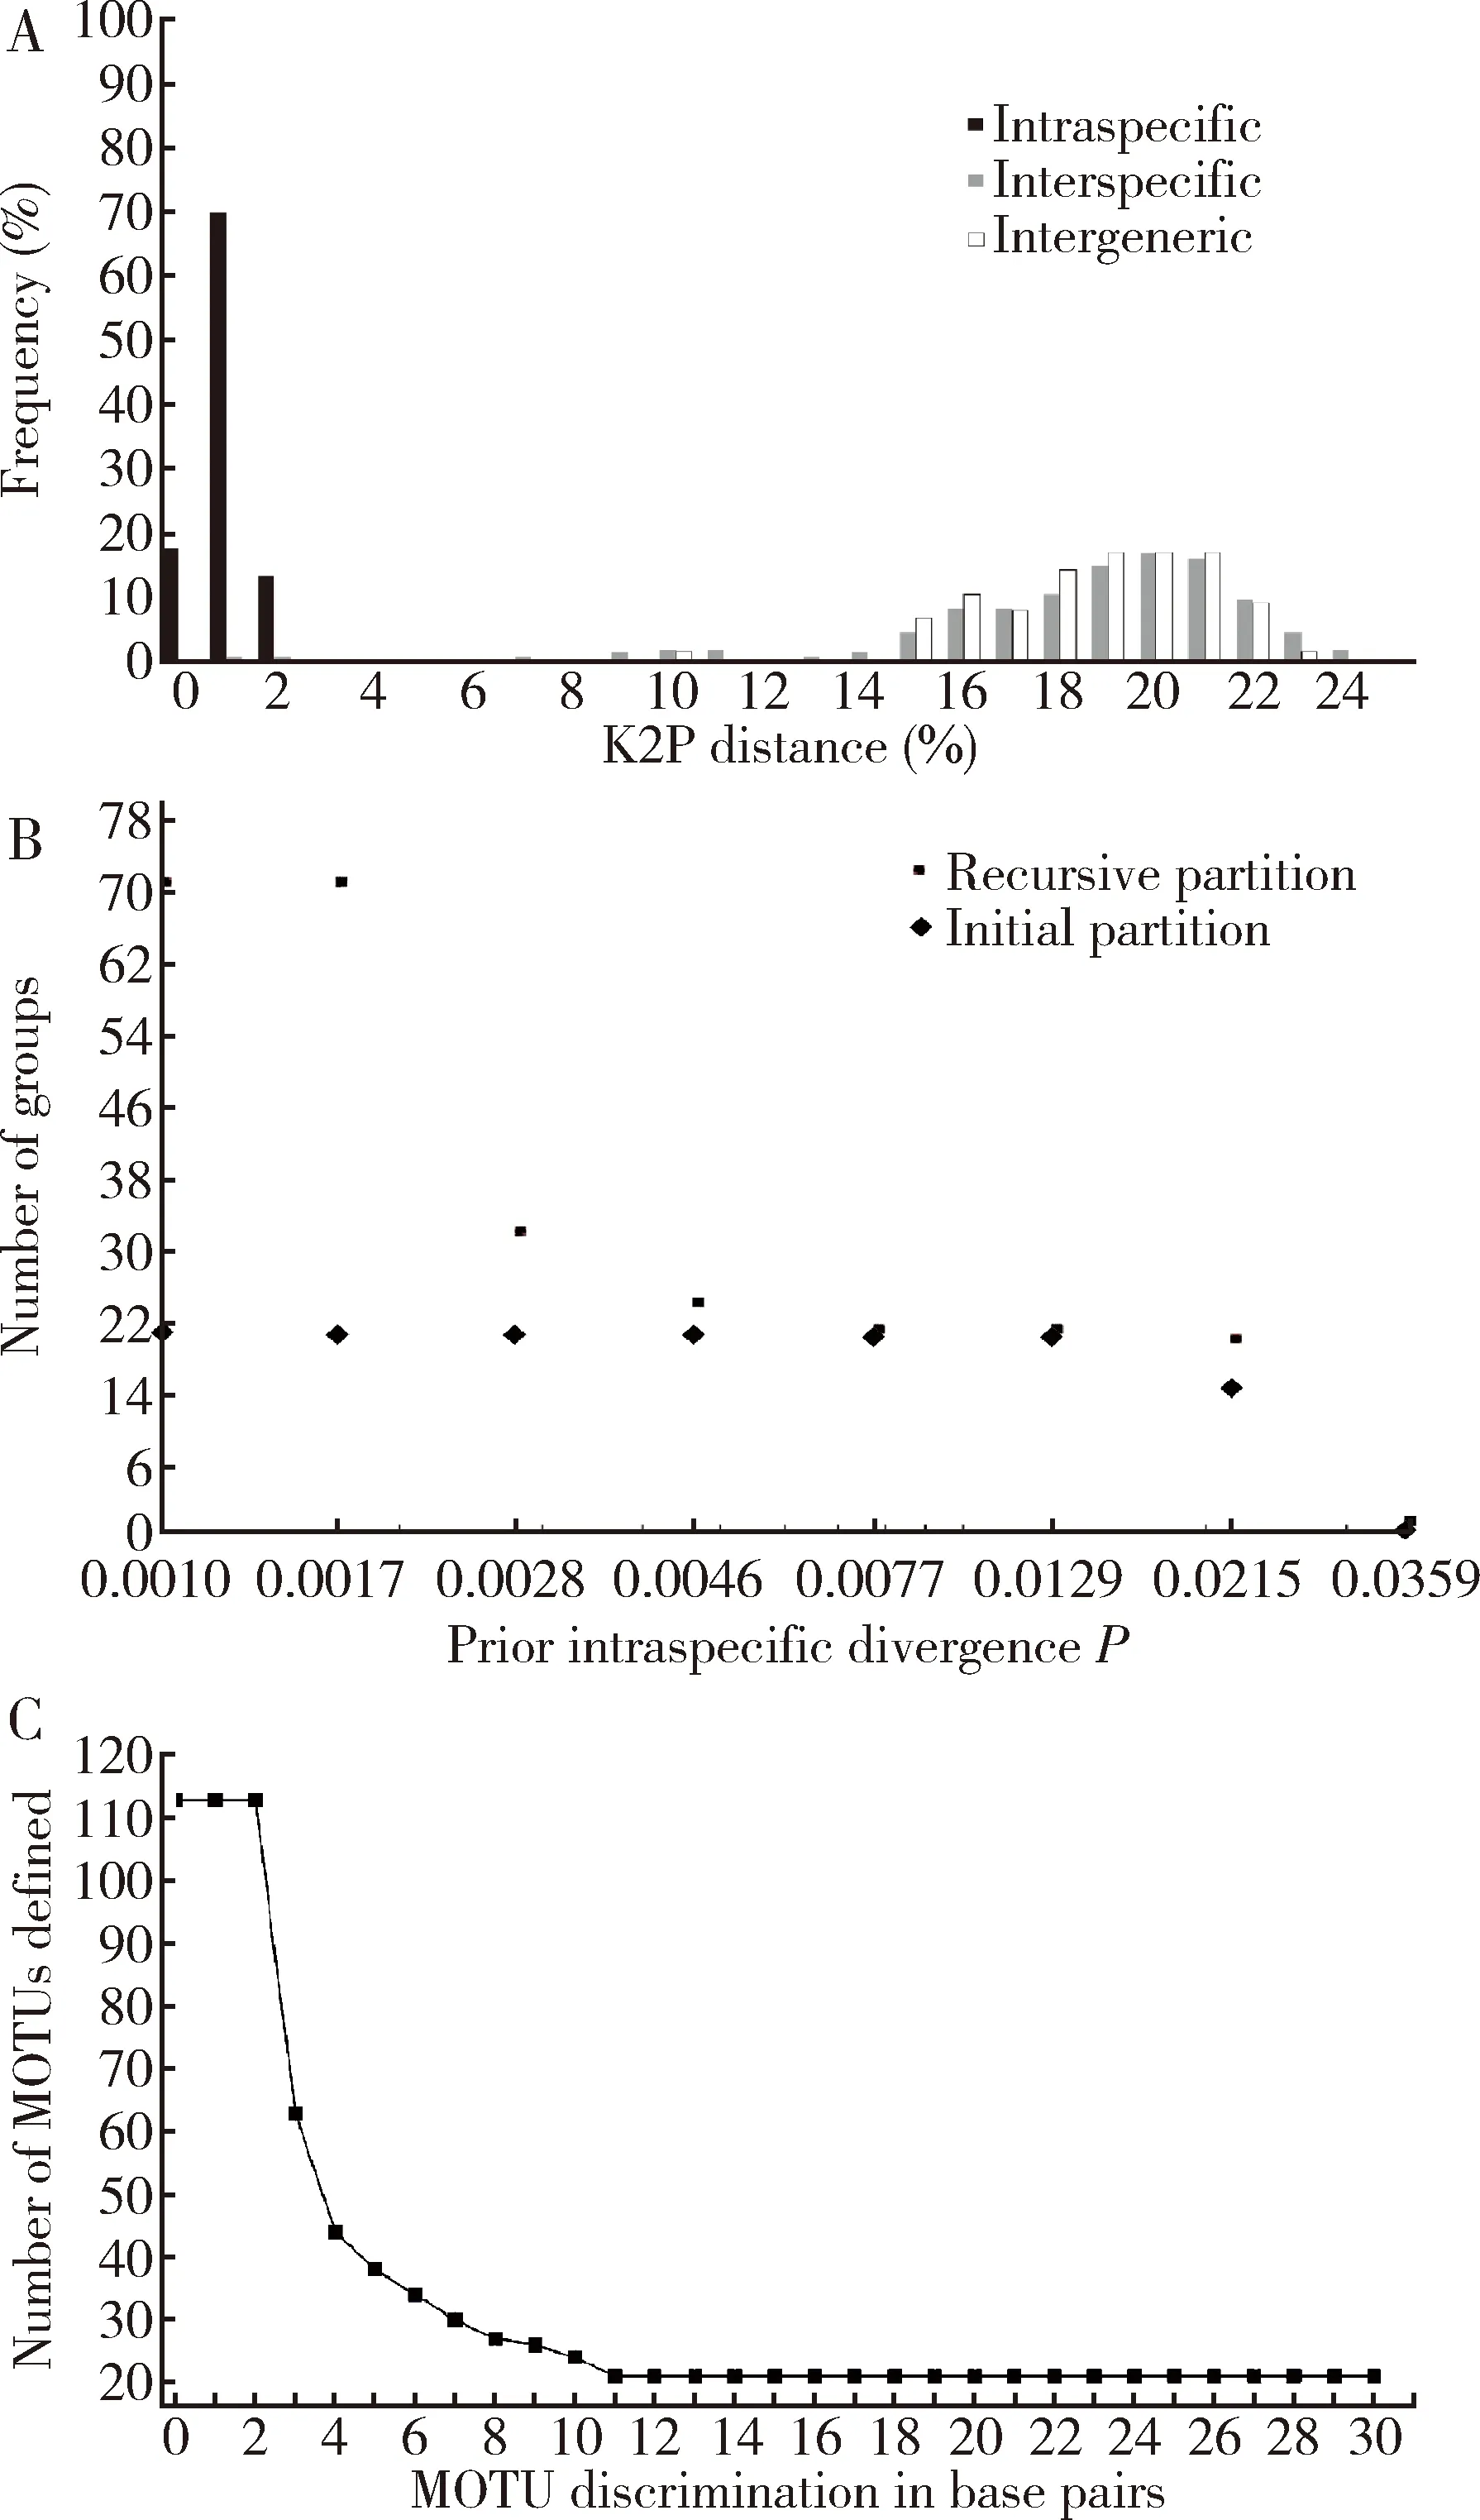
Fig.1 Results of genetic divergence (A),automatic barcode gap discovery (ABGD)(B) and molecular operational taxonomic unit (MOTU)(C) analyses.A:Genetic divergences (K2P distances) between COI sequences for varied taxonomic levels of Alydidae from China;B:The automatic partition results for species of Alydidae from China as generated using ABGD;C:Variation in the number of MOTUs defined at 0 to 30% cutoff values for DNA barcodes.
During the initial partition of the ABGD analysis (Fig.1:B),the division reached a stable level at 21 groups,which matched the MOTUs analyzed using jMOTU (Fig.1:C).In the recursive partition,the division varied with different prior intraspecific divergences from 1 to 53 groups (Fig.1:B).jMOTU analysis divided the samples into different numbers of MOTUs at different cutoff values (Fig.1:C).When cutoff values were between 11 and 30,there were 21 MOTUs,which did not match the number of species defined using morphology.The jMOTU analysis combinedM.acutulusandM.ornaticeptsas well asL.chinensisandL.oratoriainto one species,respectively.In fact,based on the current data,there was no cutoff value that exactly matched the morphological species number.At the species level,NJ clustering analysis revealed that each of the 23 species formed a monophyletic cluster,except forL.chinensisandL.oratoria(Fig.2).These two species merged together into one cluster with a high bootstrap support value (Fig.2).Otherwise,despite of the low interspecific K2P distance (1.72%),M.acutulusandM.ornaticeptsseparated from each other and formed a sister cluster in the NJ tree (Fig.2).At the genus level,the clusters were more confusing.Firstly,the speciesAlydusangulusran into the genusMegalotomusinstead ofAlydus(Fig.2).In addition,the speciesM.nigrospinosusformed a sister cluster withAnacestrahirticornisbut notMarciuslongirostris(Fig.2).At the subfamily level,the genera were divided into three subfamilies,Alydinae,Micrelytrinae and Leptocorinae.All the three subfamilies separated from each other well.Both Alydinae and Micrelytrinae together formed a sister group with Leptocorisinae.
3.3 Haplotypes and haplotype network analysis for Leptocorisa species
A total of 113 haplotypes for theCOIsequences were sampled,with approximately one haplotype for every 1.8 individuals.The haplotype diversity (Hd) was 0.9891 on average.All species occupied one or more unique haplotypes,except forL.chinensisandL.oratoria.These two species shared five haplotypes.
BecauseL.chinensisandL.oratoriaconstituted the same haplogroup that exhibited the reticulate structure and shared haplotypes (Fig.3:A),we amplified the sequences of the partialITS-1 gene as an assistant marker forL.chinensisandL.oratoriatogether withL.acuta.The result identified one haplotype for each species that matched a priori designations of three species well (Fig.3:B).
4 DISCUSSION
The present study addressed for the first time usingCOIbarcode sequences of broad-headed bugs in China for the purpose of identification.Overall,theCOIbarcodes were applicable for identifying Alydidae bugs in China.However,the results also indicated some valuable phenomena in specific genera or species.
The speciesA.angulus,which ran into the genusMegalotomus,exhibited a closer phylogenetic relationship withMegalotomusthanAlydus.In addition,the interspecific genetic differentiation betweenA.angulusandA.calcaratus(12.05%) was much higher than the value betweenA.angulusand threeMegalotomusspecies (8.64%,9.70% and 9.71%,respectively).These two criteria indicated the need to reconsider the taxonomic status ofA.angulusat the genus level.
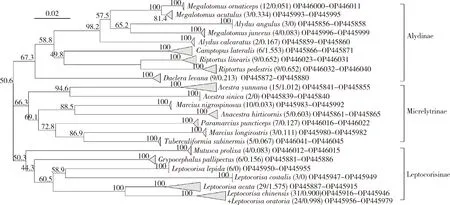
Fig.2 Neighbor-joining tree of COI divergences among species (1 000 replicates)The paired numbers in parentheses after each species name are the numbers of specimens and intraspecies K2P genetic distances,respectively.The numbers at the nodes are the bootstrap values.The scale bar indicates the genetic distance.
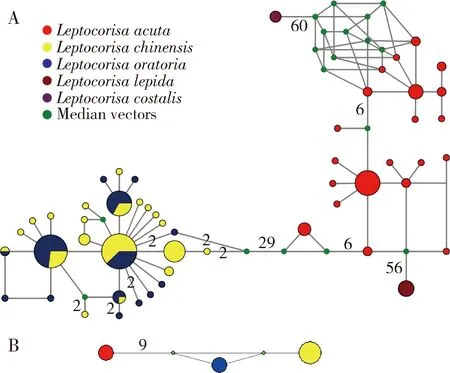
Fig.3 Statistical parsimony networks showing relationships among the analyzed COI (A) and ITS-1 (B) haplotypes of Leptocorisa species The numbers of base pair changes are shown.Small green dots indicate missing haplotypes.
Regarding the genusLeptocorisain Micrelytrinae,due to the shared haplotypes byL.chinensisandL.oratoria,none of the above methods or analyses based onCOIbarcodes were suitable for distinguishing them from each other,indicating the shortcoming and incapability of the standardCOIbarcode region,especially for delimiting closely related species (Rubinoffetal.,2006;van Velzenetal.,2012).TheITS-1 sequence would be a suitable DNA marker to distinguish the two species.Moreover,according to the most recent study,the genome-wide SNP data clearly distinguished the reciprocal monophyly and sister-group relationship betweenL.chinensisandL.oratoria,consistent with the morphological species assignments (Dongetal.,2022).This indicated that when we encountered species with close genetic relationships,morphological evidence as well as other sources of data should be considered (Dammetal.,2010;Jungetal.,2011b;Wachteretal.,2015;Dongetal.,2022).In other words,COIbarcodes cannot be used alone.They provide information rather than knowledge (Ebach and Holdrege,2005).
The interspecies genetic K2P distances based onCOIbarcodes demonstrated the close relationships betweenL.chinensisandL.oratoriaand betweenM.acutulusandM.ornaticepts(Fig.1).This could be problematic if we combined them into one single species,as the jMOTU and ABGD analyses indicated.The neighbor-joining tree separatedM.acutulusandM.ornaticeptsbut failed to separateL.chinensisandL.oratoria(Fig.2) as before.
In addition,from the cluster analysis,we proposed to reconsider the taxonomic status ofA.angulusandM.nigrospinosus,especially at the generic level.A morphological review of the two genera should also be performed.These findings indicated that DNA barcoding provided suggestions about the validities of the classification system built long before,which was only based on comparative morphology at the time.
This study represented a first and important step in determining the utility of DNA barcodes for discriminating among broad-headed bug species,particularly those in China.All samples were collected from China,covering over 60% species and 87% genera of Alydidae bugs in China.Some are well-known species,such as the species in the genusLeptocorisa,known as rice seed bugs,which have long been as the major pests of rice in the Oriental Region (Siwi and van Doesburg,1984).For many of the other species,these barcode sequences represent the very first available molecular data characterizing them.DNA barcoding results from our data were congruent with the most of taxonomic units of the family Alydidae based on morphological characteristics,except forL.chinensisandL.oratoriaspecies.For these two species,morphological taxonomy was more pragmatic thanCOIbarcode sequences.
Furthermore,the present study also highlights the need for further taxonomic revisions using integrated methods and different sources of data to determine the taxonomic status of various species within Alydidae,such asA.angulusandM.nigrospinosusmentioned above.We hope this study will help with the development of DNA barcode libraries in general and support future molecular research as well as other approaches for studying Alydidae.
