Establishment and Validation of a nomogram for Predicting the Risk of Liver Fibrosis in Chronic HBV Infection
2022-11-15HUANGShengkaiFUWeiSUNLong
HUANG Sheng-kai, FU Wei, SUN Long
Keywords:Chronic HBV infection Liver fibrosis Nomogram
ABSTRACT
1. Introduction
It is reported that there are about 257 million chronic Hepatitis B virus (HBV) infected people worldwide, and about 887 000 people die of HBV-related diseases every year, among which cirrhosis deaths account for 52%[1]. Liver fibrosis is an important link in the process of liver disease[2]. Significant liver fibrosis is one of the conditions for anti-HBV therapy[3-6]. Liver biopsy histopathological examination is still the "gold standard" for the diagnosis of liver fibrosis[2], but it is invasive, so it is generally not well accepted by patients. Rosette map helps clinicians to quickly evaluate patients with specific models through visualization and graphics, and is currently applied to various diseases[7]. In clinical practice, it has been shown to be superior to traditional methods in disease assessment, prognosis prediction and treatment selection, and has received a high degree of attention and application in clinical practice[8]. This study constructed a significant liver fibrosis rosette scoring system for patients with chronic HBV infection, aiming to provide a noninvasive liver fibrosis evaluation model for patients with chronic HBV infection, and provide certain reference for the treatment period of anti-HBV and anti-liver fibrosis.
2. Materials and methods
2.1 The research object
A total of 180 patients with chronic HBV infection who signed informed consent and underwent liver biopsy biopsy in the Department of Infectious Diseases, The First Affiliated Hospital of Hainan Medical University from January 2019 to December 2021 were retrospectively selected. Inclusion criteria :(1) meet the diagnostic criteria for chronic HBV infection[6]; (2) If he/she has clear consciousness, he/she can sign the informed consent by himself/herself. Exclusion criteria :(1) complicated with diabetes,extrahepatic tumor, cardiovascular disease and other extrahepatic related diseases; (2) autoimmune hepatitis, other hepatitis virus, fatty liver, drug liver damage and other related intrahepatic factors; (3)Patients with incomplete data. To prevent overfitting of the model,patients were divided into modeling group (n=131) and validation group (n=49) by cluster randomization.
2.2 The research methods
The risk factors for significant fibrosis in patients with chronic HBV infection were collected in the references [9-10]. Including: (1)Basic data: age and gender of patients were collected and included.(2) Liver fibrosis grading results: All the included patients met the criteria for liver biopsy and had signed informed consent. Ultrasound doctors performed puncture and pathologists scored the degree of liver fibrosis. According to the staging of liver tissue fibrosis by Metavir scoring system, F≥2 was classified as significant fibrosis.(3) Blood test: Blood test was performed within 48 hours before liver biopsy, and fasting venous blood was found in all patients in the early morning. The detection items were hepatitis B surface antigen (HBsAg), Hepatitis B E antigen (HBeAg), hepatitis B core antibody (HBcAb), HBV DNA quantification, platelet count (PLT),Liver function includes alanine aminotransferase (ALT), aspartate aminotransferase (AST), alkaline phosphatase (ALP), glutamyl transpeptidase (GGT), albumin (ALB), globulin (GLB), prealbumin(PAB), interleukin-6 (IL-6), The four hepatic fibrosis items included hyaluronic acid (HA), n-terminal peptide of type III procollagen(PIIIP), type IV collagen (CIV) and laminin (L.N). (4) Liver hardness value: The liver hardness value (LSM) of patients was measured by ultrasound doctors using 2D shear-wave elastic imaging(2D-SWE). This study was approved by the Ethics Committee of the First Affiliated Hospital of Hainan Medical College.
2.3 Statistical processing
R 4.1.1 software was used for statistical analysis. The counting data were expressed as numbers (percentages) using the χ2test. Normal distribution of measurement data was expressed by mean ± standard deviation (±s ) and t test was used. Non-conforming distributions were represented by median (interquartile spacing) [M(P25,P75)]and rank-sum test was used. Multivariate analysis used stepwise backward regression analysis. RMS package was used to analyze the regression model and draw the line graph model. Bootstrap method was used to repeat 1000 samples for internal and external verification. H-l goodness of fit test and ROC curve were used to evaluate the calibration degree and differentiation degree of the line graph model, respectively. The level of bilateral test was α=0.05, and P<0.05 was considered to be statistically significant.
3. Results
3.1 The general information
A total of 180 patients with chronic HBV infection were enrolled,including 28 patients (15.5%) with F0, 39 patients (21.7%) with F1, 60 patients (33.3%) with F2, 37 patients (20.6%) with F3, and 16 patients (8.9%) with F4. There were 113 cases (62.7%) with significant fibrosis (F≥2).
3.2 Comparison of case data between the modeling group and the validation group
Results Significant fibrosis occurred in 84 patients (64.1%) in the modeling group. There were no statistically significant differences in age, sex, or disease progression (with or without significant fibrosis)between the modeling and validation groups (P>0.05), indicating that the data of the two random groups are comparable, as shown in Table 1.
3.3 Comparison of data of patients with nonsignificant fibrosis and significant fibrosis in the modeling group
There were statistically significant differences in HBV DNA,PLT, ALT, AST, ALP, ALB, PAB, IL-6, HA, PIIIP, CIV, L.N, LSM between patients with non-significant fibrosis and those with significant fibrosis (P<0.05). Are shown in Table 2.

Table 1 Evaluation results of the consistency test of case information between the modeling and validation groups

Table 2 Comparison of clinical data between non-significant fibrosis and significant fibrosis data in the modeled group
3.4 Stepwise backward regression analysis was used to best evaluate the model of significant fibrosis in patients with HBV infection
HBsAg, Ln(HBV-DNA), PLT, ALT, AST, ALB, ALP, PAB, HA,PⅢP, CIV, L.N, LSM, IL-6 as independent variables. The best influence models were ALB, HA,PⅢP(Z=1.98,P= 0.047), IL-6 and LSM(Z=3.09,P= 0.002) by stepwise regression.
3.5.1 Establishment of a rosette model to predict the risk of significant liver fibrosis in chronic HBV infection
According to stepwise backward regression analysis, a rosette model for predicting the risk of chronic HBV infection with significant liver fibrosis was established, as shown in Figure 1.According to the accumulation of numerical scores of relevant factors, the higher the model total score in the line chart, the higher the corresponding risk of significant fibrosis after HBV infection.

Figure 1 Nomogram model for predicting significant fibrosis risk of chronic HBV infection
3.5.2 Validation of the rosette model for predicting the risk of significant liver fibrosis in chronic HBV infection
The χ2values of Hosmer-Lemeshoe's goodness of fit test (H-L goodness of fit test) in the modeling group and the verification group were 4.988 and 0.527, respectively, and the corresponding P values were 0.08 and 0.77, indicating that the established line diagram model had good predictive accuracy, as shown in Figure 2 and Figure 3. The AUROC of significant fibrosis after HBV infection was 0.843[95%CI(0.775-0.910)] and 0.776[95%CI (0.714-0.838)] in the model group and the validation group, respectively, as predicted by the rosette diagram, suggesting that the model had good differentiation, as shown in Figure 4 and Figure 5.
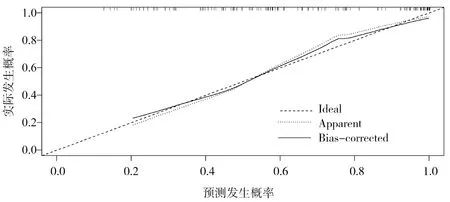
Figure 2 Calibration curve of the risk of developing significant fibrosis in HBV infection in modeling set predicted

Figure 3 Calibration curve of the risk of developing significant fibrosis in HBV infection in validation set predicted
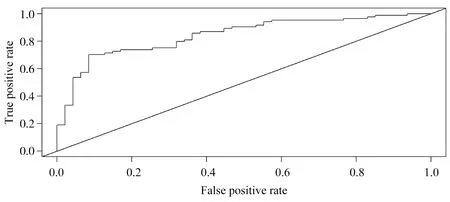
Figure 4 ROC curve of the risk of developing significant fibrosis in HBV infection in modeling set predicted
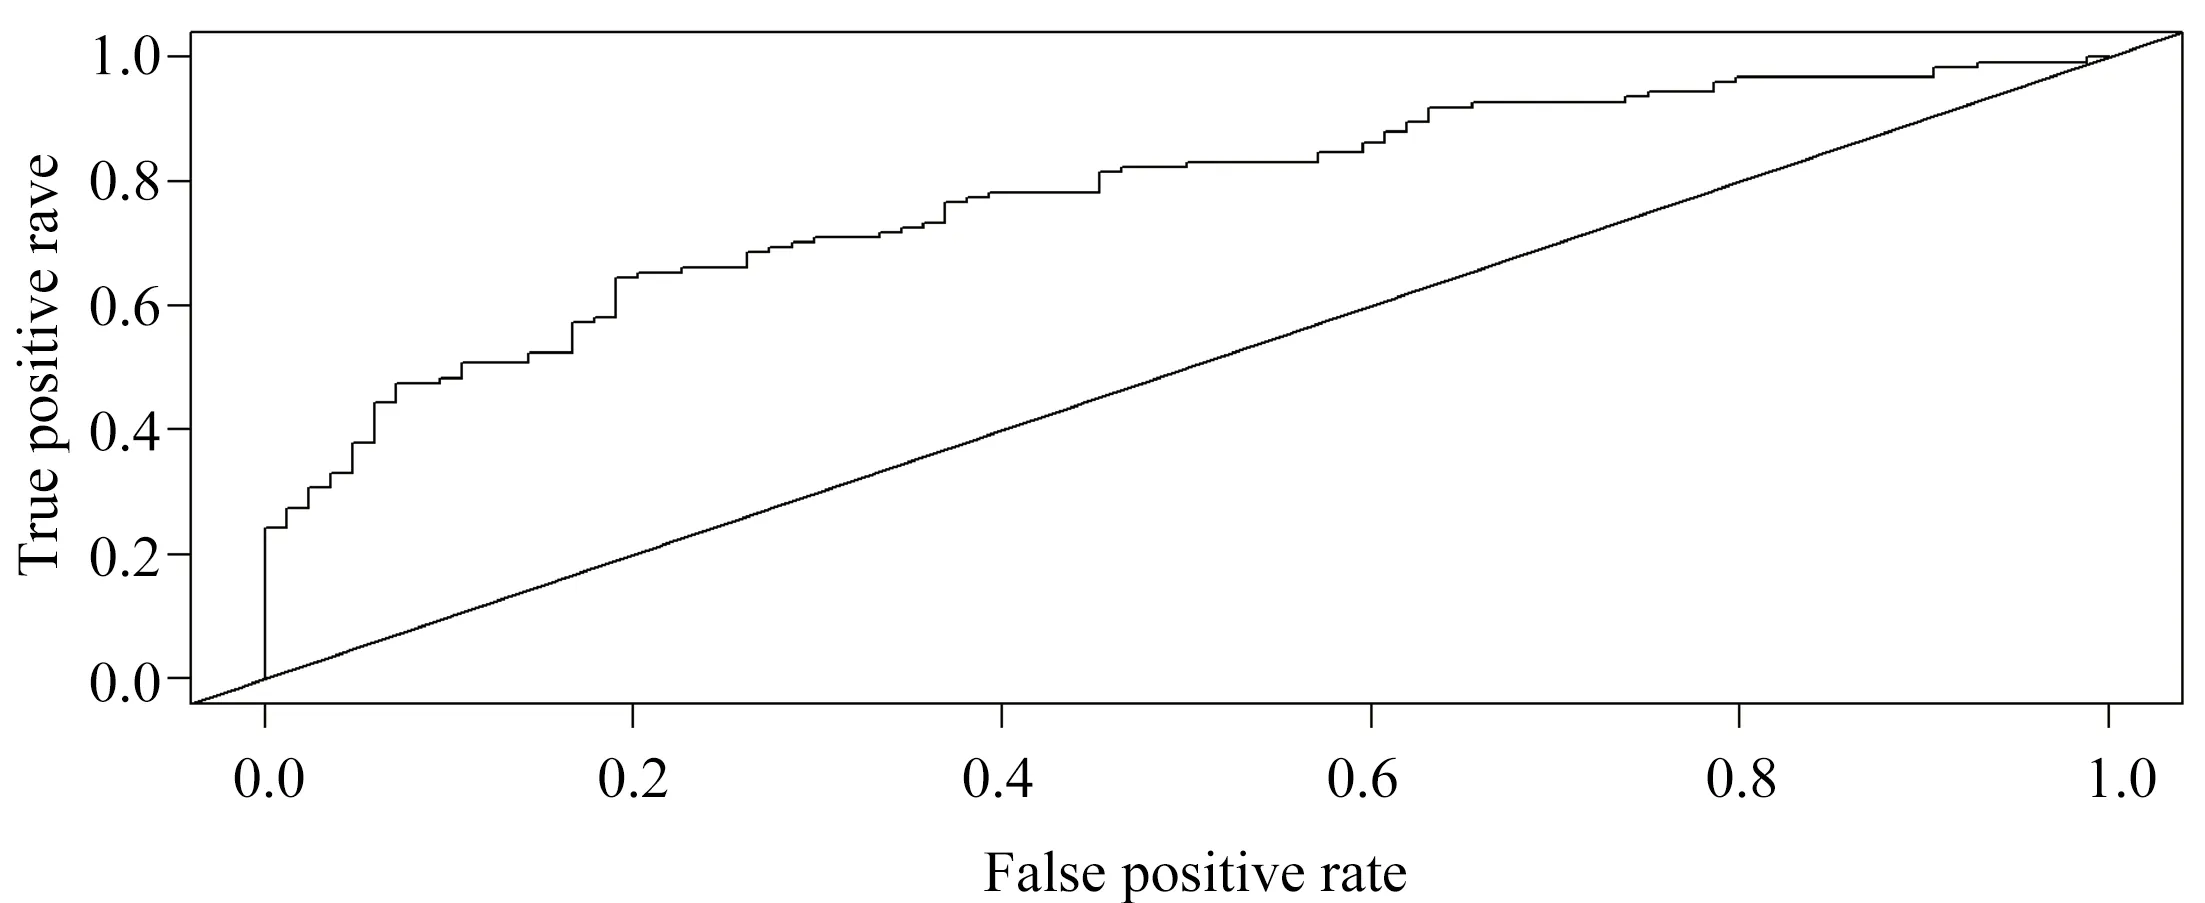
Figure 5 ROC curve of the risk of developing significant fibrosis in HBV infection in validation set predicted
3.5.3 Verified with traditional FIB-4 and APRI
In the modeling group, the AUROC of APRI and FIB-4 for the diagnosis of significant liver fibrosis was 0.682 [95%CI (0.586-0.779), Z=2.72, P < 0.01] and 0.608[95%CI (0.509-0.707), Z= 2.23,P<0.05], respectively. All are lower than the established line graph model. In the validation group, the AUROC of APRI and FIB-4 for the diagnosis of significant liver fibrosis was 0.738[95%CI (0.596-0.880), Z=2.20, P<0.05] and 0.698[95%CI (0.551-0.845) Z=2.21,P<0.05], respectively. The efficiency is worse than that of the established line diagram.
4. Discussion
China is a country with high incidence of chronic hepatitis B, and liver fibrosis is an inevitable stage from chronic HBV infection to cirrhosis. The most important clinical concern is to accurately predict and evaluate the degree of liver fibrosis, which is of great significance for clinical diagnosis and treatment. The clinical application of liver biopsy is limited by patients' cognition and invasive operation. In recent years, more and more non-invasive methods have been applied into clinical practice [11-12].
Liver elastography has high diagnostic value for patients with liver fibrosis[2], and some studies suggest that the diagnostic threshold for significant liver fibrosis is 9.1kpa (specificity: 95%, positive likelihood ratio: 6.4) [6,13]. Studies have confirmed that ALB can be used as a parameter to evaluate the degree of liver fibrosis [14]. HA is a commonly used indicator of liver fibrosis in clinical practice,mainly reflecting the amount of generated liver fibers and the damaged status of liver cells. Serum PIIIP level mainly reflects the synthesis status of liver fibers and inflammatory activity [15]. Studies have shown that both HA and PIIIP can reflect liver fibrosis, and their levels are positively correlated with the degree of liver fibrosis[16]. However, the clinical diagnostic threshold has not been unified yet [6]. Studies have shown that IL-6 is a typical cytokine composed of 184 amino acids, whose gene is located on 7p21 staining [17], and has a variety of biological functions. Pan Z L et al. [18] found that IL-6 plays an important role in HBV infection, and studies have shown that serum IL-6 of patients with chronic HBV infection is closely related to liver function damage and disease progression[19]. Il-6 mRNA expression in liver tissues, peripheral blood and serum of patients with cirrhosis is significantly higher than that of patients with liver fibrosis [20]. A total of 180 patients with chronic HBV infection were enrolled in this study, 70% and 30% of whom were randomly assigned to the modeling group and validation group. Variables were analyzed by stepstep backward regression analysis, and the results suggested that ALB, HA, PIIIP, LSM, and IL-6 were independent risk factors for significant liver fibrosis. The identification of significant liver fibrosis by ALB, HA, PIIIP, IL-6,and LSM means that we can provide a new noninvasive evaluation tool in the form of a rograph to identify patients with chronic HBV infection who need liver biopsy to determine the degree of liver fibrosis, and thus timely intervention in clinical diagnosis and treatment.
APRI and FIB-4 are currently recommended to evaluate the degree of liver fibrosis in patients with chronic HBV infection [6].Compared with the traditional APRI and FIB-4 models, the line chart model presents the score evaluation of each risk factor in the form of assigned score, which can independently quantify the risk of significant liver fibrosis in each patient with chronic HBV infection.It is more concise and intuitive, and is better than the traditional model in clinical individualized evaluation. Clinicians can according to the diagram model of the risk factors for different grades of significant liver fibrosis in patients with chronic HBV infection risk assessment, according to the measurements to find the corresponding score and get the current assessment score together, formulate the corresponding clinical diagnosis and treatment plan and to reduce the total score for the finish line, and repeated assessment in stages.APRI and fib-4 are non-invasive assessment models that have been recommended in several studies and clinical guidelines to assess significant liver fibrosis in patients with chronic hepatitis b [6,21].Studies have reported that THE AUROC of APRI and FIB-4 models in patients with significant hepatic fibrosis (F≥2) were 0.69 and 0.71,respectively [22]. Compared with the two evaluation models, the effect of the rotavirus in this study was better in predicting significant liver fibrosis in patients with chronic HBV infection. AUROC of the rotavirus in the modeling group was 0.843[95%CI(0.775-0.910)],which was significantly higher than THAT of APRI(0.682) and FIB-4(0.608). Similar results were obtained in the validation group.Compared with APRI (0.738) and FIB-4 (0.698), the AUROC of the validation group was 0.776[95%CI (0.714-0.838)] in the diagnosis of significant liver fibrosis, which also demonstrated the superior efficacy of the validation group.
In conclusion, the rosette model based on ALB, HA, PIIIP, IL-6 and LSM can visually and quantitatively evaluate the risk of significant liver fibrosis after HBV infection. However, this study has certain limitations, such as single sample source, small sample size of liver biopsy, selection bias, and failure to conduct a multi-center study. Therefore, it is necessary to conduct a multi-center, largesample study to confirm the applicability of this rosette in clinical application.
Author contribution
Huang Shengkai conceived and designed the article, collected and sorted out materials, and wrote the paper; Sun Long was responsible for the quality control and review of the article, and was responsible for the whole article; Fu wei revises papers and English.There is no conflict of interest.
杂志排行

Journal of Hainan Medical College的其它文章
- Research progress on inflammatory mechanism and traditional Chinese medicine in the treatment of diabetic retinopathy
- Research progress on the mechanism of TCM treatment of depression based on NLRP3 pathway
- Effect of Shengsui Jiangu Capsule on bone conversion in rats with alcoholic osteoporosis
- Effectiveness and Safety of Chinese Medicine in the Treatment of PostTACE Syndrome of Primary Hepatocellular Carcinoma: A Systematic Review
- Real world analysis on renal impairment of elemene emulsion injection based on propensity score matching
- Clinical observation of kidney tonifying and collateral tonifying acupuncture combined with thermosensitive moxibustion in the treatment of knee osteoarthritis and its effect on TRACP and CTX-I