基于BP神经网络的不同时间尺度泵站前池水位预测模型
2022-11-15薛萍张召雷晓辉卢龙彬颜培儒李月强
薛萍,张召,雷晓辉,卢龙彬,颜培儒,李月强
(1.济南大学水利与环境学院,济南 250022;2.中国水利水电科学研究院水资源所,北京 100038;3.天津大学建筑工程学院,天津 300072;4.河海大学水利水电学院,南京 210098)
明渠调水工程在进行长距离输水调度时,一般通过在渠道中设置泵站、节制闸、倒虹吸等水工建筑物解除地形条件对输水限制的影响,同时在建筑物前设置水位计、流量计等监测设备获取水情信息监控通水安全。相比于实时水位监测,高精度的水位预测更能在水量调度过程中为调度人员提供科学指导,尤其是泵站前池水位预测,对泵站调控、水量调度、渠道安全均具有重要意义。受气候、温度、人类活动等多种因素影响,监测设备采集到的水情序列往往呈现出非线性和不确定性的特点,常规方法很难对其进行规律分析和趋势预测。学者[1-3]曾通过建立水力学模型模拟渠道水流的变化过程,但建模要求完整且准确的地形资料、工程参数和实测数据,糙率率定过程也较为反复和繁琐[4],因此存在较大的局限性。随着人工智能技术和机器学习方法的不断进步,采用数据驱动的方法进行预测可避免水力学建模的多方面要求和诸多限制,直接探索数据间的内在规律[5]。
到目前为止,大部分学者[6-9]通过构建神经网络模型进行水位预测,如采用优化后的RBF神经网络、LSTM神经网络模型、小波神经网络等应用于地下水位预测,预测精度高且预测效果处于较优水平;虽可建立向量机RVM预测模型[10]、Mike模型[11]、相似模型[12]、统计模型[13]、贝叶斯模型[14]等进行水位预测,但使用时受限于一定的条件,故应用于调水工程中水位预测时不太广泛;因神经网络已广泛应用于水位预测,发展逐渐趋于成熟,也有众多学者[15-26]通过将神经网络模型、算法组合或者改进算法的方式进行水位预测,如吴美玲[27]等将KNN、GA、BP相结合,对秦淮河的洪水位进行预测,相比于未组合的神经网络模型预测精度提高但略为复杂,但未组合的神经网络模型较为简单实用,如高学平等[28]利用BP神经网络对泵站站前水位进行预测,发现BP神经网络在解决非线性问题上有很大优势,在智能预测方面存在巨大潜力。同时,常用的评价指标有ERMS(均方根误差)、R2(决定系数)[29]等。
综上可知,构建神经网络进行水位预测是一种切实可行的研究方法。人工神经网络等智能算法在水文预测应用中具有一定的适用性条件,如:ANN有强大非线性能力,但结构简单不能保存前时信息而无法学习时间序列数据;RNN能保持先前时刻的水位预测,可有效处理序列数据,但梯度传递中存在缺陷;LSTM具有长短期记忆功能,在一定程度上解决梯度消失和梯度爆炸,但长序列依旧存在问题且不能并行;受信息单向流动特点的限制,经典BP神经网络考虑有限数量的历史信息,仅适用于短时预测,但结构稳定,具有多功能性和简便性的特征,可灵活处理非线性问题并达到较高的预测精度,具有极强的非线性映射能力;而水文预测中的水情序列因受人为因素影响较大,呈现出较大的非线性特点,故BP神经网络适用于水文预测。BP神经网络自1986年被Rumelhart等[30]提出后,已被广泛应用于水文预测领域的研究。本文通过建立BP神经网络,利用历史数据预测泵站前池未来时刻的水位,分析时间序列比例及影响因子对水位预测的影响,预测结果既可为泵站前池水位预测提供一种预测方式,也给泵站前池水位变化趋势提供参考数据。
1 研究方法
选取泵站前池水位为研究对象,利用相关性分析确定影响因子,并将其作为输入进行BP神经网络模型构建,预测结果用各指标参数情况评判优劣。
1.1 影响因子识别
受各种水力因素(断面面积、水力比降、糙率等)影响,渠道内断面流量和水位之间存在对应关系。泵站前池水位作为监测断面之一,与相邻断面的水位、泵站的流量、上游流量、流量差等均可能存在水力联系。将这些相关的水位、流量等作为变量,对各变量与预测因子进行相关性分析,识别出具有一定关联度的影响因子。
采取的影响因子识别方法有皮尔逊(Pearson)相关系数法、肯德尔(Kendall)相关性系数法、斯皮尔曼(Spearman)等级相关系数法及灰关联分析。皮尔逊相关系数法用于度量2个变量之间的相关程度,2个变量之间的皮尔逊相关系数定义为2个变量之间的协方差和标准差的商;肯德尔相关性系数法是表示多列等级变量相关程度的一种方法,若n个同类的统计对象按特定属性排序,其他属性通常是乱序的,同序对和异序对之差与总对数[n(n-1)/2]的比值定义为肯德尔系数;斯皮尔曼等级相关系数法是根据等级资料研究2个变量间相关关系的方法,依据2列成对等级的各对等级数之差来进行计算,利用单调方程评价2个统计变量的相关性。上述3种方法的相关性指标或相关系数为-1~1:绝对值越接近1,相关性越高;绝对值等于0时,不具备相关性。灰关联分析是一种分析系统中各因子关联程度的量化方法,根据不同变量序列间发展趋势的相似或相异程度,衡量因素间关联程度。灰色关联度小于0.6时,不具有相关性;灰色关联度越趋近1,相关性程度越高。
1.2 BP神经网络
BP神经网络是一个利用误差反向传播算法进行训练的多层前馈神经网络,一般包括输入层、隐含层、输出层3部分。输入层具有信息接入即信号接收功能,信号接收完成后将信息传递到隐含层,输入层神经元的个数为输入影响因子的数量n;隐含层负责信息处理、信息变换,隐含层神经元的个数为m,小于N-1(N是训练样本数),在MATLAB中经测试取值;经隐含层后信息传递到输出层,输出层将结果对外输出,1个3层的典型网络结构见图1。
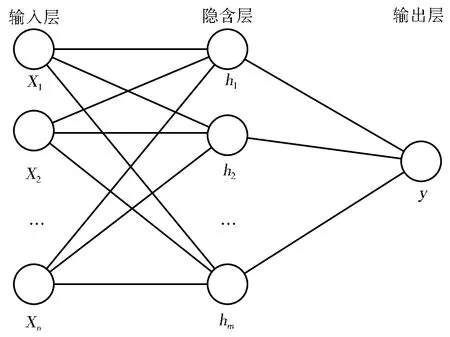
图1 BP神经网络模型结构
神经网络结构参数设置有:最大训练次数=100,训练要求精度=1×10⁻⁸,学习率=0.01。参数设置完成后,网络利用误差的反向传播自动调整权重和阈值,驱使BP神经网络中表达函数能够得到最优解,最后输出预测结果及评判结果的各项指标值。
1.3 预测结果评判标准
以R2(决定系数)、ERMS(均方根误差)、EMA(平均绝对误差)为评判标准对预测结果的优劣进行评判,R2越趋近1,ERMS和EMA越趋近0,说明预测精度越高。
2 研究区概况
胶东调水工程是山东省水利建设的重要组成部分,包括引黄调水工程和引黄济青工程2条输水线路。引黄济青工程于1986年4月15日开工兴建,1989年11月25日正式通水;引黄调水工程于2003年12月19日开工,2013年7月全线贯通,2013年12月主体工程建成通水。其中,引黄调水工程包括明渠段和管道段两部分,明渠段以宋庄分水闸为起点,以黄水河泵站为终点,途经灰埠、东宋、辛庄3座泵站及若干倒虹吸、渡槽等输水建筑物,全长约160 km。本文所选研究区为引黄调水工程明渠段,具体研究区域为东宋泵站前后,其上游控制节点为灰埠泵站,下游控制节点为埠上节制闸,该渠段及沿线建筑物分布情况见图2。

图2 研究渠段及沿线建筑物分布
3 结果与讨论
3.1 影响因子识别结果
研究东宋泵站未来时刻的前池水位时,考虑到水位流量间关系及人为因素影响,除选取相邻断面水位作为影响因子外,还选取东宋泵站流量、灰埠泵站流量、灰埠-东宋2级泵站流量差为影响因子进行预测,且影响因子均为当前时刻的影响因子。表1为不同方法下的各因子与前池水位间的相关性分析结果。

表1 影响因子相关性分析结果
由表1可知,影响因子相关性排序从高到低依次为东宋泵站站前水位、2级泵站流量差、海郑河倒虹下游水位、海郑河倒虹上游水位、泵站流量、东宋泵站流量及上游泵站流量。前4项影响因子的各系数均为0.8~0.9,识别为相关性较高的影响因子,建模时优先考虑;后3项影响因子的指标中仅灰色关联度表明其相关性程度较高,故识别为相关性较低的影响因子,建模时可考虑在内,但不重点考虑。
3.2 水位预测结果分析
利用BP神经网络模型进行泵站前池水位预测,预测结果从时间序列、影响因子2个方面进行分析。
3.2.1时间序列
将不同时间尺度的数据按照一定的比例进行训练和验证,对比训练时长和预测精度。结果表明,训练期和预见期的最优比例为7∶3,减小该比例会使预测精度降低,增大该比例预测精度与之相差无几,且数据需求量大幅提升。
采用3 600个数据预测未来2 h的水位变化,7∶3比例下的R2、ERMS、EMA分别维持在0.95、0.04、0.03左右。增大该比例时各指标预测效果略有提高,但相差不大,高于5∶1时其预测精度基本不提高。具体对比见图3和图4。

图3 未来2 h水位预测结果(7∶3)
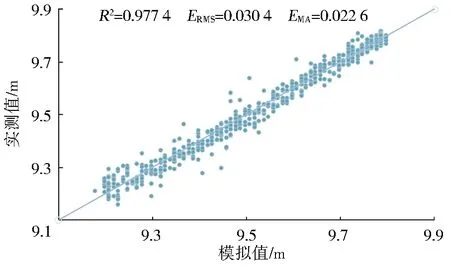
图4 未来2 h水位预测结果(5∶1)
以7∶3的比例分别对3组3个月的数据进行训练和验证,R2维持在0.93~0.98,ERMS维持在0.02~0.05、EMA维持在0.02~0.04,预测结果见图5。
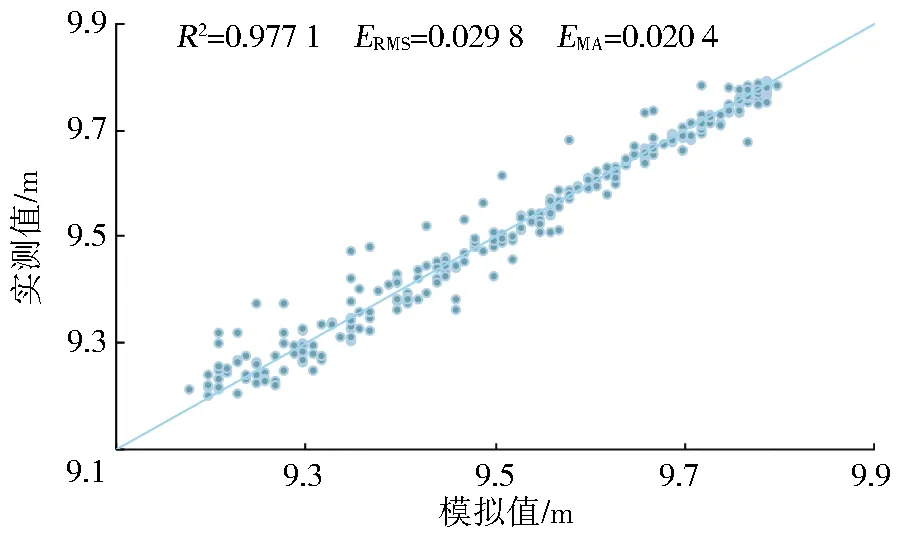
图5 未来2 h水位预测结果(7∶3)
以7∶3的比例对1个月的数据进行验证,验证结果表明该比例对1个月的数据量依旧适用,具体见图6。
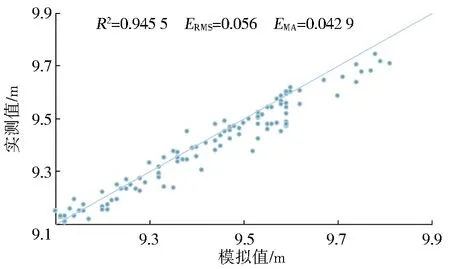
图6 未来2 h水位预测结果(7∶3)
由上述可知,最优比例适用于不同时间尺度的数据,且最优比例的确定既可节省神经网络学习的时间,又能提高预测精度,在模型中具有较大影响力。
3.2.2影响因子
影响因子数量。当影响因子与预测因子之间都具有较高相关性时,影响因子数量越多,预测结果越精确。但影响因子的数量会增加训练期的数据需求量,为减少数据需求量且保证预测精度,利用不同数量的影响因子进行训练和验证,验证结果表明:短期(1~3个月)内至少选择3~5个影响因子进行训练,3个月至1 a的数据量则至少需要5~7个相关性最大的影响因子。
影响因子种类。研究表明,选取相关性最高的影响因子构建模型,预测精度更高。由影响因子相关性分析结果可知,相关性最高的3个影响因子为泵站当前时刻的水位、上游相邻节点的水位、流量差。采用3个影响因子对1个月的数据进行训练和预测,上述3个影响因子的预测效果最佳,具体见图7。
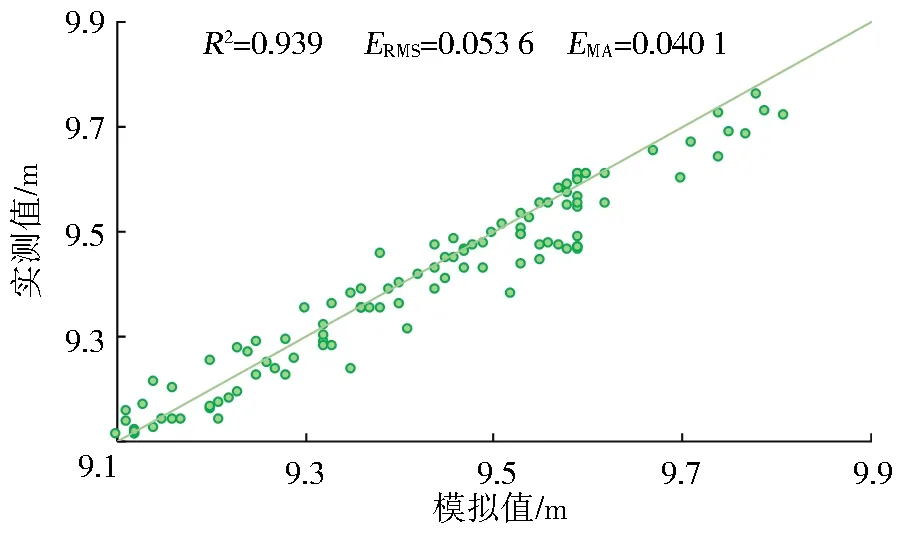
图7 3个因子水位预测结果(7∶3)
影响因子的时间间隔。数据间隔均为2 h时,对东宋泵站未来时刻的水位进行预测:未来2 h的水位预测结果较稳定,R2结果均在0.9以上,ERMS和EMA也较小;未来4 h的水位预测结果一般,R2为0.8~0.9,ERMS和EMA比2 h预测略大;未来6 h的水位预测结果较差,R2不稳定且变化区间较大,结果较好时也仅为0.7左右,ERMS和EMA则预测结果偏大,分别在0.11和0.09左右。即训练期内数据不发生改变时,预测时间越长,预测精度越低。对3个月的数据进行筛选,使2 h间隔转为4 h间隔,并预测东宋泵站未来4 h的水位,预测结果见图8。

图8 未来4 h水位变化结果(7∶3)
对10个月的数据进行4 h间隔的筛选并预测未来4 h水位,预测结果见图9。

图9 未来4 h水位变化结果(7∶3)
研究结果表明,与采用2 h间隔的数据直接预测相比,采用4 h间隔的数据预测泵站未来4 h的水位,其预测精度更高,R2变化基本维持在0.82~0.93,ERMS和EMA分别维持在0.05~0.06、0.04~0.05。
对1 a的数据进行筛选,使2 h间隔转为6 h间隔,并预测东宋泵站未来6 h的水位。预测结果表明,筛选后进行预测比用2 h的数据直接预测其预测效果更差。经分析,上述现象是由6 h的时间间隔太长不能完全反映各因子变化规律导致,所以筛选后进行预测的结果比直接采用2 h间隔的数据进行预测结果更差。
4 结 论
时间序列比例对水位预测结果的影响:训练期和预测期的最佳比例为7∶3,提高比例其预测精度无明显变化,降低比例则预测效果变差。
影响因子对预测结果的影响:数据量与影响因子数量呈对应关系,3个月的数据量需3~5个影响因子进行训练,3个月至1 a的数据量则需5~7个影响因子确保相同预测效果。
数据的时间间隔对预测结果的影响:一般情况下,数据间隔不变,预测精度随预测时间的增加而逐渐降低;但当数据能够反映各因子变化规律时,数据间隔和预测时间相同,预测效果更佳。
Prediction model for forebay water level of pumping stations with different time scales based on BP neural networks
XUE Ping1,ZHANG Zhao2,LEI Xiaohui2,LU Longbin1,YAN Peiru3,LI Yueqiang4
(1.School of Water Conservancy and Environment,University of Jinan,Jinan 250022,China;2.Institute of Water Resources,China Institute of Water Resources and Hydropower Research,Beijing 100038,China;3.School of Civil Engineering,Tianjin University,Tianjin 300072,China;4.College of Water Conservancy and Hydropower Engineering,Hohai University,Nanjing 210098,China)
Abstract:Considering the difficulty in water level prediction under building control,a water level prediction model for the forebay of a pumping station was built on the basis of back-propagation(BP)neural networks,and the influence of time series and impact factors on the accuracy of water level prediction was analyzed under different time scales.The constructed model was applied to the Dongsong Pumping Station of the Jiaodong Water Transfer Project.The research results revealed that:when the total amount of data was fixed,and the ratio of the training period to the prediction period was 7∶3,the prediction result was good;a larger amount of data was accompanied by a greater number of positively correlated impact factors required for certain prediction accuracy;in a short period of time,when the prediction time interval was the same as the time interval of the data itself,the prediction effect was better.The constructed model can meet the demand for dynamic prediction of the water level in the forebay of the open channel water transfer project and can achieve the 2 h accurate prediction of the forebay water level of the pumping station and the 4 h general accurate prediction.Additionally,it can be popularized and applied in other similar open channel water transfer projects.
Keywords:forebay of pump station;water level prediction;BP neural network;time series;proportion
Received:2021-07-04Revised:2021-09-30Onlinepublishing:2021-10-11
Onlinepublishingaddress:https://kns.cnki.net/kcms/detail/13.1430.TV.20211009.1638.002.html
Fund:National Natural Science Foundation of China(51779268)
Author′sbrief:XUE Ping(1998-),female,Weifang Shandong Province,mainly engaged in research on hydrology and water resources.E-mail:2857487127@qq.com
Correspondingauthor:LEI Xiaohui(1974-),male,Weinan Shaanxi Province,Ph.D.,professor-level senior engineer,mainly engaged in research on hydrology and water resources,reservoir dispatching,and hydraulic control.E-mail:lxh@iwhr.com
DOI:10.13476/j.cnki.nsbdqk.2022.0040
For the long-distance water dispatching of an open channel water transfer project,hydraulic structures such as pumping stations,control gates,and inverted siphons are generally set up in the channel to relieve the influence of terrain conditions on water transfer restrictions.Meanwhile,monitoring equipment such as water level meters and flow meters are installed in front of buildings to obtain water information and monitor water safety.Compared with real-time water level monitoring,high-precision water level prediction can provide more scientific guidance for dispatchers in the process of water dispatching,especially the water level prediction in the forebay of pumping stations,which is of great significance to the regulation of pumping stations,water dispatching,and channel safety.Affected by various factors such as climate,temperature,and human activities,the hydrological sequence collected by monitoring equipment often presents the characteristics of nonlinearity and uncertainty,and it is difficult to analyze the laws and predict the trend by conventional methods.Scholars[1-3]have built hydraulic models to simulate the changing process of channel water flow,but the modeling requires complete and accurate topographic data,engineering parameters,and measured data;moreover,the calibration process of the roughness rate is also repetitive and cumbersome[4],and thus there are huge limitations.With the continuous progress of artificial intelligence technology and machine learning methods,the data-driven methods used for the prediction can avoid many requirements and limitations of hydraulic modeling and directly explore the inherent laws between data[5].
Up to now,most scholars[6-9]have built neural network models for water level prediction,such as the optimized RBF neural network,LSTM neural network model,and wavelet neural network applied in groundwater level prediction,with high prediction accuracy and an excellent prediction effect.Although the relevance vector machine(RVM)prediction model[10],Mike model[11],similarity model[12],statistical model[13],and Bayesian model[14]can be constructed for water level prediction,their applications are limited to a certain extant,and hence they are not widely used in water level prediction for water transfer projects.As the neural network has been commonly used in water level prediction,and its development has gradually matured,many scholars[15-26]have made water level predictions by combining neural network models and algorithms or improving algorithms.For instance,Wu et al.[27]combined KNN,GA,and BP to predict the flood level of the Qinhuai River,and compared with the neural network model without combination,the combined method has higher prediction accuracy but is slightly more complicated.In other words,the uncombined neural network models are simple and practical.For example,Gao et al.[28]used the BP neural network to predict the water level in front of the pumping station and found that the BP neural network has great advantages in solving nonlinear problems and has significant potential in intelligent prediction.In addition,the commonly used evaluation indicators include the root mean square error(ERMS)and determination coefficient(R2)[29].
In summary,it is a feasible research method to construct a neural network for water level prediction.Moreover,intelligent algorithms such as artificial neural networks have certain applicability conditions in hydrological prediction applications.For example,ANN has a strong nonlinear ability,but due to its simple structure,previous information can not be saved,and time series data can not be learned.RNN can retain the water level prediction at the previous moment and can effectively process sequence data,but there are defects in gradient transfer.LSTM has long and short-term memory functions and can solve gradient disappearance and gradient explosion to a certain extent,but there are still problems in long sequences,and it can not be parallelized.Restricted by the one-way flow of information,the classical BP neural network considers a limited amount of historical information and is only suitable for short-term prediction,but it has a stable structure and features versatility and simplicity,which can flexibly deal with nonlinear problems,achieve high prediction accuracy,and has strong nonlinear mapping ability.As the hydrological sequence in hydrological forecasting is greatly affected by human factors and presents a prominent nonlinear characteristic,and the BP neural network is suitable for hydrological forecasting.Since BP neural network was proposed by Rumelhart et al.[30]in 1986,it has been widely used in research on hydrological prediction.In this paper,a BP neural network was established.We used historical data to predict the water level in the forebay of the pumping station and analyzed the influence of the time series proportion and impact factors on the water level prediction.The research results can provide a new method for water level prediction and reference data for the changing trend of the water level in the forebay of the pumping station.
1 Research method
The water level in the forebay of the pumping station is selected as the research object.The impact factors are determined by correlation analysis and are used as the input to construct the BP neural network model,and then the prediction results are judged by the parameters of each indicator.
1.1 Impact factor identification
Under the influence of various hydraulic factors(section area,hydraulic gradient,roughness,etc.),there is a corresponding relationship between the section flow and the water level in the channel.As one of the monitoring sections,the water level in the forebay of the pumping station may have a hydraulic connection with the water level of the adjacent section,the flow of the pumping station,the upstream flow,and the flow difference.Taking these relevant water levels and flow as variables,we conduct a correlation analysis of each variable and the predictor,and the impact factors with a certain degree of correlation are identified.
The impact factor identification methods adopted include Pearson′s correlation coefficient,Kendall′s correlation coefficient,Spearman′s rank correlation coefficient,and grey relational analysis(GRA).Pearson′s correlation coefficient is used to measure the degree of correlation between two variables,and Pearson′s correlation coefficient between two variables is defined as the quotient of the covariance and standard deviation between the two variables.Kendall′s correlation coefficient is a method to represent the degree of correlation of multi-column rank variables.Ifnsimilar statistical objects are sorted by a specific attribute,other attributes are usually out of order,and the ratio of the difference between same-order pairs and out-of-order pairs to the total number of pairs[n(n-1)/2]is defined as Kendall′s coefficient.Spearman′s rank correlation coefficient is a method to study the correlation between two variables according to the rank data;in other words,it is calculated according to the rank difference between each pair of two-column paired ranks,and the monotone equation is used to evaluate the correlation of the two statistical variables.The range of the correlation indicator or correlation coefficient of the above three methods is from-1 to 1:When the absolute value of the correlation coefficient is closer to 1,the correlation is higher;when it is equal to zero,there is no correlation.GRA is a quantitative method for analyzing the correlation degree of each factor in the system,which measures the degree of correlation between factors according to the degree of similarity or dissimilarity in development trends among different variable sequences.When GRA is less than 0.6,it is considered that there is no correlation,and when it is closer to 1,the correlation degree is higher.
1.2 BP neural networks
A BP neural network is a multilayer feedforward neural network trained by an error back-propagation algorithm,generally including the input layer,hidden layer,and output layer.The input layer has the function of information access,i.e.,signal reception.When the signal reception is completed,the information is transmitted to the hidden layer,and the number of neurons in the input layer is the numbernof input impact factors.The hidden layer is responsible for information processing and information transformation,and the number of neurons in the hidden layer ism,which is less thanN-1(Nis the number of training samples),whose value is tested in MATLAB.Then,the information is transmitted from the hidden layer to the output layer,and the output layer outputs the results.The typical structure of a three-layer network is shown in Fig.1.

Fig.1 BP neural network model structure
The neural network structure parameters are set as follows:maximum training times=100;required accuracy of training=1×10⁻⁸;learning rate=0.01.Upon the parameter setting,the network automatically adjusts the weights and thresholds by the back-propagation of errors,which drives the expression function in the BP neural network to obtain the optimal solution,and finally,it outputs the prediction results and the indicator values of the evaluation results.
1.3 Evaluation criteria of prediction results
R2,ERMS,and the mean absolute error(EMA)are used as the evaluation criteria to judge the strengths and weaknesses of the prediction results.WhenR2is closer to 1,andERMSandEMAare closer to zero,the prediction accuracy is higher.
2 Overview of study area
The Jiaodong Water Transfer Project is an important part of the water conservancy construction in Shandong Province,including two water transmission lines:the Yellow River Transfer Project and the Water Transfer Project from the Yellow River to Qingdao.The latter started on April 15,1986,and it was officially put into operation on November 25,1989;the Yellow River Water Transfer Project started on December 19,2003,and the whole line was completed in July 2013,with the main project put into operation in December.The Yellow River Transfer Project includes two parts:the open channel section and the pipeline section.The open channel section starts from the Songzhuang Transfer Gate and terminates at the Huangshuihe Pumping Station,passing through three pumping stations in Huibu,Dongsong,and Xinzhuang,several inverted siphons,aqueducts,and other water transfer structures,with a total length of about 160 km.The study area selected in this paper is the open channel section of the Yellow River Water Transfer Project.Specifically,the study area is around the Dongsong Pumping Station,with the upstream control node as the Huibu Pumping Station and the downstream control node as the control gate on the port.The building distribution of this section and buildings along the line are shown in Fig.2.

Fig.2 Canal section and building along the distribution
3 Results and discussion
3.1 Identification results of impact factors
The relationship between the water level and flow rate and the influence of human factors were considered when studying the water level in the forebay of the Dongsong Pumping Station in the future.In addition to the water level of the adjacent section,the flow of the Dongsong Pumping Station,the flow of the Huibu Pumping Station,and the flow difference between the two pumping stations were also selected as the impact factors for prediction.The impact factors are all the impact factors at the current time.Tab.1 shows the correlation analysis results between each factor and the water level of the forebay under different methods.

Tab.1 Correlation analysis of impact factors
It can be seen from Tab.1 that the order of the correlation of impact factors from high to low is the water level in front of the Dongsong Pumping Station,the flow difference of the two pumping stations,downstream water level of the Haizheng River inverted siphon,upstream water level of the Haizheng River inverted siphon,the flow of the pumping station,flow of the Dongsong Pumping Station,and upstream flow of the pumping station.The coefficients of the first four impact factors are all between 0.8 and 0.9,which are identified as impact factors with a high correlation and are given priority when modeling.Considering the indicators of the last three impact factors,only GRA indicates that the degree of correlation is high,and thus they are identified as impact factors with a low correlation,which can be considered in modeling but are not importantly considered.
3.2 Analysis of water level prediction results
The BP neural network model was used to predict the water level in the forebay of pumping stations,and the prediction results were analyzed from the aspects of time series and impact factors.
3.2.1Timeseries
The data of different time scales were trained and verified according to a certain proportion,and the training duration and prediction accuracy were compared.The results indicate that the optimal ratio of the training period to the prediction period is 7∶3.Reducing the ratio will lessen the prediction accuracy,while increasing the ratio almost does not change the prediction accuracy,and the required data volume is significantly raised.
We used 3 600 data to predict the water level change in the next two hours,andR2,ERMS,andEMAat the ratio of 7∶3 were maintained at about 0.95,0.04,and 0.03,respectively.When the ratio was increased,the prediction effect of each indicator was slightly improved,but the difference was not large;when the ratio was higher than 5∶1,the prediction accuracy basically would not see a rise.The specific comparison is shown in Fig.3 and Fig.4.
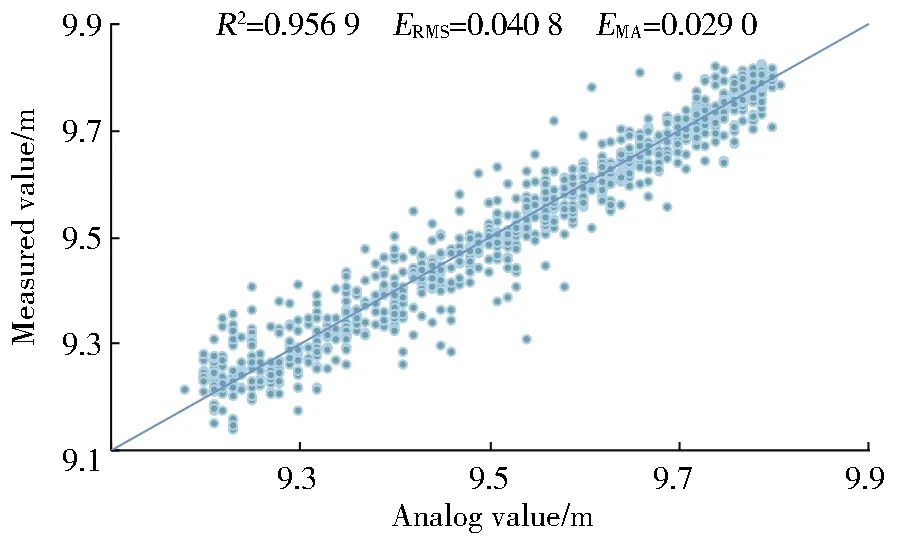
Fig.3 The result of water level forecast in the next 2 h(7∶3)
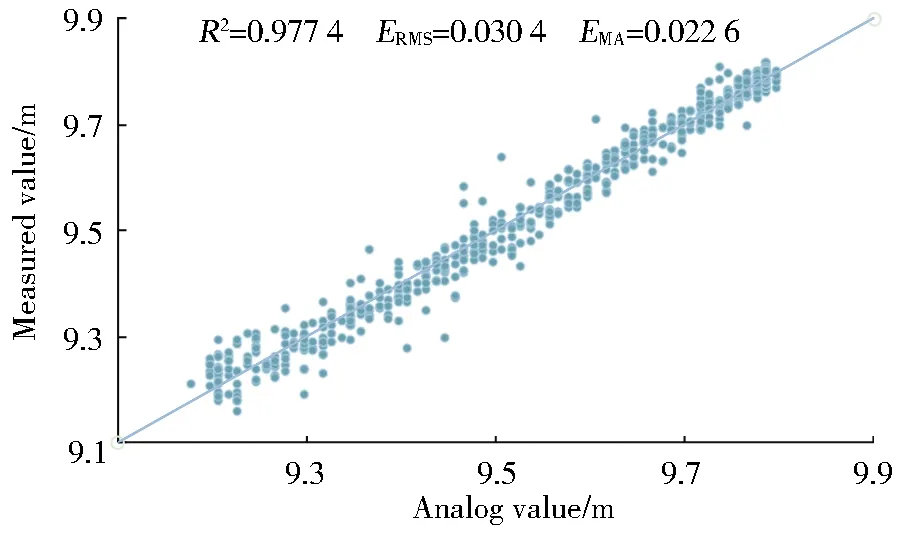
Fig.4 The result of water level forecast in the next 2 h(5∶1)
Three groups of three-month data were trained and validated at a ratio of 7∶3.R2was maintained at 0.93-0.98,ERMSat 0.02-0.05,andEMAat 0.02-0.04.The prediction results are shown in Fig.5.
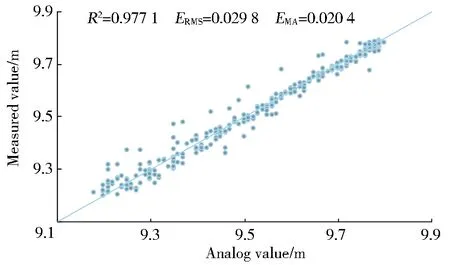
Fig.5 The result of water forecast change in the next 2 h(7∶3)
The data of one month was verified at a ratio of 7∶3,and the verification results indicated that the ratio could still be applied to the amount of data of one month,as shown in Fig.6.
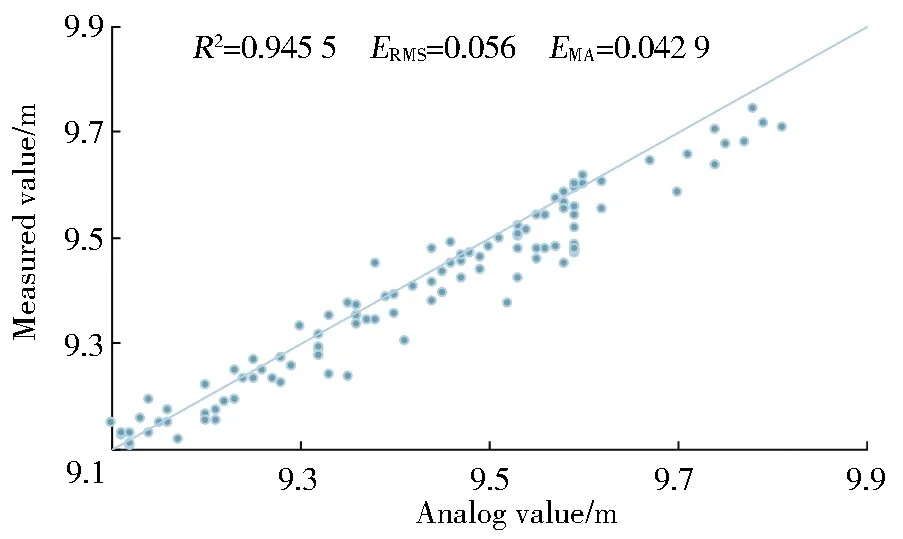
Fig.6 The result of water level forecast in the next 2 h(7∶3)
It can be seen from the above that the optimal ratio is suitable for data of different time scales,and the determination of the optimal ratio can not only save the learning time of the neural network but also improve the prediction accuracy,which has a great influence on the model.
3.2.2Impactfactors
The number of impact factors.When there is a high correlation between impact factors and predictors,a higher number of impact factors leads to more accurate prediction results.However,the increase in the number of impact factors can elevate the data demand during the training period.Therefore,to reduce the data demand and ensure prediction accuracy,we employed different numbers of impact factors for training and verification.The verification results revealed that at least three to five impact factors should be selected for training in the short term(one to three months),and at least five to seven impact factors with the greatest correlation were required for the data volume of three months to a year.
Types of impact factors.Studies have shown that higher prediction accuracy can be achieved when the most relevant impact factors are selected for modeling.According to the correlation analysis results of the impact factors,the three impact factors with the highest correlation are the water level of the pumping station at the current moment,the water level of the upstream adjacent nodes,and the flow difference.Three impact factors were applied to train and predict data of one month,and the above three impact factors registered the best prediction effect,as shown in Fig.7.

Fig.7 3-factor water level prediction result map(7∶3)
The time interval of the impact factors.When the data interval was 2 h,the water level of the Dongsong Pumping Station in the future was predicted:The water level prediction results in the next two hours were relatively stable,withR2greater than 0.9 and smallERMSandEMA;the prediction results of water levels in the next four hours were general,withR2of 0.8-0.9 andERMSandEMAslightly larger than those predicted in two hours;the prediction results of the water level in the next six hours were poor:R2was unstable and had a large variation range,and it was only about 0.7 when the results were good,whileERMSandEMAwere overly great.In other words,when the data does not change during the training period,a longer prediction time is accompanied by lower prediction accuracy.The three-month data were screened to change the interval from 2 h to 4 h,and the water level of the Dongsong Pumping Station in the next 4 h was predicted.The prediction results are shown in Fig.8.

Fig.8 The result of water level change in the next 4 h(7∶3)
The ten-month data were screened at an interval of 4 h,and the water level in the next 4 h was predicted.The prediction results are shown in Fig.9.

Fig.9 The result of water level change in the next 4 h(7∶3)
The research results demonstrate that compared with the direct prediction using the data at an interval of 2 h,the prediction using the data at an interval of 4 h registers higher accuracy in predicting the water level of the pumping station in the next 4 h,withR2,ERMS,andEMAin the range of 0.82-0.93,0.05-0.06,and 0.04-0.05,respectively.
The one-year data were screened to convert the interval from 2 h to 6 h,and the water level of the Dongsong Pumping Station in the next 6 h was predicted.The prediction results show that the prediction effect after screening is worse than that of the direct prediction using data at an interval of 2 h.Upon analysis,the above phenomenon is caused by the overly long interval of 6 h,which can not fully reflect the changing laws of each factor.Therefore,the prediction result after screening is worse than that using the data at an interval of 2 h directly.
4 Conclusion
The influence of the time series ratio on the water level prediction results:The optimal ratio of the training period to the prediction period is 7∶3,and the increase in the ratio cannot significantly change the prediction accuracy,while the decrease in the ratio can lead to a worse prediction effect.
The effect of impact factors on the prediction results:The amount of data corresponds to the number of impact factors.The data volume of three months requires three to five impact factors for training,and the data volume of three months to a year requires five to seven impact factors to ensure the same prediction effect.
The influence of the data interval on the prediction results:In general,when the data interval remains unchanged,the prediction accuracy gradually decreases with the increase in the prediction time,but when the data can reflect the changing laws of each factor,the data interval and the prediction time are the same,and the prediction effect is better.
