Asthma mortality among children and adolescents in China,2008–2018
2022-11-08ingTingLiuJinLeiQiJuiYnQiGaoWeiXuJingJingQiaoPengiYnMaiGengZhouKunLingShen
ing-Ting Liu · Jin-Lei Qi ·T Ju iYn · Qi Gao · Wei Xu · Jing-Jing Qiao · Peng iYn · Mai-Geng Zhou ·Kun-Ling Shen
Keywords Adolescent · Asthma · Child · China · Mortality
tInroduction
Asthma is the most common chronic respiratory disease in childhood [ 1], while asthma mortality in children is usually considered rare. Asthma mortality varies widely by age and disease severity as well as among countries and certain populations. Published data indicate that the mortality rate of children and adolescents with asthma ranged from 0.0 to 0.7/100,000 worldwide [ 2— 5]. Childhood asthma mortality rate has decreased worldwide during the past 25 years,which is largely attributed to increased use of inhaled corticosteroids [ 1]. However, reports on the national asthma mortality among Chinese children and adolescents are lacking.This is the f irst report on asthma mortality among Chinese children and adolescents from 2008 to 2018 by analyzing the data from China’s Disease Surveillance Points (DSPs)System.
Methods
Data sources
This was a descriptive study. Data were collected from the DSPs system [ 6— 8]. The DSPs system was f irst established by the Chinese central government in 1978, and data are collected under the direction of the Chinese Center for Disease Control and Prevention (CDC). Each surveillance point represents a single district (urban area) or county(rural area), and all residents of that geographic area are covered by the DSPs system. From 2004 to 2012, the DSPs system was expanded to 161 monitoring points (64 urban,97 rural), covering 6—8% of the population across 31 provinces, and a nationally representative dataset was created[ 6, 9]. In 2013, DSPs were integrated with the cause of death statistics system to establish a national cause of death monitoring system, and the number of surveillance points was increased to 605. The total monitored population accounted for approximately 24% of the country [ 10].
Each monitoring point collects information from the resident death medical certif icate f iled for all deaths in medical institutions, homes, or other places within its jurisdiction. All causes of death in DSPs are determined according to a standard protocol by trained coders located in hospitals or local CDC offi ces. Since 2004, coding has been conducted using ICD-10 codes. Duplicate deaths are identif ied and eliminated as part of routine processing operations at the provincial and county levels. An internal procedural check system evaluates timeliness, completeness, and accuracy of data reporting, and statistical measures are employed to monitor data quality [ 11]. In addition, a f ixed national sample survey is conducted every three years at all DSPs sites to obtain extra information that permits adjustment for underreporting [ 12]. Previous studies have shown that the DSPs data are generally reliable, valid, and nationally representative [ 13].
Statistical analysis
All asthma-related deaths among children and adolescents aged 0—19 years occurring in DSPs across China from 2008 to 2018 were included in our study. The number of asthma deaths and population monitored by DSPs were extracted and stratif ied by age group (0—< 1 year old, 1—4 years old, 5—9 years old, 10—14 years old, and 15—19 years old), gender (male and female), region (Eastern China, Central China, and Western China), and residence (urban and rural). According to the National Bureau of Statistics and the f irst national economic census, China is divided into three regions [ 14], the eastern region includes Beijing, Tianjin, Hebei, Liaoning, Shanghai,Jiangsu, Zhejiang, Fujian, Shandong, Guangdong, and Hainan; the central region includes Shanxi, Jilin, Heilongjiang, Anhui, Jiangxi, Henan, Hubei, and Hunan; and the western region includes inner Mongolia, Guangxi,Chongqing, Sichuan, Guizhou, Yunnan, Tibet, Shaanxi,Gansu, Qinghai, Ningxia, and Xinjiang. Data compilation and statistical analyses were conducted in SAS 9.3 (SAS Institute, Inc., USA) and SPSS Statistics (version 26.0;IBM Corp.).
The asthma deaths were specif ied as the outcome variable, cross-classif ied by year, age group, gender, region, residence, and DSPs. These data were used as input to Poisson regression for the assessment of signif icance of trends. Multilevel Poisson regression models were used to compute the total, age-, gender-, region- and residence-specif ic asthma mortality rates during the study period (2008—2018). Separate models that included year, age group, gender, region,residence, and all interactions of these covariates as predictors provide a model-based estimate of mortality rate for each combination of year, age group, gender, region,residence. Models for calculating trends in mortality rates included year (continuous variable) and age group, gender,region, and residence (categorical variable). Separate models that included years and other predictors (age group, gender, region, and residence), and interaction terms were used to test the interaction between years and predictors in the regression models. Rate ratios (RR) with 95% conf idence intervals (CI) of a Poisson regression model of the annual change in rate were reported using the f irst year as the reference point. In describing trends, the terms “increase” and“decrease” were used when the slope of the trend was statistically signif icant; otherwise, the term “stable” was used.Statistical signif icance was assessed at the 0.05 level, and all hypothesis tests were two-sided.
Considering the hierarchical structure of the observed data, multilevel Poisson regression models were used to investigate for potential variation across DSPs surveillance points. The median rate ratio (MRR) was selected to estimate geographic variation between points of the DSPs, which was def ined as the median value of the RR between the point at highest risk and the point at lowest risk when randomly picking out two points. A MRR equal to 1 suggests no geographic variation in the outcome variable, whereas values above 1 indicate geographic variation[ 15]. Proportional change in variance (PCV) was used to explain the contributions of variables entered into models,compared with the reference model. The equation for PCV is: PCV = (Vr - Vc)/Vr, where Vr is the variance in the Model 1 and Vc is the variance in the model with variables entered [ 16]. All f ixed eff ect parameters were exponentiated and expressed as RRs with 95% CIs. The multilevel Poisson regression models were conducted in MLwiN v2.30 [ 17].
National age-specif ic population data were obtained from the National Bureau of Statistics of China [ 18] ( http:// www.stats. gov. cn/ tjsj/ ndsj/ ). The mortality rates multiplied by corresponding population were calculated as the estimated asthma deaths from 2008 to 2018.
Results
The asthma mortality among children and adolescents in China ranged from 0.020 (0.009, 0.045) per 100,000 to 0.059 (0.025, 0.137) per 100,000 between 2008 and 2018(Table 1). Asthma mortality rates among children and adolescents in China, by age group, gender, region and residence, are presented in Tables 1 and 2 .
The total asthma mortality rate among children and adolescents showed a significantly overall downward trend from 2008 to 2018 (RR = 0.909, 95% CI 0.854,0.968). Significant decreases were observed in both males (RR = 0.908, 95% CI 0.838, 0.984) and females(RR = 0.904, 95% CI 0.820, 0.997). The trends of mortality diff ered in diff erent age groups. The decreasing trend among children aged 15—19 years (RR = 0.820, 95% CI 0.729, 0.922) was statistically signif icant. The asthma mortality rate remained stable for children aged 0—< 1,1—4, 5—9, and 10—14 years. Grouped by region, a signif icant decrease was observed in Central China (RR = 0.827,95% CI 0.737, 0.928), whereas asthma mortality rate remained stable in Eastern and Western China. Grouped by residence, a signif icant decrease was observed in rural(RR = 0.902, 95% CI 0.834, 0.976), especially in males(RR = 0.902, 95% CI 0.820, 0.993), but the rate in urban did not change signif icantly (Table 3). Trends of asthma mortality among Chinese children and adolescents from 2008 to 2018 are shown in Table 3. Trends of asthma mortality rates among children and adolescents of diff erent genders in China during the study period (2008—2018) are illustrated in Fig. 1.
Asthma mortality rates were lower among children aged 1—4 years (RR 0.490, 95% CI 0.256, 0.935), 5—9 years(RR 0.236, 95% CI 0.116, 0.482), 10—14 years (RR 0.445,95% CI 0.233, 0.849), and 15—19 years (RR 0.364, 95% CI 0.192, 0.691) compared with children aged 0—< 1 year in model 3. No statistical diff erences were found for mortality between males and females. Asthma mortality rate was higher in western China (RR 2.356, 95% CI 1.513—3.669).No statistical diff erences were found for mortality between urban and rural. Analysis of the geographic variation showed a ninefold median diff erence in asthma mortality rates among DSPs points (MRR 9.88). About 14.64%of the DSP-level variation in asthma mortality rates was explained by adjustment for geographic region and residence in model 3 (Table 4).
Table 1 Asthma mortality rates among children and adolescents in China, by age group and gender, 2008—2018 (1/100,000)
Data are presented in rates and 95% conf idence intervals. a Multilevel Poisson regression model adjusted for year. b Multilevel Poisson regression model adjusted for year, age group, and year·age group. c Multilevel Poisson regression model adjusted for year, gender, and year·gender
Year Total a Age group b Gender c 0—< 1 1—4 5—9 10—14 15—19 Male Female 2008 0.044 (0.017,0.113)0.000 (0.000,0.000)0.138 (0.012,1.546)0.000 (0.000,0.000)2009 0.059 (0.025,0.137)0.253 (0.016,4.092)0.135 (0.012,1.518)0.150 (0.012,1.799)0.076 (0.007,0.849)0.034 (0.008,0.142)0.050 (0.013,0.187)0.000 (0.000,0.000)2010 0.041 (0.015,0.108)0.758 (0.078,7.378)0.135 (0.012,1.512)0.054 (0.003,0.875)0.202 (0.023,1.761)0.069 (0.021,0.227)0.038 (0.009,0.160)0.055 (0.003,0.903)2011 0.056 (0.023,0.137)0.000 (0.000,0.000)0.073 (0.005,1.185)0.000 (0.000,0.000)0.000 (0.000,0.000)0.059 (0.017,0.204)0.013 (0.002,0.112)0.062 (0.004,1.001)2012 0.051 (0.020,0.131)0.000 (0.000,0.000)0.071 (0.004,1.148)0.182 (0.018,1.808)0.127 (0.013,1.237)0.050 (0.013,0.185)0.055 (0.015,0.206)0.000 (0.000,0.000)2013 0.028 (0.013,0.059)0.230 (0.024,2.236)0.090 (0.010,0.775)0.129 (0.012,1.437)0.191 (0.021,1.738)0.063 (0.018,0.218)0.029 (0.006,0.149)0.028 (0.002,0.307)2014 0.026 (0.012,0.056)0.073 (0.005,1.187)0.070 (0.008,0.631)0.033 (0.003,0.370)0.039 (0.004,0.375)0.032 (0.011,0.094)0.018 (0.005,0.064)0.014 (0.001,0.218)2015 0.025 (0.012,0.054)0.000 (0.000,0.000)0.033 (0.003,0.370)0.051 (0.005,0.494)0.066 (0.008,0.572)0.019 (0.006,0.063)0.030 (0.010,0.091)0.013 (0.001,0.212)2016 0.020 (0.009,0.045)0.000 (0.000,0.000)0.052 (0.005,0.501)0.113 (0.014,0.928)0.052 (0.006,0.472)0.022 (0.007,0.069)0.025 (0.008,0.079)0.067 (0.008,0.579)2017 0.025 (0.012,0.054)0.210 (0.022,2.035)0.034 (0.003,0.375)0.017 (0.001,0.270)0.026 (0.002,0.291)0.025 (0.008,0.078)0.011 (0.003,0.046)0.026 (0.002,0.294)2018 0.023 (0.011,0.035)0.207 (0.021,2.005)0.067 (0.007,0.601)0.097 (0.012,0.821)0.013 (0.001,0.210)0.028 (0.010,0.085)0.018 (0.005,0.062)0.053 (0.003,0.825)0.016 (0.001,0.261)0.013 (-0.005,0.031)0.025 (0.008,0.076)0.018 (0.002,0.034)
Table 2 Asthma mortality rates among children and adolescents in China, by region and residence, 2008—2018 (1/100,000)
Data are presented in rates and 95% conf idence intervals. a Multilevel Poisson regression model adjusted for year, region, and year·region. b Multilevel Poisson regression model adjusted for year, residence, and year·residence
Year Region a Residence b Eastern Central Western Urban Rural 2008 0.016 (0.002, 0.132) 0.070 (0.020, 0.240) 0.039 (0.008, 0.186) 0.018 (0.002, 0.141) 0.053 (0.019, 0.150)2009 0.050 (0.013, 0.193) 0.054 (0.014, 0.210) 0.058 (0.015, 0.226) 0.054 (0.015, 0.201) 0.055 (0.019, 0.153)2010 0.034 (0.007, 0.162) 0.000 (0.000, 0.000) 0.083 (0.024, 0.280) 0.037 (0.008, 0.172) 0.037 (0.011, 0.121)2011 0.036 (0.008, 0.176) 0.057 (0.015, 0.221) 0.062 (0.016, 0.241) 0.075 (0.023, 0.244) 0.040 (0.012, 0.130)2012 0.018 (0.002, 0.149) 0.082 (0.024, 0.277) 0.044 (0.009, 0.211) 0.092 (0.031, 0.275) 0.021 (0.005, 0.098)2013 0.004 (0.001, 0.034) 0.022 (0.006, 0.073) 0.059 (0.023, 0.152) 0.020 (0.006, 0.065) 0.029 (0.012, 0.069)2014 0.021 (0.007, 0.066) 0.016 (0.004, 0.062) 0.035 (0.012, 0.103) 0.029 (0.010, 0.083) 0.021 (0.008, 0.055)2015 0.016 (0.005, 0.054) 0.016 (0.004, 0.061) 0.041 (0.014, 0.114) 0.022 (0.007, 0.066) 0.024 (0.010, 0.060)2016 0.025 (0.008, 0.072) 0.016 (0.004, 0.062) 0.012 (0.002, 0.056) 0.018 (0.006, 0.060) 0.019 (0.007, 0.051)2017 0.012 (0.003, 0.046) 0.016 (0.004, 0.062) 0.046 (0.017, 0.124) 0.032 (0.012, 0.085) 0.019 (0.007, 0.050)2018 0.016 (0.005, 0.054) 0.005 (0.001, 0.043) 0.047 (0.014, 0.079) 0.018 (0.006, 0.059) 0.024 (0.009, 0.039)
Table 3 Trends of asthma mortality among children and adolescents in China, 2008—2018
rate ratio, 95% conf idence interval. * < 0.05 . a Both: multilevel Poisson regression model adjusted for year, age group, gender,region, and residence; male/female: multilevel Poisson regression model adjusted for year, gender, and year·gender. b Both: multilevel Poisson regression model adjusted for year, age group, and year·age group; male/female: multilevel Poisson regression model adjusted for year, age group, gender, and all interactions of these covariates. c Both: multilevel Poisson regression model adjusted for year, region, and year·region;male/female: multilevel Poisson regression model adjusted for year, region, gender, and all interactions of these covariates. d Both: multilevel Poisson regression model adjusted for year, residence, and year·residence; male/female: multilevel Poisson regression model adjusted for year,residence, gender, and all interactions of these covariates
RR (95% CI)Variables Both Male Female Total a 0.909 (0.854, 0.968)* 0.908 (0.838, 0.984)* 0.904 (0.820, 0.997)*Age group (y) b 0—< 1 0.944 (0.785, 1.135) 0.968 (0.803, 1.166) 0.855 (0.655, 1.116)1—4 0.887 (0.781, 1.007) 0.869 (0.751, 1.007) 0.911 (0.780, 1.064)5—9 1.135 (0.921, 1.400) 1.155 (0.933, 1.430) 1.089 (0.854, 1.388)10—14 0.923 (0.814, 1.046) 0.918 (0.798, 1.055) 0.932 (0.797, 1.091)15—19 0.820 (0.729, 0.922)* 0.766 (0.655, 0.897)* 0.868 (0.755, 0.997)*Region c Eastern 0.936 (0.827, 1.059) 0.925 (0.803, 1.065) 0.949 (0.821, 1.098)Central 0.827 (0.737, 0.928)* 0.845 (0.743, 0.959)* 0.787 (0.664, 0.934)*Western 0.948 (0.863, 1.042) 0.953 (0.856, 1.062) 0.941 (0.832, 1.064)Residence d Urban 0.915 (0.826, 1.013) 0.919 (0.818, 1.031) 0.908 (0.795, 1.038)Rural 0.902 (0.834, 0.976)* 0.902 (0.820, 0.993)* 0.901 (0.806, 1.008)
The asthma mortality in 2018 has decreased 47.38% compared to that in 2008. The estimated number of deaths in 2018 has decreased 51.83% compared to that in 2008. The estimated number of deaths in 2009 (188, 95% CI 81,440)was the highest during the years (Table 5, Fig. 2).
Discussion
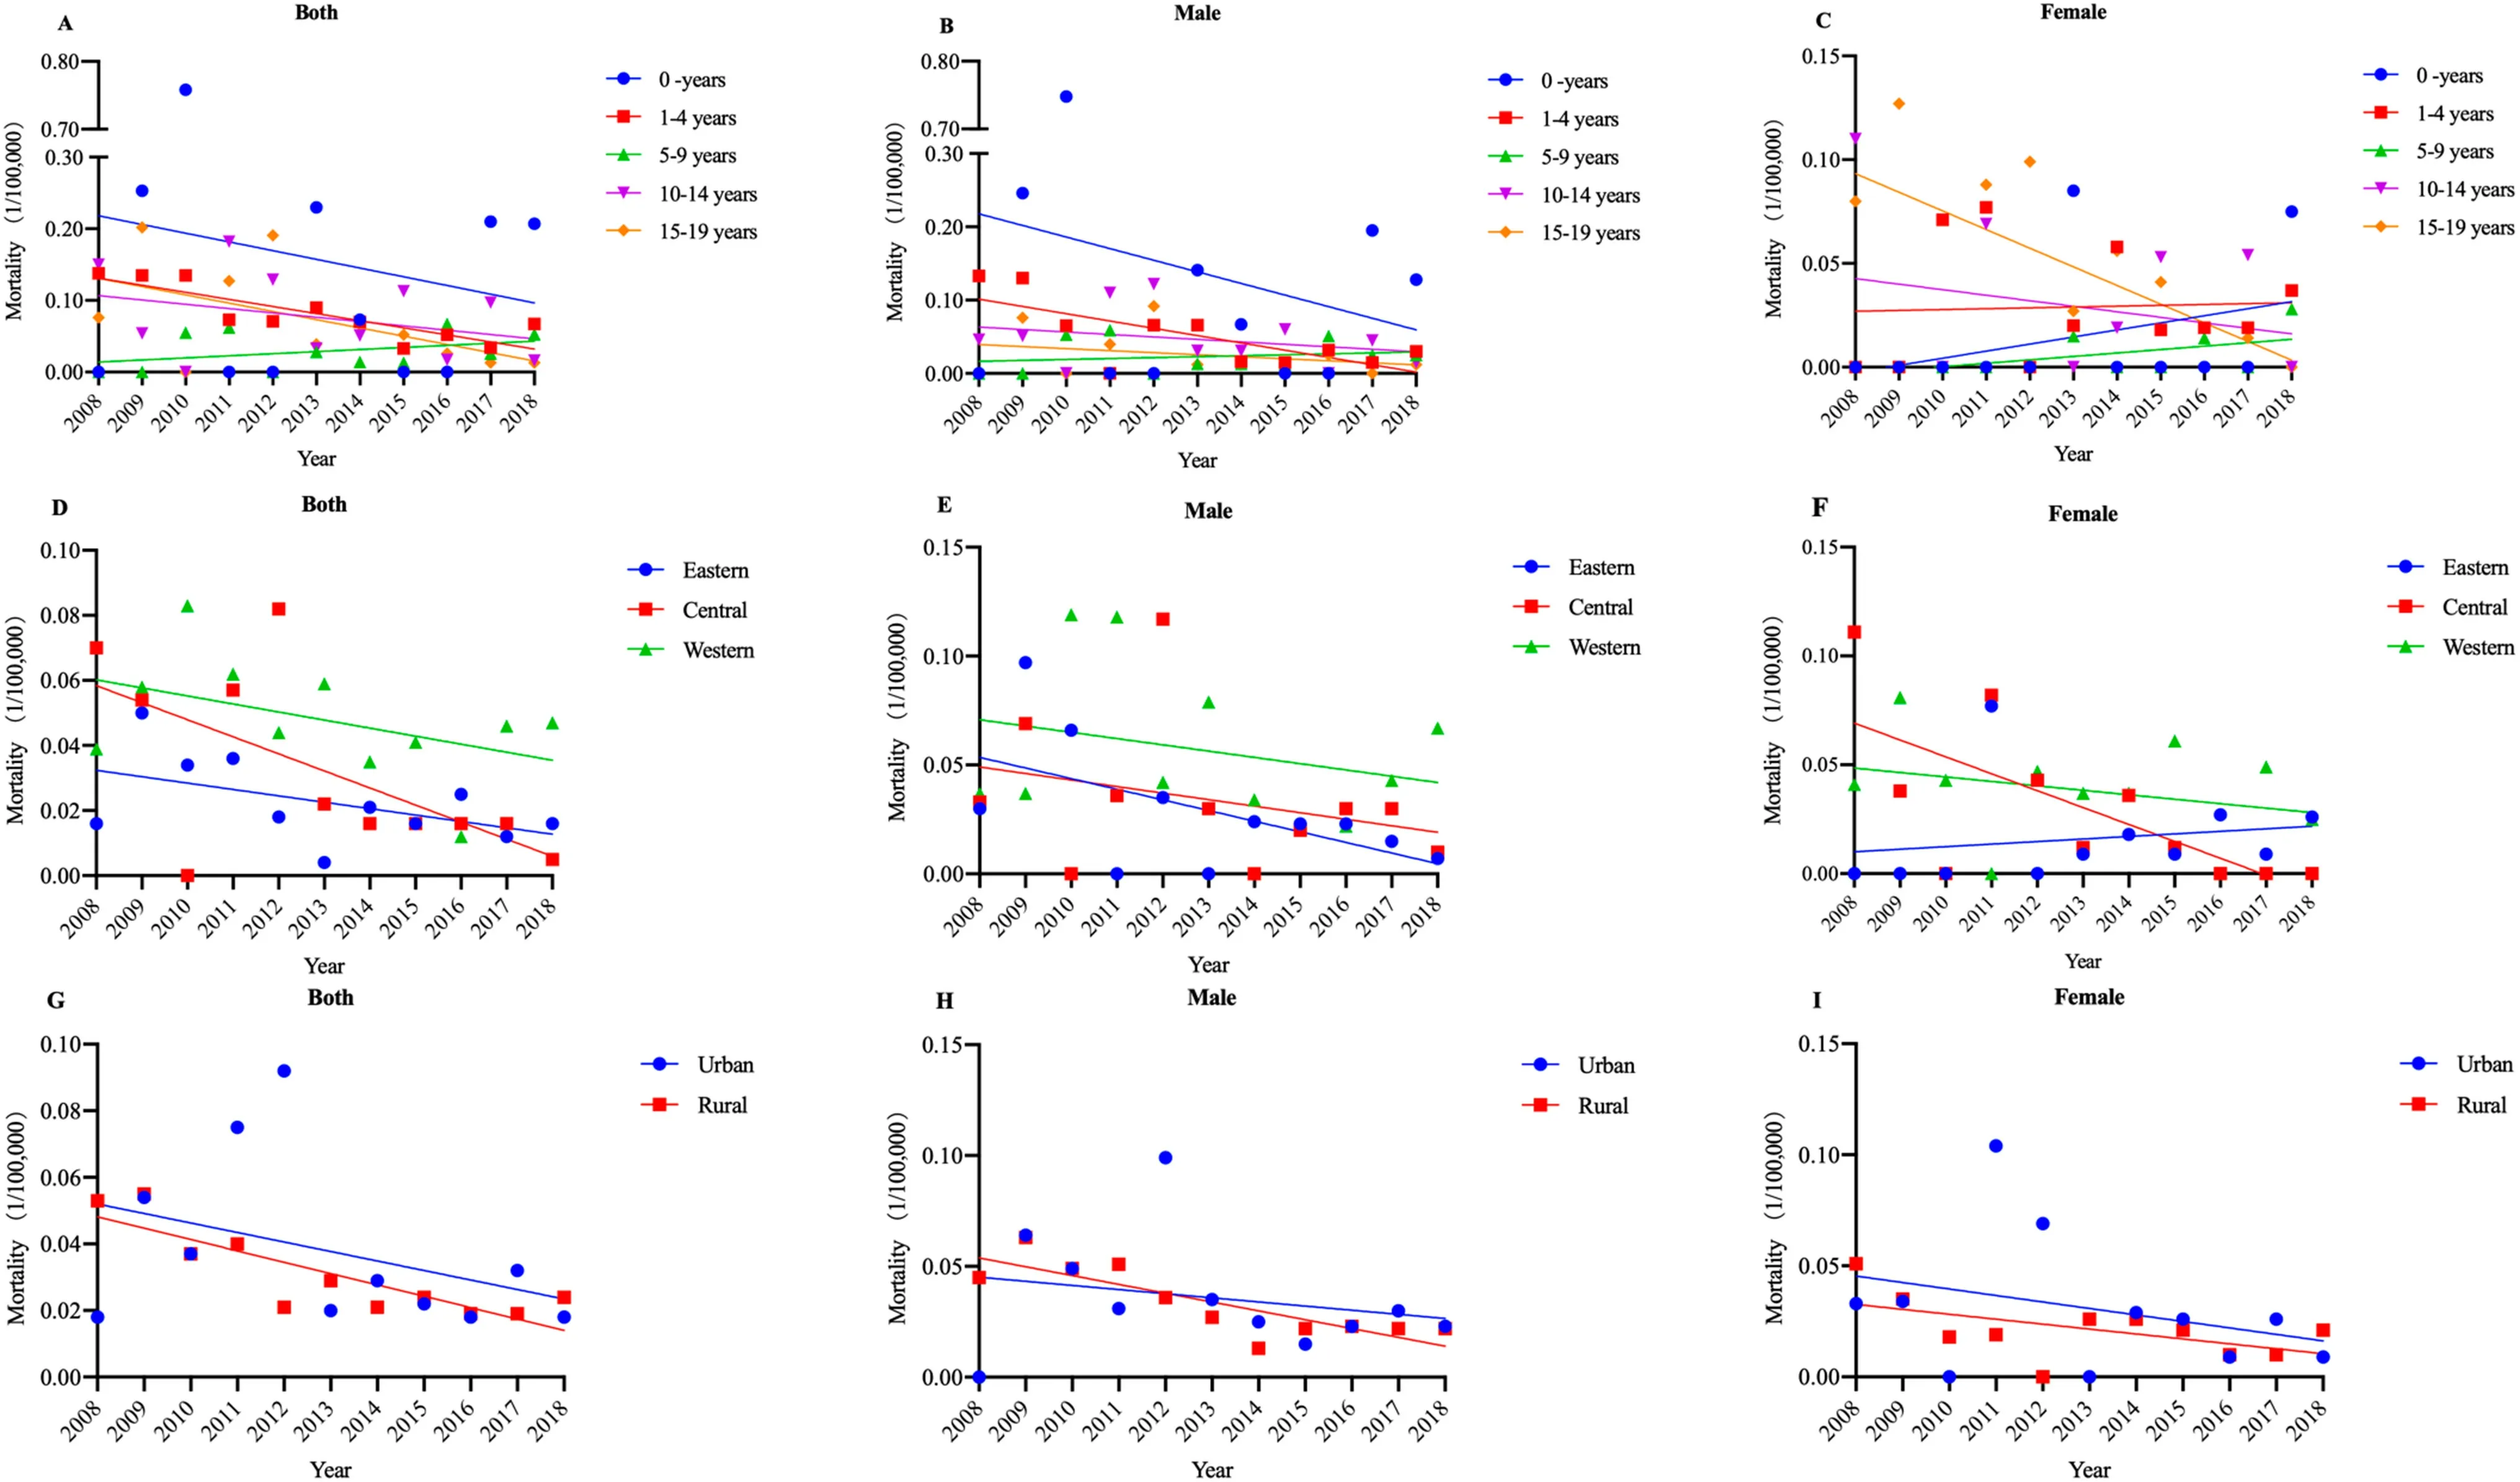
Fig. 1 Trends in asthma mortality rates (1/100,000) among children and adolescents of diff erent genders in China, 2008—2018 by age group( a— c); by region ( d— f); by residence ( g— i)
Table 4 Analysis of factors associated with asthma mortality among children and adolescents in China, 2008—2018; adjusted for time, age, gender, region, and residence
Data for f ixed eff ects are presented in rate ratio and 95% conf idence intervals. disease surveillance points, median rate ratio, proportional change in variance, compared to model 1. Model 1: multilevel Poisson regression model adjusted for time, age, and gender; Model 2:multilevel Poisson regression model adjusted for time, age, gender, and region; Model 3: multilevel Poisson regression model adjusted for time,age, gender, region, and residence. * < 0.05
Variables Model 1 Model 2 Model 3 Fixed eff ects Time (y) 0.908 (0.853, 0.967)* 0.910 (0.855, 0.969)* 0.909 (0.854, 0.968)*Age group (ref: 0—< 1, y) 1 1 1 1—4 0.493 (0.257, 0.942)* 0.491 (0.257, 0.937)* 0.490(0.256, 0.935)*5—9 0.239 (0.117, 0.488)* 0.237 (0.116, 0.485)* 0.236(0.116, 0.482)*10—14 0.465 (0.243, 0.888)* 0.448 (0.235, 0.855)* 0.445(0.233, 0.849)*15—19 0.377 (0.199, 0.716)* 0.369 (0.194, 0.700)* 0.364(0.192, 0.691)*Gender (ref: males) 1 1 1 Females 0.757 (0.520, 1.100) 0.752 (0.518,1.091) 0.751(0.517, 1.092)Region (ref: Eastern) 1 1 Central 1.202 (0.729, 1.981) 1.223(0.740, 2.019)Western 2.328 (1.412, 3.837)* 2.356(1.513, 3.669)*Residence (ref: urban) 1 Rural 0.853(0.584, 1.245)Random eff ects DSP intercept variance (S.E.) 6.808 (1.909) 5.718 (1.832) 5.811 (1.831)MRR 11.93 9.70 9.88 PCV, % 16.01 14.64
Table 5 Asthma mortality rate (1/100,000) and estimated deaths among children and adolescents in China, 2008—2018
Year Total mortality rate Population aged 0—19 years Estimated deaths 2008 0.044 (0.017, 0.113) 334,674,183 148 (58, 379)2009 0.059 (0.025, 0.137) 320,770,905 188 (81, 440)2010 0.041 (0.015, 0.108) 321,211,735 131 (49, 347)2011 0.056 (0.023, 0.137) 316,444,706 176 (72, 434)2012 0.051 (0.020, 0.131) 311,731,649 160 (63, 407)2013 0.028 (0.013, 0.059) 306,828,467 86 (41, 181)2014 0.026 (0.012, 0.056) 304,291,971 79 (37, 169)2015 0.025 (0.012, 0.054) 302,410,194 76 (35, 163)2016 0.020 (0.009, 0.045) 303,775,388 61 (27, 137)2017 0.025 (0.012, 0.054) 305,345,874 77 (36, 165)2018 0.023 (0.011, 0.035) 306,367,073 71 (34, 109)Percent change in rate (%)- 47.38 - 8.46 - 51.83

Fig. 2 Asthma mortality rate (1/100,000) and estimated deaths among children and adolescents in China, 2008—2018
The asthma mortality among children and adolescents in China was lower than estimates from other countries with published data [ 19]. The total asthma mortality rate among Chinese children and adolescents ranged from 0.020 (0.009,0.045) to 0.059 (0.025, 0.137) per 100,000 during the study period (2008—2018). In Kuwait, an Asian country, the average annual mortality rate was 1.4/100,000 among children aged 0—4 years, and 0.7/100,000 among children aged 5—19 years,during 2000—2014 [ 20]. In Mexico, an American country,asthma mortality among children aged 0 to 14 years was 0.40/100,000 during 1999—2016 [ 21]. In the United States,the asthma mortality rate among children aged 0—17 f luctuated from 0.244/100,000 to 0.297/100,000 during 2008 and 2017 [ 22]. In Europe, the cumulative asthma mortality among Finnish children was 0.19 /100,000 during 1999—2015 [ 23]. As with asthma mortality, the asthma prevalence among children in China was also at a lower level worldwide [ 24]. This is consistent with the positive correlation between childhood asthma mortality and prevalence, which was found by the International Study of Asthma and Allergies in Childhood (ISAAC) [ 4].
The asthma mortality rate among Chinese children and adolescents decreased signif icantly from 0.044 (0.017, 0.113) per 100,000 in 2008 to 0.023 (0.011, 0.035) per 100,000 in 2018.The downward trend in asthma mortality is consistent with that observed in other countries, although it is not homologous in all populations or in age groups [ 25, 26]. In Korea,an Asian country, asthma mortality among children aged 0—18 years decreased signif icantly from 0.09 in 2003 to 0.02 in 2014 per 100,000 individuals [ 27]. In Brazil, asthma mortality in children and adolescents aged 0—19 decreased from 0.57/100,000 in 1997 to 0.22/100,000 in 2015 [ 28]. In Mexico,asthma mortality among children decreased markedly from 0.66/100,000 in 1999 to 0.26/100,000 in 2016 (a decrease of 61%) [ 21]. The decreasing trend in asthma mortality in China was observed along with the increasing trend in asthma prevalence [ 29— 31], reinforcing the possibility that the asthma management is improving, as has been observed in other countries[ 32]. In this context, the publication of guidelines in the disease management and the availability of new drugs appear to have led to improved prognosis for asthma [ 33— 35]. However,asthma mortality rates did not decline across all subgroups.For children aged 0—< 1, 1—4, 5—9 and 10—14 years, children in eastern and western China, and children living in urban, the asthma mortality rates remained stable during the study period(2008—2018). Eff ective measures, including the identif ication of preventable factors, should be taken to reduce asthma mortality in these subgroups of children and adolescents.
Factors associated with asthma mortality were found by multilevel models. Asthma mortality among children 0—< 1 year was higher than that among other age groups in China. This observation has previously not been reported and warrants further exploration. The diff erences found in relation to age may ref lect diff erences in the prevalence of asthma and also could be accounted for by asthma attacks caused by respiratory viral infections, which aff ect younger children most. Previous studies investigated the asthma control and related factors of asthmatic children in 29 cities in China, and found that the older age was the protective factor of emergency (OR = 0.946) and hospitalization (OR = 0.857) for asthmatic children [ 36]. According to the current study, asthma mortality in western China was higher than that in eastern and central China. Findings from the present study suggest that there is a greater than ninefold variation in asthma mortality by geographic area, and 14.64% of the geographic variation in asthma mortality was accounted for by area-level risk factors. These geographical inequalities highlight the importance of geographically manifesting factors in understanding asthma burden in China, which may be related to the sociodemographic characteristics, rate of medical and health service utilization [ 37], the relatively low quality of economic development [ 38], and dense air pollution [ 39] in this region.Findings imply that geographically specif ic interventions are necessary to address these area diff erences in the related health outcomes, focusing in particular within the western China.
The estimated number of asthma deaths among children and adolescents in China was lower than that in the United States, similar to that in Mexico, but was higher than that in European countries and Australia. In the United States,number of asthma deaths among children aged 0—18 years f luctuated between 180 and 219 during 2008—2016 [ 40],and 178 children in 2019 [ 41]. In Mexico, the number of asthma deaths among children aged 0—14 years f luctuated between 72 and 148 during 2008—2016 [ 21]. In Europe,a total of 21 deaths occurred among Finnish children and adolescents aged 0—19 from 1990 to 2015 [ 23], 20 deaths occurred among children and adolescents in New South Wales from 2004 to 2013 [ 42, 43], and 10 deaths occurred among Danish children and adolescents from 2000 to 2006[ 44]. In Ireland, 11 deaths were recorded in children under 16 years between 2006 and 2016, on average, 1 death per year (range 0—3) [ 45]. In England and Wales, asthma deaths in children and adolescents have decreased by 62.5% from 48 cases in 2001 to 18 cases in 2017 [ 46]. The total asthma deaths among children and adolescents aged 0—19 years in Australia was 28 between 2005 and 2008 [ 47].
Childhood asthma deaths are uncommon but are of serious concern because many of them are preventable [ 48 , 49]. There is no greater cost than the preventable death of a patient, particularly among children [ 50, 51]. In the UK’s National Review of Asthma Deaths (NRAD), inadequate recognition of the risk of adverse outcome was found to be an important avoidable factor in 78.5% (22/28) of children and adolescents in primary care,and in 31.2% (5/16) of those in secondary care [ 52]. A national audit of asthma deaths in China is needed to identify the preventable risk factors for asthma deaths. Since there is currently no curative treatment for asthma, the priority is to ensure that eff ective and aff ordable asthma treatment is available, and that proven asthma management strategies are applied to vulnerable populations [ 53]. One important evidence-based strategic option was guided self-management [ 54]. Many studies have conf irmed that the application of asthma action plan can improve the prescriptions compliance, can achieve better control in asthma patients[ 55, 56], and was associated with a 70% reduction in the risk of death [ 57].
This study should be interpreted considering its strengths and limitations. High-quality nationally representative data were obtained from offi cial government sources and were systematically analyzed to accurately estimate trends in childhood asthma mortality. By pointing out regional and age-related impacts, the data presented here may contribute to informing public policies aimed at asthma control [ 58]. One limitation of the study was that “crude mortality rate” calculated in this study was unadjusted for the underreporting rate. Before forming the f inal database, the data collected by DSPs were evaluated and eliminated for quality, but the possibility of miscoding of causes of deaths could not be completely ruled out,meaning that the true burden of asthma mortality might still be mis-estimated. In calculating the “corrected mortality rate”, the database should be adjusted for underreporting. Another limitation was that the present study did not obtain individual-specif ic data on asthma deaths and failed to analyze other potentially important risk factors, such as previous pattern and severity of asthma, management before the fatal attack, and the fatal episode [ 59]. In the UK [ 60] and Australia [ 42], detailed retrospective investigations of asthma deaths were conducted, and a national asthma plan based on asthma control was developed to reduce asthma-related mortality. Asthma-related death is a rare and potentially preventable event. In the future, possible risk factors for asthma death in Chinese children and adolescents should be further investigated to prevent or minimize asthma death in this age group and to improve asthma management and care [ 61].
In conclusion, asthma mortality rate among children and adolescents in China was at a lower level in the world. From 2008 to 2018, the asthma mortality rate among children and adolescents in China decreased signif icantly. Asthma mortality rates were lower among children aged 1—4, 5—9, 10—14, and 15—19 compared with children aged 0—< 1 year old. Among children and adolescents, asthma mortality rate was higher in western China. The estimated number of asthma deaths among children and adolescents was higher in China than in other countries. Geographic variation was found in asthma mortality rates between DSPs points. Further research is needed to identify preventable factors contributing to asthma deaths among children and adolescents in China and to assess prevention strategies to reduce asthma deaths.
Acknowledgements
This work was funded by grant from the National Key Research and Development Program of China: Cohort Study of Respiratory Diseases-Children-Adult Asthma Cohort Study in China(2016YFC0901103).Author contributions
KLS obtained funding. KLS and JY, TTL conceived the study. TTL drafted the manuscript, collected, and analyzed the data. JLQ, JY, QG, WX, JJQ, PY, MGZ and KLS revised and approved the f inal version of the manuscript. The corresponding author attests that all listed authors meet authorship criteria and that no others meeting the criteria have been omitted. KLS is the study guarantor.Funding
This project was supported by grant from the National Key Research and Development Program of China: Cohort Study of Respiratory Diseases-Children-Adult Asthma Cohort Study in China(2016YFC0901103). The funders were not involved in the collection,analysis, or interpretation of data, or in the writing or submitting of this report. The authors had full access to all data and f inal responsibility for the decision to submit for publication.Data sharing
The datasets generated and/or analyzed during the current study are available from the corresponding author on reasonable request. The lead author affi rms that the manuscript is an honest,accurate, and transparent account of the study being reported, that no important aspects of the study have been omitted.Declarations
Ethical approval
Not required. This study does not contain personal or medical information about an identif iable living individual, and animal subjects were not involved in the study.Conflict of interest
No f inancial or non-f inancial benef its have been received or will be received from any party related directly or indirectly to the subject of this article. The author Kun-Ling Shen is a member of the Editorial Board for the journal. The paper was handled by the other Editor and has undergone rigorous peer review process. The author Kun-Ling Shen was not involved in the journal’s review of, or decisions related to, this manuscript.杂志排行
World Journal of Pediatrics的其它文章
- Association between genetic polymorphisms of base excision repair pathway and glioma susceptibility in Chinese children
- Evaluation of proximal tubule functions in children with COVID-19:a prospective analytical study
- Genotypic and phenotypic spectra of NBEA-related neurodevelopmental disorder with epilepsy: a case series and literature review
- Using echocardiography in newborn screening for congenital heart disease may reduce missed diagnoses
- Impact of comorbidities on the prognosis of pediatric vasovagal syncope
- Eff ect of early feeding practices and eating behaviors on body composition in primary school children