Evaluation of groundwater quality in the Dibdibba aquifer using hydrogeochemical and isotope techniques(Basrah Province,Iraq)
2022-10-27InassAlMallahWasanAlQurnawiHusseinGhalibAdnanAlHawashMariamAbdulameer
Inass A. Al-Mallah · Wasan S. Al-Qurnawi · Hussein B. Ghalib,2 ·Adnan B. Al Hawash · Mariam H. Abdulameer
Abstract The Dibdibba aquifer is considered to be the main source in the Al-Zubair area because agriculture depends on it to provide grazing water in the area. The groundwater well samples were collected from the shallow Dibdibba Aquifer in Basra Province,southern Iraq,through the dry and wet period for 37 water samples were collected,to investigate the water quality deterioration, which is a hydrogeochemical modeling study where used to represent the groundwater mixing evaluation. The physicochemical parameter results show the spatial and temporal variations along the groundwater flow path. A Durov diagram of the studied samples shows water type Na_SO4, which is represented by mixing waters that may be affected by dissolution. Inverse geochemical model ratio results of the groundwater well samples have shown high mixing ratios in the east and southeast regions of the study area. The stable isotope composition of groundwater samples indicated that the recharge source of the Dibdibba aquifer is meteoric water influenced by vapor water from the Arabian Gulf. The stable isotope results have shown that the enrichment of δ18O values is relatively linked with high salinity concentration and indicated the mixing between the upper unconfined and the lower confined, especially in the eastern and southern parts of the study area.These findings of geochemical modeling and isotopes indicated an increasing groundwater quality deterioration. Thus, we recommended avoiding these areas for intensive extraction of groundwater.
Keywords Safwan-Zubair · Dibdibba formation ·Geochemical modeling · Mixing · Stable isotopes · Basra
1 Introduction
Controlling and managing water resources are considered the main important problems that are facing most countries in arid and semi-arid regions under the influence of global climate change. These regions suffer from a scarcity of water due to low rainfall rates and high evaporation rates.The scarcity and lack of water and the deterioration of water quality lead the states or countries to develop alternative and future plans to manage water resources and prevent pollution (Al-Mallah and Al-Qurnawi 2018).Groundwater is an important source for human life; it is considered an important source in arid and semi-arid regions. Growing populations, increasing municipal,industrial, and agricultural activities, as well as the natural climatic changes resulting in global warming, have led to significant changes in water resources (surface and groundwater),which these factors have seriously increased the water requirement across the world(Ali 2012;Al-Asadi et al. 2020). Evaluating and monitoring their sources is urgent for hydrogeologists to detect the factors that caused negative anomalies in groundwater quality, in addition to implementing any management plan (Ali and Shaban 2014). The demand for groundwater in arid regions is increasing, especially in previous years (Titus et al. 2009;Abiye and Leshomo 2013). However, salinization and environmental pollutants are considered the major factors that affect the groundwater quality(Khwedim et al. 2017).The hydrochemical and environmental analyses are important in groundwater quality assessment(Keesari et al.2014), in which evaluating the heavy metal concentrations in groundwater is important because it could cause serious environmental and health problems (Yahaya et al. 2009;Liu et al. 2021). Intensive applications of toxic chemicals(e.g., inorganic contaminants, pesticides, fertilizers) posed by agricultural and rural development activities, as well as excessive discharge of waste and wastewater without proper treatment,have all contributed to the degradation of groundwater quality in recent decades (Tran et al. 2021).The interaction soil/rock-water process during recharge,groundwater flow, is solution of minerals species, etc. are considered the main processes that responsible for the variation of groundwater and vice versa (Odukoya et al.2012).
The use of the environmental isotopic technique in the hydrology field has revealed encouraging results, which have been proven as an effective tool in studies that can be relied upon to estimate the recharge processes, groundwater source and age, geochemical interpretation, waterrock interaction, the origin of salinity, and contaminant processes(Ghalib 2008,2017).The study area is located in arid or semi-arid climatic regions. It suffers from a systematic water shortage that is exacerbated by rapid urbanization, industrialization, growing agricultural demand, and environmental degradation. Therefore, the study of isotopes will be useful in understanding the hydrogeological processes of the groundwater-aquifer interface, and the study of aquifers in this area has been initiated to provide the necessary information to allow sustainable development of water resources in the region.
Stable isotopes of oxygen (δ18O) and hydrogen (δ2H)have been used to assess the variability in groundwater conditions from recharge to exploitation zones (Clark and Fritz 1997; Murad and Krishnamurthy 2008; Ghalib and Sogut 2014). During subsurface recharge, the isotopic signatures of oxygen and hydrogen are influenced by atmospheric and surface processes (Gupta and Deshpande 2005). Stable isotopes of hydrogen (δ2H) and oxygen(δ18O) in water have different uses in groundwater as naturally signatures to evaluate the rainfall importance, to track the source and flux of water to/from rivers and lakes in watersheds, and to assess the origin and age of groundwater resources(Clark and Fritz 1997;Bowen 2010;Liu et al. 2019a).
Several preceding studies have been conducted in the present study area and the surrounding areas. Haddad and Hawa (1979) examined the hydrogeology of the Zubair -Safwan region in detail by identifying the hydrodynamic properties of the aquifer in the study area.While(Al-Dabbas et al.1989)illustrate the relationship between the quality of groundwater in Zubiar-Safwan and sediments forming the Dibdibba reservoir is examined.the geochemical assessment of the groundwater system in the Dibdibba formation in southern Iraq was studied by (Al-Suhail 1999). Also, Atia(2000) presented a detailed study on the hydraulic characteristics and the specific yield values on the basis of analytical and numerical approaches.Ghalib(2000,2008)used geochemical modeling for testing the groundwater hydrochemistry and the influence of the mixing scheme with different ratios of the native groundwater quality.
Due to the region’s influence on global climate change and the lack of precipitation rates, especially in recent decades, which led to a decrease in the aquifer’s surface recharge rates,as well as the excessive use of the aquifer in the absence of management and limiting on the number of drilled wells, all that lead to deteriorated in water quality over time. As a result of the necessity to assess the extent of the change in groundwater quality, the study aims to evaluate the hydrogeochemical properties of the Dibdibba aquifer and the extent of the mixing that occurs. For two dry and wet seasons to assess the quality and classification,in addition to the mixing proportion of the two upper(unconfined aquifer) and lower confined aquifer using hydrogeochemical modeling, along with using the stable isotopes technique to identify the Basrah local meteoric water line and assessment of different groundwater recharge zones. It has proven to be an efficient technique in investigating the hydrochemical changes of groundwater aquifers in several parts of the world, such as(Liu et al. 2019b, 2020).
2 The study area description

Fig. 1 Location map of the Study area with selected wells
The study area is located in the Basra governorate in southern Iraq, within the Zubair-Safwan area between longitudes 47˚55′0′′to 47˚30′0′′N and latitudes 30˚27′0′′to 30˚03′0′′E with an average area of 2,874.2 km2(Fig. 1).The climate of the study area is generally hot in summer and is cool in winter, with extreme temperature, low rainfall, and high humidity. In recent years, temperatures have reached 50° C in the summer months of July and August, while in winter, they drop to 8° C in January. While the region suffers from a shortage of yearly rainfall rates, the maximum rates in the last ten years have reached 20 mm in January.The direct rainfall recharge is considered the main source in the study area, whereas the subsurface recharge by the flowing in Wadi Al-Battin represents another source of groundwater in the south and southwest direction in the study area (Abdulameer and Al-mallah 2018). The study area contains shallow valleys,wherein the drainage system shows parallel patterns usually located in the southern and southwestern parts of the study area. The valleys are filled with water during the rainy season; which is considered a recharge system for groundwater (Haddad and Hawa 1979). From the geological viewpoint, the Dibdibba formation mainly contains sandy gravel soil. The sand rocks are composed of quartz minerals,feldspar,gypsum,calcite,and a large group of clay minerals(Al-Dabbas et al.1989).The maximum thickness of the formation is 354 m in the north wells of Zubair oil field (Van Bellen 1959).
Many geomorphological features can be seen in the Dibdibba plain, such as the Jabal Sanam hill, sand dunes,and shallow wadies (Al-Naqib 1970; Haddad and Hawa 1979; Ghalib 2000) (Fig. 2). The elevation of the study area referenced to the sea level ranged from 5 to 58 m(Abdulameer and Al-mallah 2018). The land surface of Safwan-Zubair is flat and has a gentle decline from the highest level at Jabal Sanam Mountain to the northeastern parts of the study area.
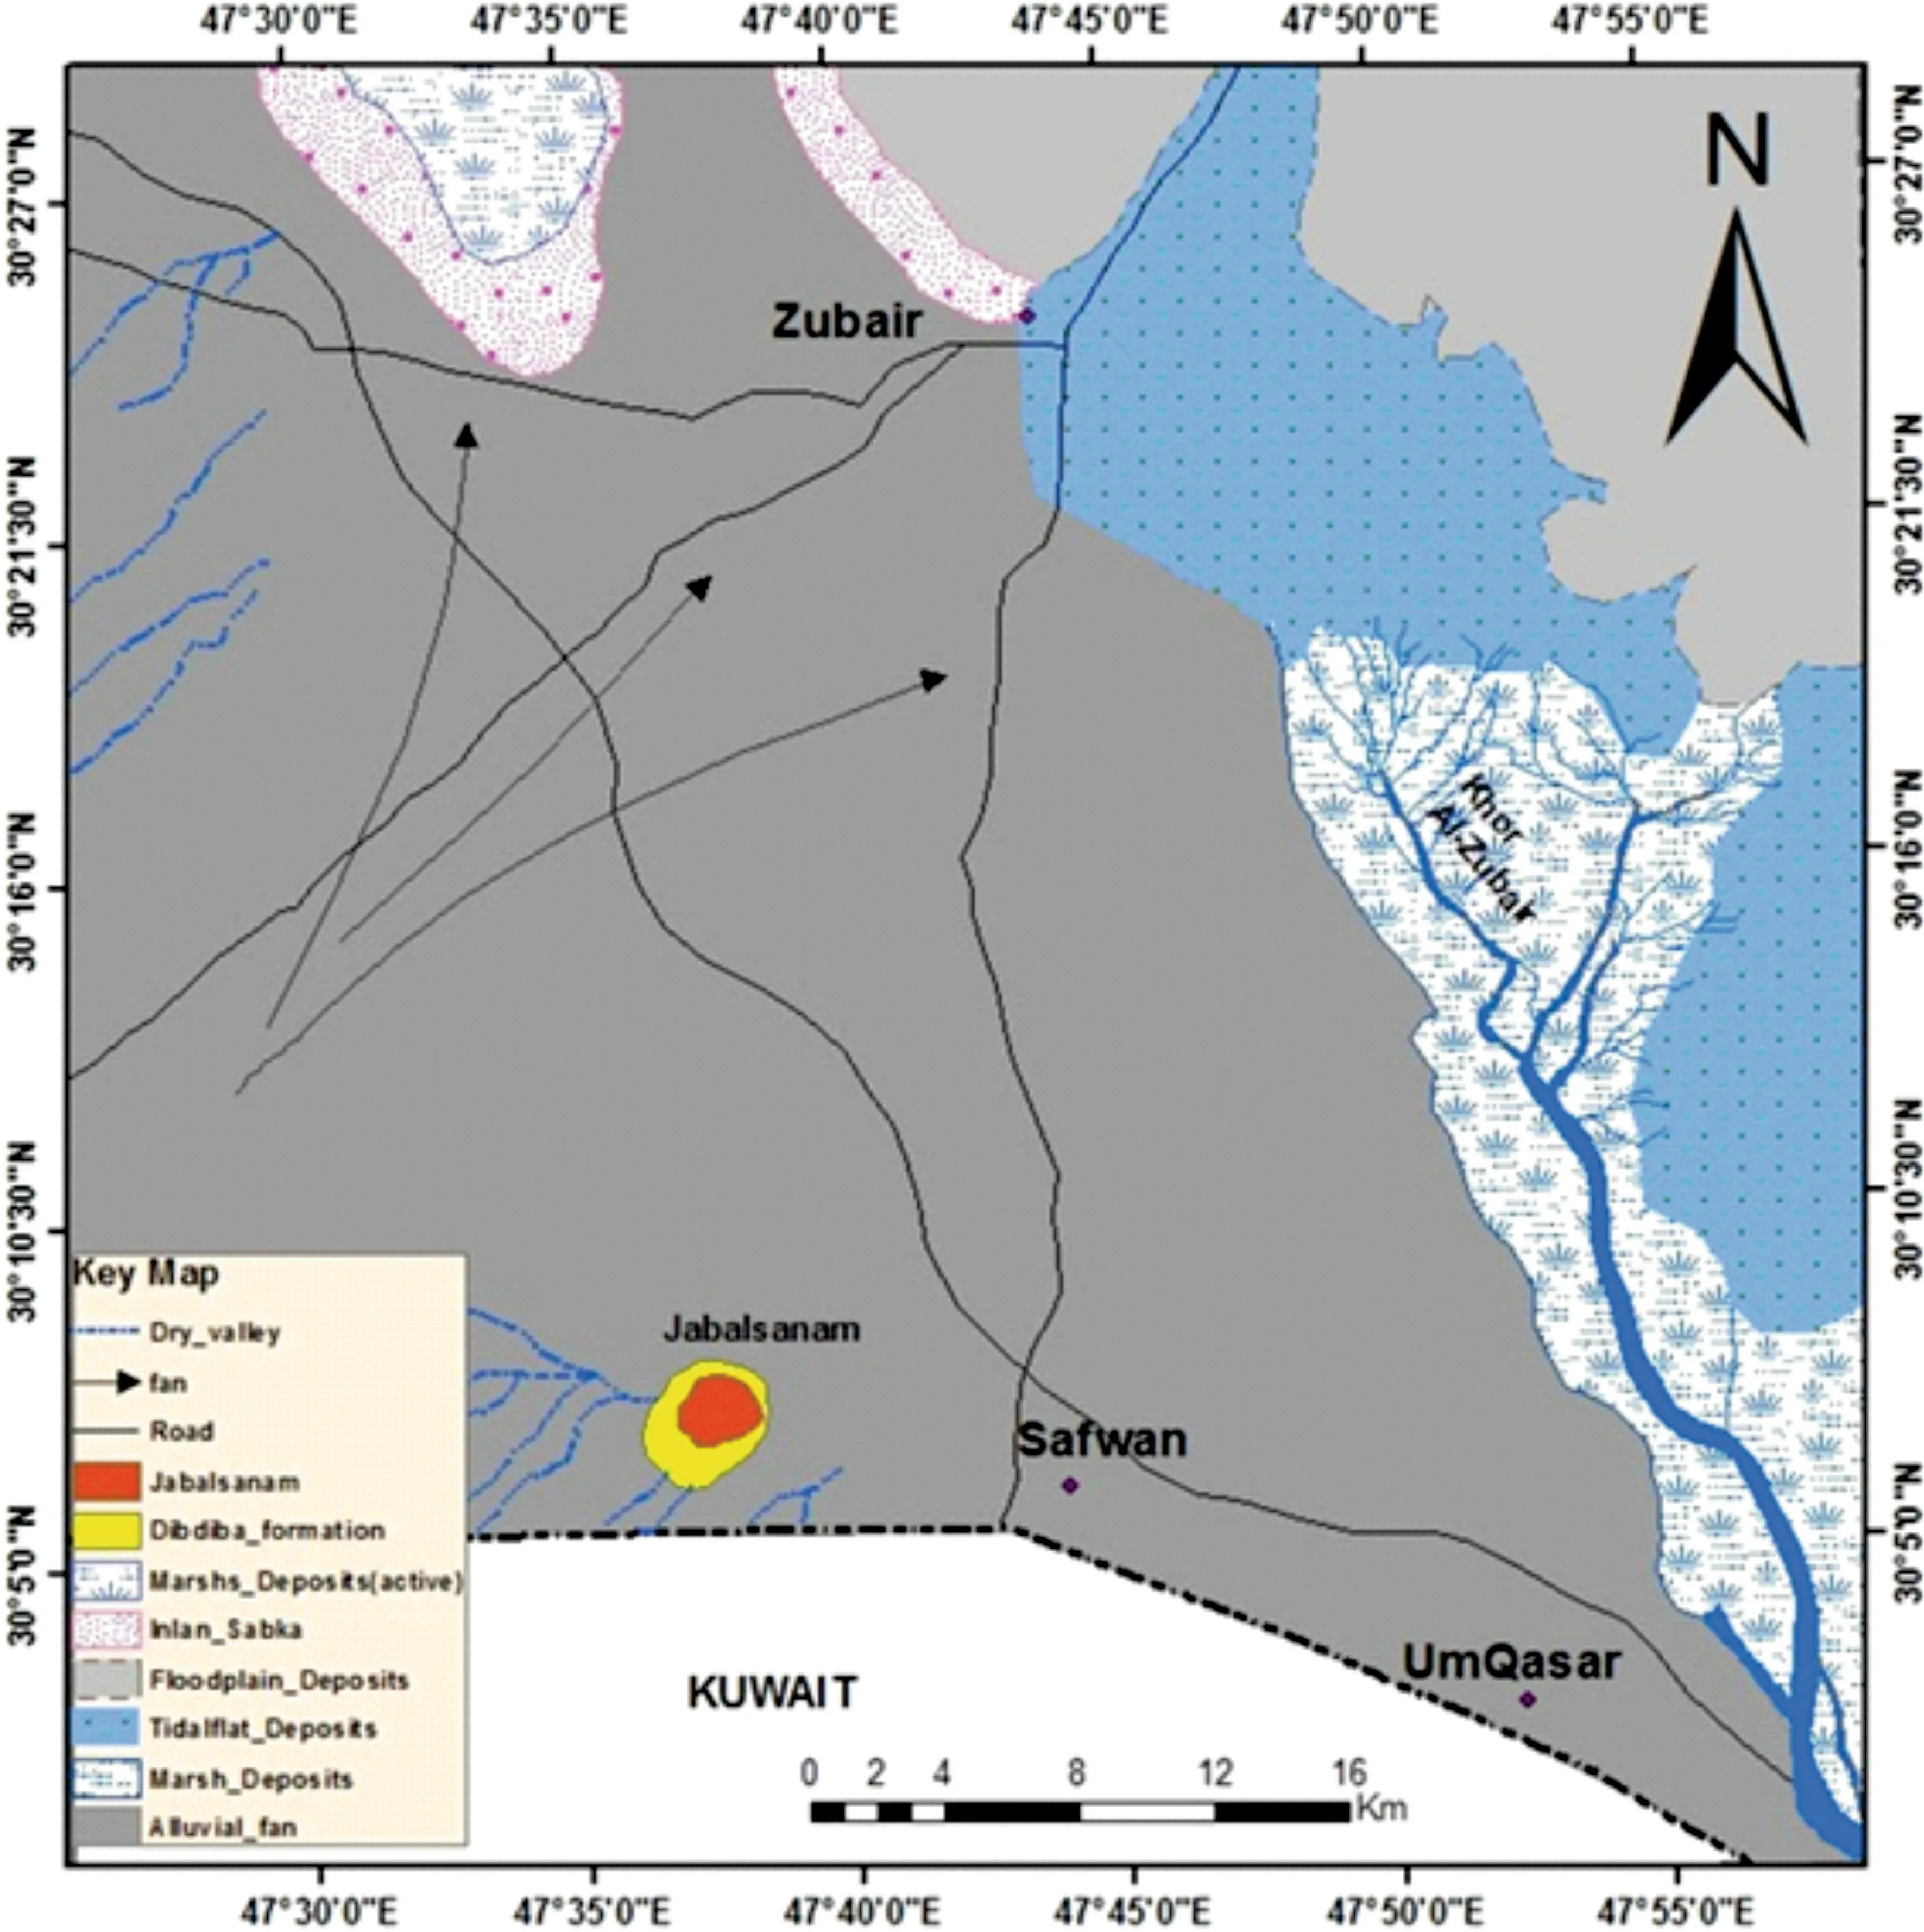
Fig. 2 Geological map of the study area (modified from GEOSURV, 2011)
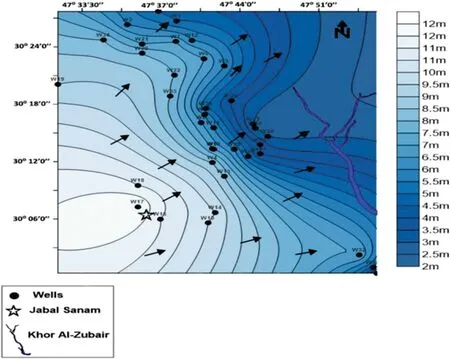
Fig. 3 The flow direction of groundwater in the study area
The groundwater of the Dibdibba formation is considered the main source for many people who lived in the southwestern part of the Basra governorate.They depended on groundwater wells for domestic and agricultural life requirements. During the past twenty years, the deterioration in groundwater quality, aside from increasing the salinity of most groundwater wells, was detected in many farms. The field trips show an extreme intensive pumping operation, in addition to drilling many groundwater wells by private companies with different depths and numbers without the approval of the Ministry of Water Resources.These factors are important problems in arid and semi-arid regions due to urbanization and agricultural activities(Abdulameer and Al-mallah 2018).
2.1 Hydrological setting
The Dibdibba formation is the main aquifer of the study area, where the upper part of the aquifer is unconfined,separating from the deeper part of the aquifer, which is semi-confined to the confined aquifer by a hard clay layer with 2 to 4 m of the thickness.The flow system in the area,which is based on the correct static water levels, is characterized by the groundwater direction from the west and southwest toward the drainage area in the Khor al Zubair and Shatt al-Basra channels in the eastern and northeastern directions (Fig. 3). The structural and geological setting controls the flow of groundwater movement in this direction. Tectonically, the area is situated within the unstable shelf within the Zubair subzone, which is part of the Mesopotamian zone(Jassim and Goff 2006).The study area is located in the Mesopotamian foredeep within the outer platform of The Arabian platform (Fouad 2010). Al-Zubair fold,Rumaila fold,and Al-Luhais fold are the main subsurface structures within the area which are usually long narrow, and forming subsurface anticlines folds separated by synform folds towards NW-SE (Karim 1992).
3 Materials and methods
3.1 Groundwater sampling, chemical analyses
Thirty-seven groundwater samples were selected to be distributed in the study area in September(dry period)and April (wet period) 2017 from the unconfined upper part of Dibdibba aquifer. The 37 samples were analyzed for physicochemical parameters: total dissolved solids (TDS),electrical conductivity (EC), pH, and temperature (T),which were measured in the field by using HannaInstruments portable meters. Major and minor elements were analyzed in the laboratory of Basra Environmental Agency, Ministry of Environment where all the physical and chemical parameters were analyzed by using the routine techniques described by APHA (2017). All samples were analyzed in the laboratories of the Basra University in Iraq. Major cations such as Ca and Mg were analyzed by titrimetric, Na, K, and Ba by flame photometer (Elico CL 378), major anions Cl and HCO3by titrimetric, SO4by Turbidimetric and colorimetric methods, NO3by Ultraviolet spectrophotometer screening method, PO4-3by Ascorbic acid method using a spectrophotometer, Fe, Pb,Zn, and Cd analyzed by Atomic Absorption Spectrophotometer. Finally, ion balance was calculated for each sample;the error was below 5%,justifying the accuracy of the chemical analyses.
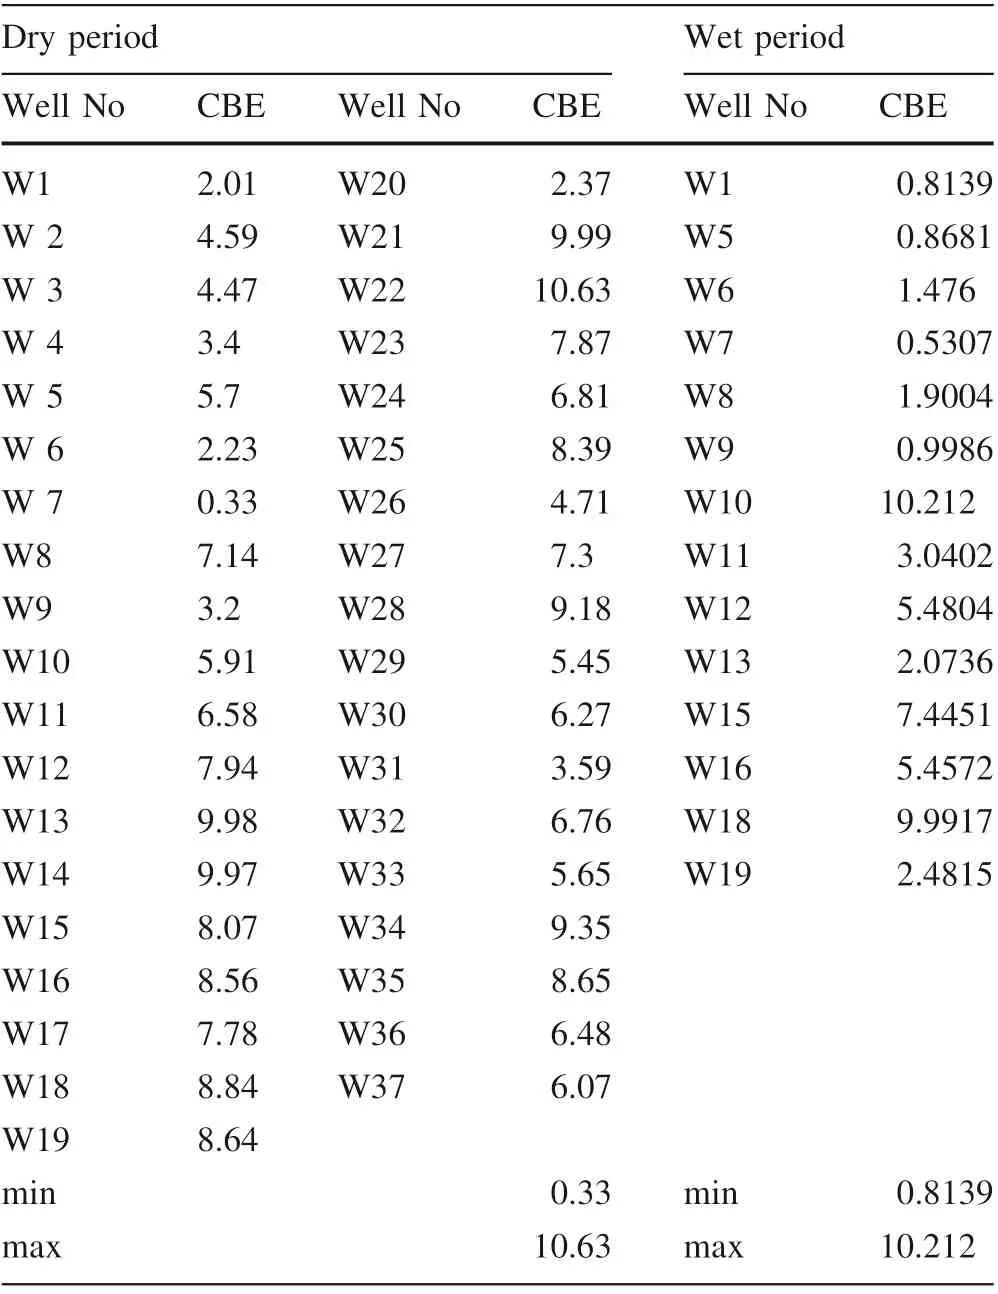
Table 1 The electrochemical balance error (CBE) for all the groundwater samples
According to Eq. (1)in(Appelo and Postma 2004)were all the cations and anions in epm unit, the results of electrochemical balance error (CBE) for all the groundwater samples were within the acceptable limits except for groundwater well W22 and W10 which can’t be adopted at dry and wet periods respectively (Table 1).

The electrochemical balance error (CBE) for all the groundwater samples was tested as illustrated in Table 1.The inverse geochemical models can be applied by identifying the minerals that react and it is dissolutions or precipitation (Plummer et al. 1983; Appelo and Postma 2004). Mass balance calculation is a familiar tool for studying the chemical evolution of the water-rock interaction system.It is based primarily on the assumption(Van der Kemp et al. 2000):

To characterize the recharge sources of the study area aquifers,we performed two seasonal samplings(November 2017 and April 2018) for the hydrological year 2017 to 2018 at various points in the study zone. Isotopic ratios were measured using an 1RMS (Isotope Ratio Mass Spectrometer). Results are expressed as isotopic deviation δ18O, which were

where Rsampleand Rvsmoware the isotopic ratio(2H/1H,18O/16O)of the sample and the isotopic ratio of the international standard reference, respectively. Sample isotope ratios are standardized using a range of working standards that have been calibrated against the International Atomic Energy Agency (IAEA) and standard reference materials Vienna Standard Mean Ocean Water(VSMOW) (Schimmelmann and DeNiro 1986).
The spatial distribution of the groundwater quality of the present study was represented using the ArcGIS 10.6.1(Geographic Information System) software, the Aquachem v.2016 software was used for plotting Durov diagram.
3.2 Geochemical modeling
The computer program NETPATH (Plummer et al. 1994)is frequently used to construct quantitative models of the chemical evolution of waters along real or hypothetical flow paths in aquifers or other hydrologic systems using hydrochemical data. These models provide important information on geochemical processes and water-rock reactions that can be used to place constraints on numerical models of groundwater flow (Sanford et al. 2004; El-Kadi et al. 2011). The geochemical mass balance and mixing computer NETPATH (Plummer et al. 1994) was used in the evolution of geochemical for the studied aquifer and to demonstrate the mixing proportion of the groundwater wells. NETPATH is an interactive computer code that can be used to calculate the net geochemical mass-balancereactions between an initial water and final water along a hydrologic flow path. NETPATH can also be used to evaluate mixing of waters and the accompanying net geochemical reactions that occur along a flow path. The user inputs the initial and final water compositions, select the chemical and isotopic constraints on the system,and selects the potential phases that may react, the calculations are of use in interpreting geochemical reactions, mixing proportions, evaporation and (or) dilution of waters, and mineral mass transfer in the chemical and isotopic evolution of natural and environmental waters (Plummer et al. 1994).

Table 2 Physiochemical analysis of the groundwater in the study area for two periods
3.3 Isotope analyses
To assist in the interpretation of the groundwater isotopic values during this study,nine groundwater samples and six rainfall samples collected for stable isotopes of oxygen-18 and deuterium were collected untreated in 500 mL glass bottles with poly-seal caps to prevent evaporation. These samples were analyzed using CO2-H2O and H2-H2O equilibration methods on a Gas Bench-II device interfaced with a Delta Plus XL isotope-ratio mass spectrometer.Sample isotope ratios are standardized using a range of reference waters,which have been calibrated against IAEA reference waters (VSMOW2, GISP2, and SLAP2). Precision for water samples at the natural abundance is typically ≤0.3 per mil for18O and ≤2.0 per mil for2H.Final18O and2H values are reported relative to VSMOW.Stable isotope analyses were performed at the UC Davis Stable Isotope Facility, Department of Plant Sciences.
4 Results and discussion
4.1 General hydrogeochemistry
The hydrochemistry of the subsurface water is important to understand the factors that affect the suitability of groundwater for drinking, agriculture, domestic, and industrial purposes (Subramani et al. 2005; Alam et al. 2012).
Table 2 shows the summary analysis results of the present groundwater samples,which include the minimum,maximum and average for physical and chemical parameter. The results of the chemical analyses of groundwater show different variations,where pH values of groundwater samples ranged between 7 and 8.1 with an average of 7.3,wherein the nature of water in the region was slightly alkaline, and where all samples are considered normal according to IQS (2009) and WHO (2011) standards. The TDS ranged between 2704 and 10,322 mg/L with an average of 6198.1 mg/L in the dry period, whereas it ranged between 2639 and 8404.5 mg/L with an average of 5941.4 mg/L in the wet period (Table 2). The concentration of TDS in groundwater is dependent on the type of rock and the variation of mineral solubility (WHO 2011).The concentrations of total dissolved solids are increased at the recharge areas in Safwan and Jabal Sanam, whereas it decreases toward groundwater flow in the region to the discharge areas toward Khor al-Zubair, (Fig. 4). Most of the present subsurface samples fell within the slightlybrackish water class, except for sample W32, which is considered brackish water according to Freeze and Cherry(1979)and Todd and Mays(2004).The values of EC in thestudy area ranged between 4160 and 15,880 μS/cm with an average of 9535.6 μS/cm in the dry period, and it ranged from 4060 to 12,930 μS/cm with an average of 9140.7 μS/cm during the wet period (Table 2). The high variation in conductivity is due to various geochemical processes,such as ion-exchange, reverse ionic exchange, rock-water interaction,evaporation,silicate weathering,oxidation,and sulfate reduction processes (Ramesh and Elango 2012).The concentration value is extremely high in the south and middle parts of the region. According to (Detay and Carpenter 1997),the groundwater samples in the study area are classified as excessively mineralized water.
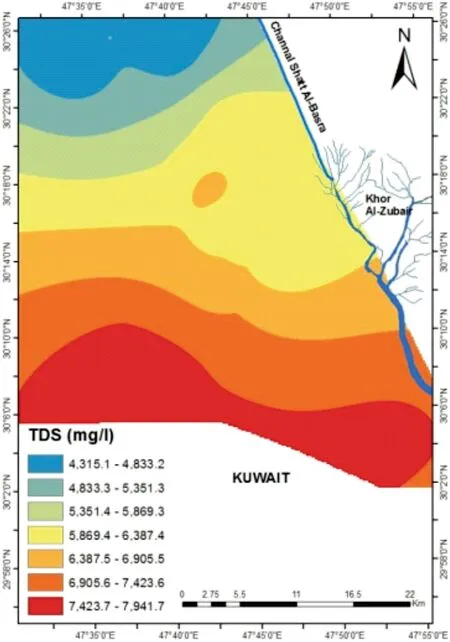
Fig. 4 Spatial distribution of the total dissolved solids (TDS mg/L)
Calcium concentration Ca2+can be present in groundwater as a result of dissolving gypsum, calcite, and anhydrite minerals; the main source of calcium ions is the erosion of pyroxene, amphibole, and feldspar minerals depending on the solubility of sulfide, calcium carbonate,and chloride (Pradhan and Pirasteh 2011). The concentration of Ca+2in the groundwater samples ranged between 340 and 989 mg/L with an average of 601.6 mg/L in the dry period,while it ranged between 456 and 986 mg/L with an average of 676.86 mg/L in the wet period(Table 2).The magnesium content in the present groundwater samples varied from 65 to 700 mg/L with an average of 285.05 mg/L(Table 2).The concentration of Mg2+may be derived to groundwater from the leaching process of calcite minerals,such as dolomite and calcite (Magesh et al. 2013). The concentration of Mg2+of the groundwater samples are ranged between 65 and 700 mg/L with an average 285.05 mg/L in the dry period, while it ranged between 209 and 399 mg/L with an average 303 mg/L) in wet period(Table 2).The main source of sodium concentration was halite mineral (NaCl) because of high solubility(Ghalib 2017) and the ion-exchange of clay minerals (Al-Bassam and Al-Bedary 1997). The values of sodium concentration in groundwater samples ranged from 100 to 1500 mg/L with an average of 275.94 mg/L in the dry period, while it ranged from 266 to 871 mg/L with an average of 632.4 mg/L in the wet period.The values of K+Concentration ranged between 15 and 95 mg/L with an average of 33.26 mg/L in the dry period, while ranged between 21 and - 87 mg/L with an average 60.7 mg/L in wet period, (Table 2). The lower concentration of K+in groundwater samples is due to the adsorption of potassium and involvement in the crystalline structure of some clay minerals, such as illite (Hem 2005). The extreme use of fertilizers are the main source for the increased K+in groundwater by irrigation results that infiltrated downward,thus recharging groundwater. The higher concentration of K+was near Jabal Sanam due to the increased agricultural activities at this region. The value of CO3-2concentration in study area ranged between 2 and 270 mg/L with an average of 37.88 mg/L. HCO3-concentration ranged between 2 and 579.5 mg/L with an average of 146.09 mg/L in the dry period, while it ranged between 134 and 288 mg/L with an average of 207.4 mg/L in the wet period(Table 2).The dissolution of calcareous minerals may lead to an increase in the concentrations of bicarbonates in the groundwater (Stumm and Morgan 2012). The concentration of Cl-in groundwater samples ranged between 480 and 2545 mg/L with an average of 1436.94 mg/L in the dry period, while it ranged between 1363 and 2829 mg/L with an average of 2133.5 mg/L in the wet period(Table 2).The higher concentration of chloride in groundwater may be because of chemical fertilizers, chloride treatment, irrigated water, and sewage, as well as from leaching of the halite mineral in the study area(Bhatia 2003).The value of sulfate concentration in the study area ranged between 530 and 2116)mg/L with an average of 1087.3 mg/L in the dry period, but it ranged between 568 and 991 mg/L with an average of 849.5 mg/L in the wet period, (Table 2). The higher concentration of the SO42-is due to the increasing solubility of evaporated rocks (gypsum and anhydrite),fertilizers, detergents, and pesticides (WHO 2011). The value of NO3-concentration in the study area ranged between 0.1 and 25.58 mg/L with an average of 9.36 mg/L in the dry period,while it ranged between 3.03 and 4.5 mg/L with an average of 3.7 mg/L in the wet period(Table 2).The nitrate is widely found in soil and groundwater and is also considered one of the most important problems of groundwater pollution because of the excessive use of fertilizers (Al-Asadi et al. 2019; Liu et al. 2021). Finally,the phosphate is present in the surface and groundwater as a result of fertilizers, pesticides, domestic sewage, and industrial waste(Patil and Patil 2010).The value of PO4-2concentration in the study area ranged between 0.54 and 1.30 mg/L with an average of 0.64 mg/L in the dry period,while it ranged between 0.066 and 0.9) mg/L with an average of 0.31 mg/L in the wet period (Table 2).
4.2 Trace elements
The mean of the iron concentration ranged between 0.002 and 0.4 mg/L for wet and dry periods, respectively, which is higher than the acceptable limits of IQS (2009) and WHO (2011) standards in wet periods, whereas it was within the limits in dry periods(Table 3).Lead is present in the groundwater as a result of the process of mining, pesticides, sewage, and fuel combustion (Al-Ibrahimi and Ghalib 2018). The mean of Pb and zinc concentrations is 0.024 mg/L for wet seasons and 0.68 mg/L for dry seasons,which are within the acceptable limits of IQS (2009) and WHO (2011) standards. The values of the Cd ranged from 0.0004 to 0.002 mg/L with an average of 0.0013 mg/L and was within the acceptable limits of WHO (2011) and IQS(2009) standards (Table 3).
4.3 Groundwater classification
4.3.1 Geochemical evaluation of groundwater in the study area
The Durov diagram was used to classify groundwater and assess and evaluate geochemically, and maybe indicatemixing of water types, ion-exchange, and reverse ion-exchange(Durov 1948).Lloyd and Heathcote(1985)divided the middle of the rectangle into nine regions.According to the Durov diagrams, Fig. 5 shows that about 83.7% of groundwater samples in dry periods and all these samples at wet periods fall in field No.6 (water type Na2-SO4)and field No.9 of Cl-Na water type which is represented by probable mixing, while 8% of the samples fall in field No.5, indicating mixed water that is affected by the dissolution in the dry period.

Table 3 Range, mean and stander deviation of the trace elements of the groundwater samples compared with the IQS(2009) and WHO (2011)standards
4.4 Geochemical modeling
To evaluate the mass transfers in the water-rock system, a geochemical mass-balance and mixing computer code NETPATH-win, an interactive user version of the mass balance model by Plummer et al.(1994)wells by assessing the chemical reaction and mixing proportions between the two upper (unconfined) aquifer and lower (semi-confined)aquifer.In this regard,the increase in total dissolved solids were considered as the criteria to indicate the two main aquifers, where the lower TDS at the groundwater well(W2)represented the upper unconfined(first end member),and the groundwater well (W16) will represent the lower semi-confined aquifer(second end member)with regard to the largest TDS. The results of the mixing ratios of the groundwater wells are shown in Table 4. The geochemical modeling results show significant variation in its values between the ranges of 10 and 100% at wells W3 to W27,W30, W32, and W36. The spatial distribution of the mixing ratio is shown in Fig. 6,where the maximum ratios are shown to be at the eastern and southeastern parts of the study area,indicating a higher deterioration in groundwater wells due to high drilling wells and extensive pumping from the lower aquifer in these wells, thus causing an increase in hydraulic conductivity between the two main aquifers.
4.5 Isotopic composition of meteoric precipitation in Basra
4.5.1 Basra local meteoric water line (Basra-MWL)

Fig. 5 Chemical facies in Durov diagram of the study area

Table 4 The mixing ratios of the groundwater wells
LMWLs for Basra were established for the first time based on the results of collected samples for six months;(Fig.7).The composite Basrah-LMWL is δ2H = 4.65 × δ18-O + 13.68(r2= 0.97).The results of δ18O and δ2H shows high ratios during March with 8.74‰ and 57.6‰, respectively,wherein the positive values pointed to condensation with high concentration rates in δ18O and δ2H,whereas the lowest values are recorded in February (- 1.40 ‰, 6.1‰)(Table 5).The negative value of δ18O indicated a depletion with δ18O concentration in the affected area, while hydrogen behaves differently,despite the positive recorded value, but it indicates that depletion in concentrations within the measured period in February did occur. When comparing isotope values in Table 5 with global measured VSMOW at 25 °C and 85%humidity,it seems that there is enrichment of18O and2H,while it reflects the depletion in the vapor or negative enrichment through November 2017 to February 2018, this depends on the climatic conditions of the study area,such as high temperature,humidity,wind speed, and distance (proximity) near the equator and the Arabian Gulf Sea region.To implement the stable isotopic data of the study area, it should use the Global Meteoric Water Line (GMWL) as a baseline. It defines the relationship between2H and18O ratios in natural terrestrial waters, expressed as a globally average according to VSMOW (Eq. 4). The value of the linear slope is about 8 and the intercept value is approximately 10 (Craig 1961).δ2H=8:13×δ18O+10:8 (4)
A highly positive correlation exists between δ18O and δ2H, where r2= 0.90 according to Eq. 5. It is interpreted that the fractionation processes are less than what can be in rainwater samples.The Local Meteoric Water Line(Basra-MWL) can differ somewhat from the GMWL, in terms of slope and intercept, and individual events will have a line different from the LMWL. The source of local rainstorms lies in some part between GMWL and the East Mediterranean Meteoric Water Line (MMWL) (Eq. 6) but a large part of BMWL lies under the GMWL in mixing estuarine area (Fig. 7). It also indicated a high ratio of evaporation.

Gat (1971) clarified the changes in slope s magnitude with the effect of relative humidity,h.at values of low h(in the order of 25%), the kinetic evaporation are maximized and s will be close to 4,whereas h would be closer to 75%,and the slop is greater than 5.Until the h reaches more than 90%, the slope will approach 8. From Fig. 7, the slope of BMWL is close to 5, which meant an extremely low humidity and that reflects the increase in air temperature,wherein the vapor will be enriched with δ18O and δ2H,while the intercept part indicates secondary evaporation during rainfall and a seasonal variation in precipitation.
4.5.2 D-excess of rainwater
The relationship between δ18O and δ2H is termed the deuterium excess (d-excess) which refers to climatic conditions and moisture sources during evaporation and precipitation. Equation (7) defines the d-excess suggested by(Dansgaard 1964).

The d-excess of local precipitation ranges from - 12.268 to 17.317 ‰, and 3.9171 ‰ on average (Table 5). Many factors can affect d-excess. The conditions of the source area are mainly controlled by water vapor and the nature of air masses prior to condensation to raindrops (Gat 1971;Froehlich et al.2002).Generally,there are different factors that may affect the isotopic composition of rainwater samples, such as moisture sources, latitude and longitude,amount and intensity of rainfall, and different climatic conditions (Hadi et al. 2016). The rainwater reflects the enrichment in18O and2H due to the increase in kinetic evaporation activity in the region. Moreover, the climatic conditions in the region do not allow the sufficient depletion and ion exchange or sufficient fractionation within the water vapor column because of low humidity ratios.
4.5.3 The stable isotopes in groundwater
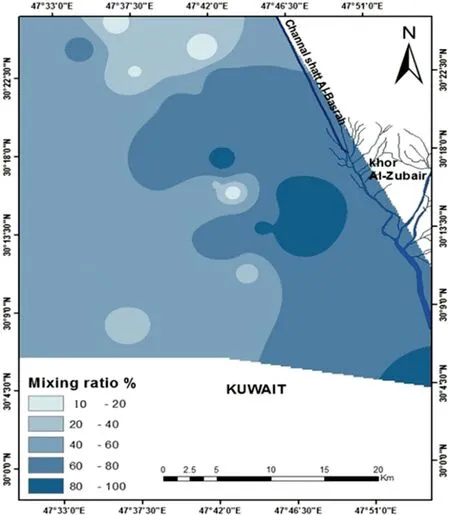
Fig. 6 The spatial distribution of the mixing ratios of groundwater wells
The isotopic content of precipitation is a fingerprint of groundwater origin. The comparison of δ18O values for groundwater with precipitation on a regional scale shows the connection between groundwater and meteoric input signal(Clark and Fritz 1997).The minimum and maximum δ18O are - 4.06 ‰ and 0.78 ‰ during dry periods. Conversely, the δ18O values at wet periods are - 4.45 ‰and - 0.23‰.The ratios of δ2H are - 27.4‰and 1.1‰as the minimum and maximum in dry periods. The wet period has a minimum of δ2H -28.6 ‰ and a maximum of - 2.9 ‰, as shown in Table 5. Dry periods (well 9)have the most depleted values, while wet period results show that well 12 has the most depleted values. Figures 8 and 9 represented the stable isotopic composition of groundwater for the dry and wet periods,wherein there is a compatibility between the BMWL and both GW dry and wet isotopic lines,indicating that the recharge source of the Dibdibba aquifer is from the rainfall, which has been influenced by the vapor water from the Arabian Gulf.From another site, the groundwater in the shallow Dibdibba aquifer is highly affected by evaporation and this is reflected by the depletion of environmental isotopes δ18O and δ2H.
4.5.4 The d-excess of groundwater
The origin of the recharge of the groundwater wells is gained from the value of the deuterium excess (d-excess)(Ghalib and Sogut 2014).Regionally,d-excess values varydue to the ns at the source region of the vapor mass relative to that at which the precipitation is derived (Merlivat and Jouzel 1979). Low d-excess values can reflect high humidity in the source region, while high d-excess values can result from lower humidity in the source region (Clark and Fritz 1997). The d-excess values of groundwater samples are listed in Table 5, the values for dry period ranged from 6.64 ‰ to - 5.15 ‰ with an average of 1.54‰,and for wet periods are ranged from 7.8‰to - 2.7‰with an average of 2.58. The d-excess is less than 10 ‰,which reflected the shallow groundwater aquifer of Dibdibba formation. Generally, the d-excess values in the dry period are lower than those in the wet period, indicating evaporative enrichment after recharge or a greater degree of evaporation in the dry period.
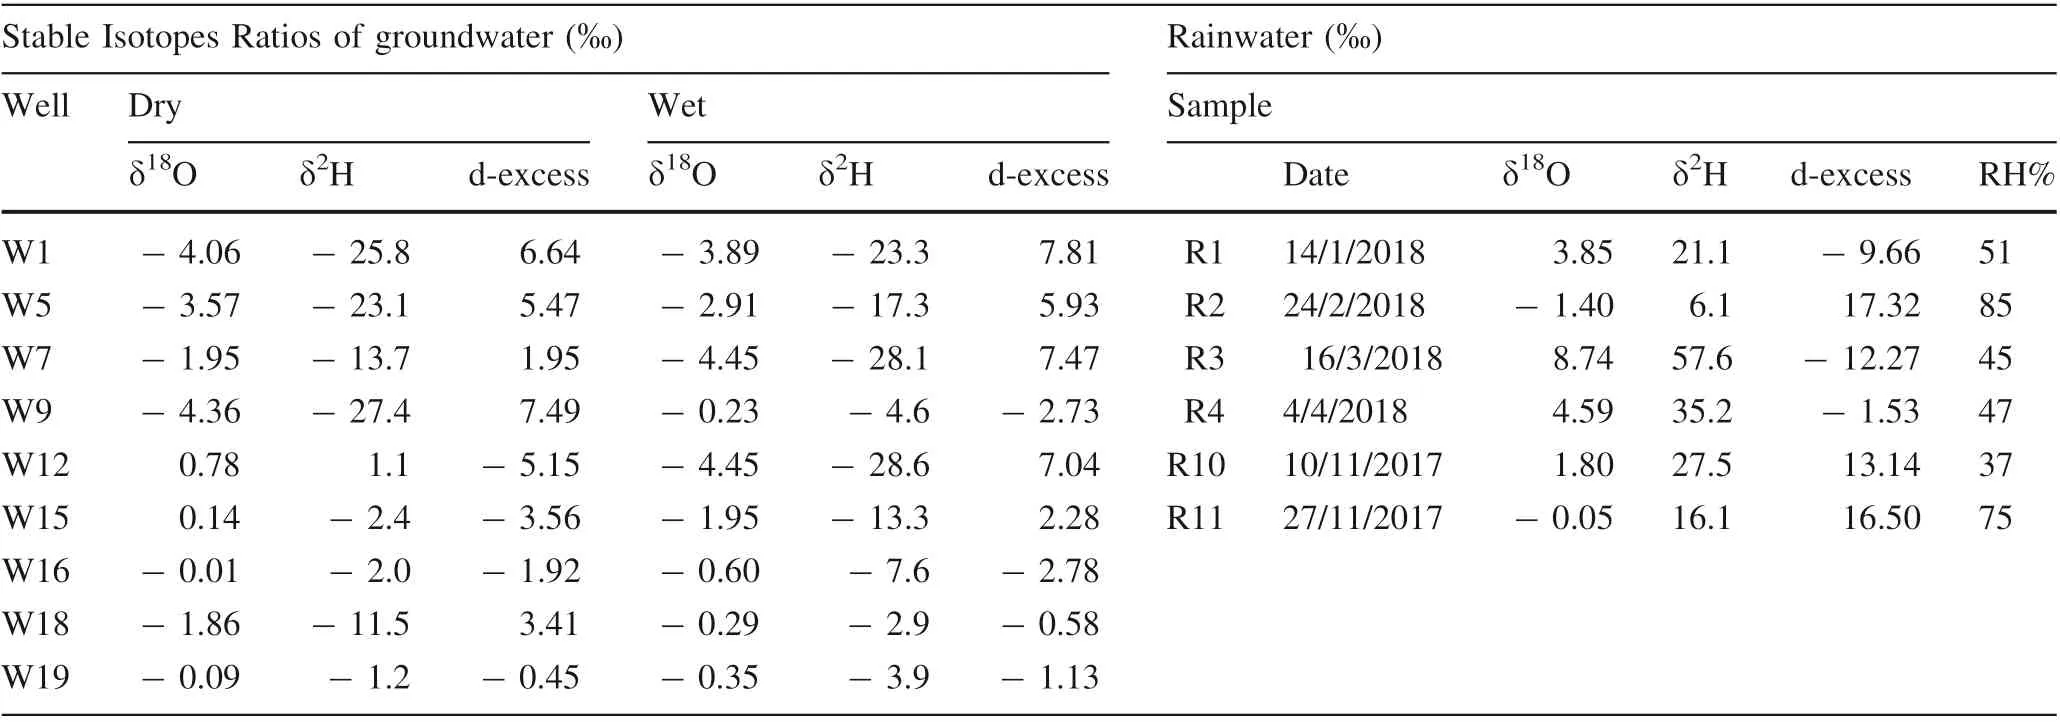
Table 5 Sampling information and stable isotopes data of groundwater and rainwater

Fig. 7 The δ2H and δ18O of local (Basrah) precipitation versus GMWL, EMWL, BMWL
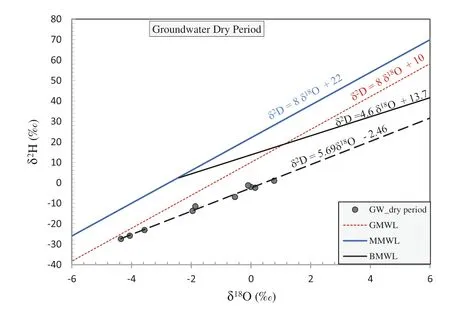
Fig. 8 The stable isotope in groundwater for dry period

Fig. 9 The stable isotope in groundwater for wet period
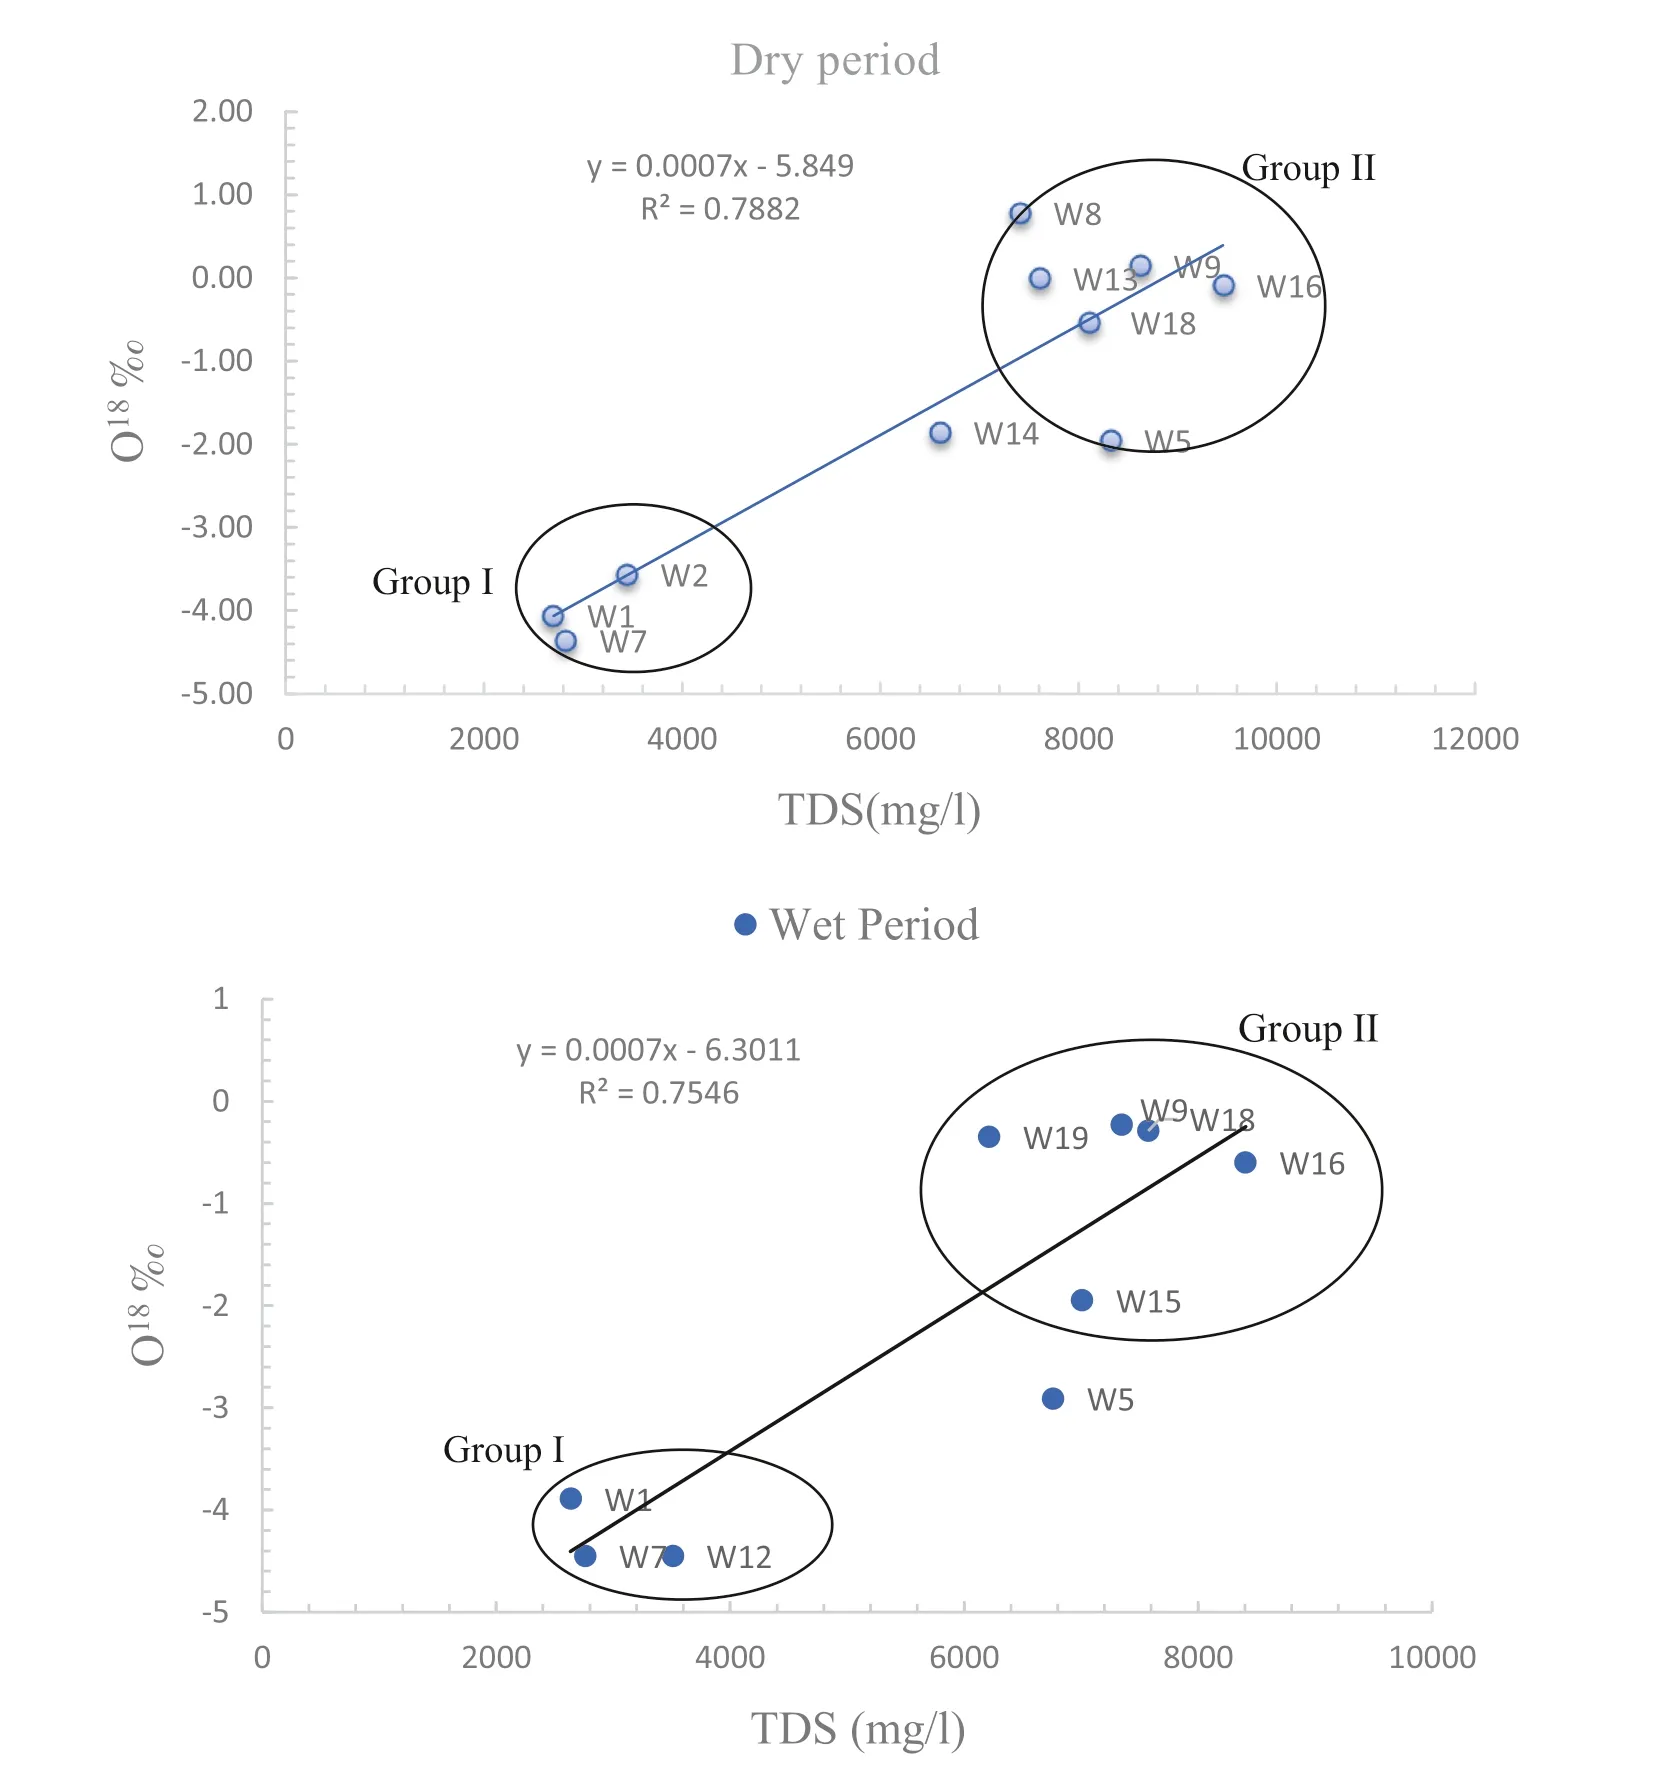
Fig. 10 The relationship between salinity and18O‰,groundwater for wet and dry period in the study area
4.6 Groundwater isotopes with salinization
Groundwater salinization is one of the most important factors that could affect water quality, especially in the aquifers near the coastal areas. Isotopic techniques are effective in identifying the source of salinity and renewability of groundwater (Gaye 2001). The relationships of δ18O with salinity and chloride have been used in many studies to identify different salinization pathways. The isotope hydrology section of the International Atomic Energy Agency (IAEA) has monitored more than 60 research contracts and technical cooperation’s in this field,the monitoring comprises the determination of the origins of groundwater salinization and assessment of groundwater resources in coastal areas.Figure 10 shows the relationship between salinity and δ18O, which shows that the samples are divided into two groups for both dry and wet periods.Group I represented the samples that are depleted with δ18O,which reflects the low concentration of salinity(W1,W7, W12), thus representing brackish groundwater from the unconfined unit. Group II has a high salinity concentration, which is relatively enriched with δ18O, thus indicating the mix between the upper unconfined unit with the lower confined unit, especially in the eastern and southern parts of the study area. Whereas the area is represented by an increase in agricultural activities as a result of an expanding population, human activities, whether agricultural, industrial, or commercial, also increase. It causes a rise in aquifer withdrawals, particularly during agricultural seasons, in a random and uncontrolled manner, which eventually leads to mixing between the confined lower aquifer and the unconfined upper aquifer.
5 Conclusion
Iron was higher than the acceptable limits, whereas zinc,lead, and cadmium was within the limits according to(WHO 2011) and (IQS 2009) standards. The high concentrations of iron can be attributed to the dissolution of rocks and ferruginous minerals as in Dibdibba Formation,iron-related smelting processes, and seepage of domestic sewage effluents. According to the Durov diagram, the groundwater samples fall within the Na2SO4water type,which is represented by the probable mixing process.Groundwater quality was deteriorating because the increase of the mixing dissolution caused by the increased pumping operation and drilling without any management plan. Stable isotope results for precipitation referred to a wide variation in rainstorm samples. Such variation indicated that the Basrah meteoric water line is far from the global meteoric water line. The stable isotope composition of groundwater samples indicated that the recharge source of the Dibdibba aquifer is from the rainfall,which has been influenced by the vapor water mainly from the Arabian Gulf.At another point,evaporation has a significant impact on groundwater in the shallow Dibdibba aquifer,which has resulted in the depletion of environmental isotopes δ18O and δ2H. The stable isotopic results have shown that the enrichment of δ18O values is relatively linked with high salinity concentration and indicated the mix between the upper unconfined and the lower confined, especially in the eastern and southern parts of the study area due to the extensive land uses. The d-access value of the two periods has shown that these values are related to high evaporation for precipitation water before entering the aquifer. These findings of geochemical modeling and isotopes results indicated an increase in groundwater quality deterioration.
AcknowledgementsThe authors are thankful to the General Commission for Groundwater/ Basra Branch especially Mr. Jabbar Al Saeedy, Mr. Ahmed Jaafar, Ammar AL Tameemi and Zuhair Ghazi AL Maslukhy for their supporting in perform chemical analysis. The authors are also pleased to thank the reviewers for their thoughtful,constructive, and useful comments, which greatly improved the manuscript.
Declarations
Conflict of interestOn behalf of all authors, the corresponding author states that there is no conflict of interest.
杂志排行
Acta Geochimica的其它文章
- Genesis and soil environmental implications of intact in-situ rhizoliths in dunes of the Badain Jaran Desert, northwestern China
- Element migration and enrichment characteristics of bedrock–regolith–soil–plant continuum system in the chestnut planting area,Chengde, China
- Geochemical evaluation of mineralization potential of the Somie-Ntem area within the Tikar plain, Cameroon: implication on petrogenesis
- Geodynamic signif icance and genesis of chromitites from the Islahiye ophiolite (Gaziantep, SE Anatolia) as constrained by platinum group element (PGE) compositions and mineral chemistry characteristics
- Hydrogeochemical processes and multivariate analysis for groundwater quality in the arid Maadher region of Hodna,northern Algeria
- Identification of terrigenous and autochthonous organic carbon in sediment cores from cascade reservoirs in the upper stream of Pearl River and Wujiang River,southwest China:lignin phenol as a tracer
